
538 had this cool visualization of the Russia investigation in the context of Watergate, Whitewater, and other historic investigations.
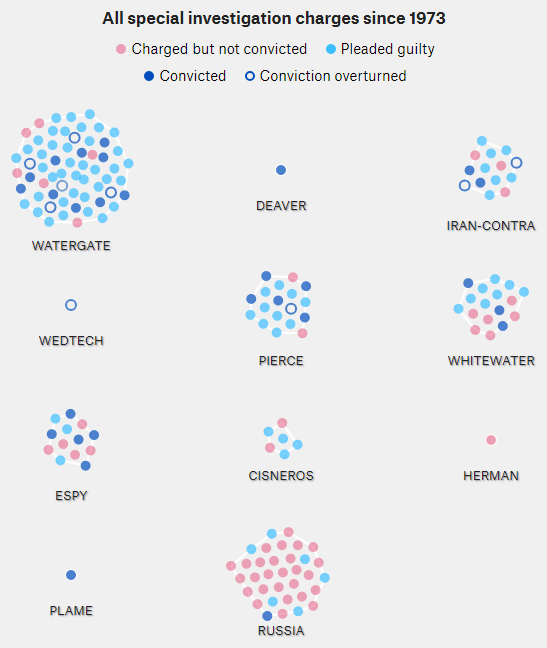
The original is fun to watch, but I found it hard to understand the time dynamics from the animation. For its maturity (660 days and counting), has the Russia investigation yielded more or fewer indictments than Watergate (1492 days total)? Are the indictments petering out, or accelerating?
A simplified version of the problem looks a lot like an infection model (a.k.a. logistic growth or Bass diffusion):
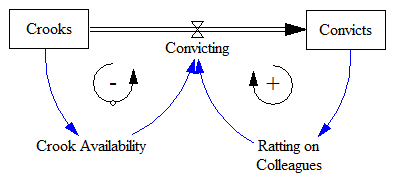
So, the interesting question is whether we can – from partway through the history of the system – estimate the ultimate number of indictments and convictions it will yield. This is fraught with danger, especially when you have no independent information about the “physics” of the system, especially the population of potential crooks to be caught.
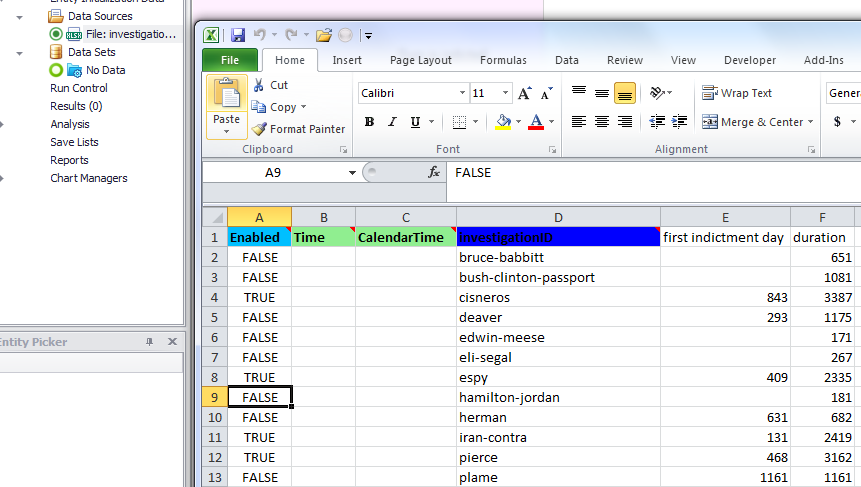
As a prelude to modeling this, I wanted to see what the histories look like. The problem is, the data on github doesn’t lend itself to that. It’s relational by event, not time series by investigation. I know I could probably convert it with a few lines of Python, but I decided to do the job in Ventity instead, because that would create the infrastructure for a future dynamic model.
The basic idea is as follows. Each row of the data seems to be an indictment (many per investigation, sometimes more than one per person). So, create one entity for each row (I called the entity an “item” before I figured out what each really represented.) Then run through time, and calculate the status (indicted or convicted) for each item. Each just looks like a step function.
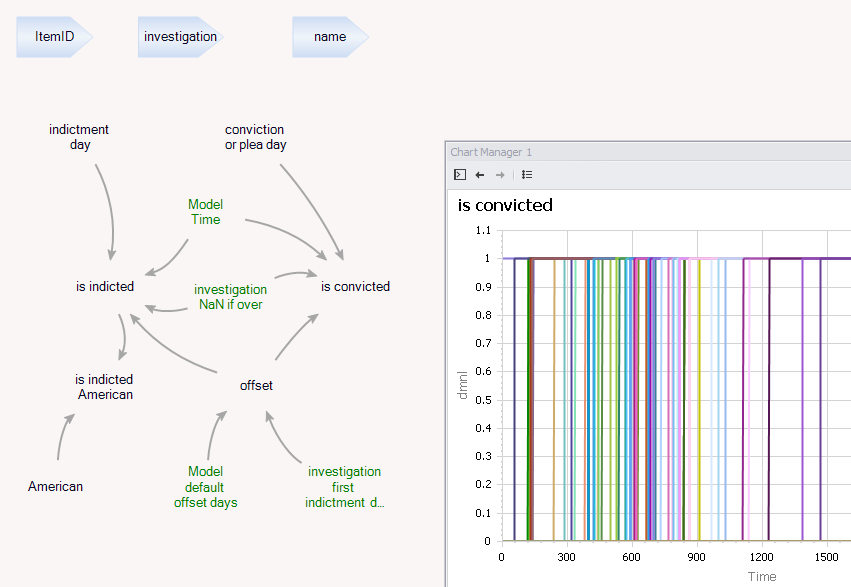
To see the results by investigation, all that’s needed is a collection of Items by Investigation that sums up the number of indictments and convictions. I also created an Investigation entity to hold a few values that are investigation-specific, such as the start and end dates, used to indicate whether the investigation is ongoing.
Timing is tricky. When do you start the clock? With the beginning of the official investigation, or with the first indictment, which could be a year earlier or later? I chose to align investigations according to the date of first indictment.
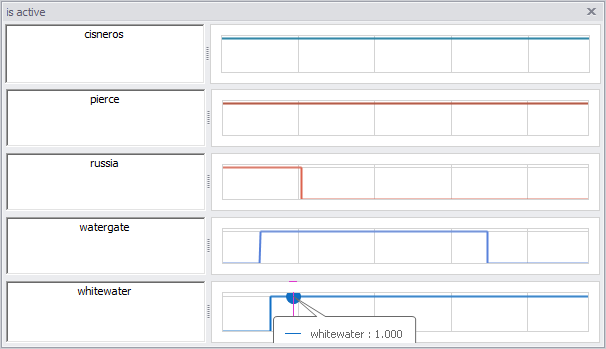
Really, there’s not much to the model; everything is in the input data, which resides in Excel. For convenience, I use the input data to turn off some of the “nuisance” investigations that never yielded much, leaving just the big ones with more than one indictment:
So what’s the answer? Here are the time series:

For total indictments, it’s big – bigger than Watergate. However, a lot of those are Russian nationals, who might be easier to catch. (The other investigations mostly target Americans).
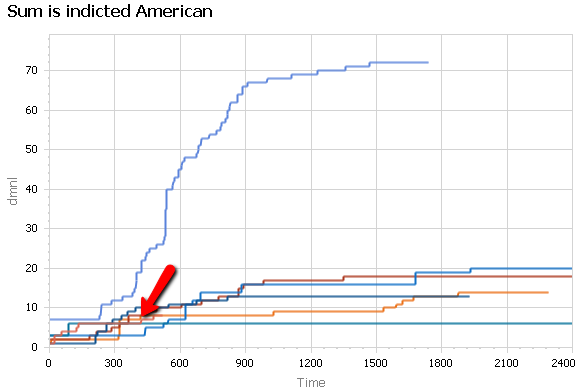
If you count only American indictments (above), Russia looks more like it’s in the middle of the pack, about the same size as Iran-Contra, for example.
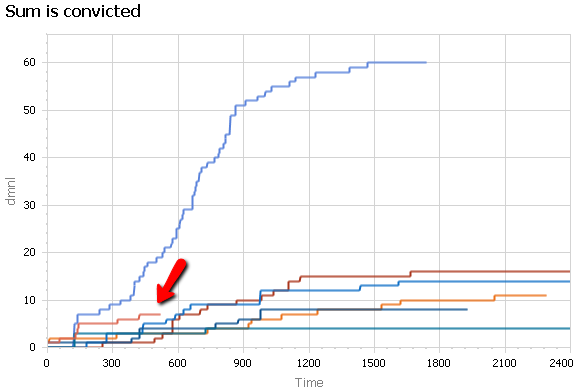
In terms of convictions, it looks like Russia is a little ahead of the pack, but not as big as Watergate.
Some other observations:
- It’s really striking how Watergate dwarfs all others.
- It’s also striking how long these things go on. I remember mind-numbing years of talk about the blue dress, but that’s not even a record.
- Except for Watergate, indictments don’t look much like a logistic process to me. It’s more like a decay process – crooks caught at a constant fractional rate, rather than positive feedback from “no honor among theives.”
The bottom line? I doubt we can say much about the future indictments in the Russia investigation by time series prediction. It’s interesting, though.
The Ventity model and data: