
There are several analyses going around that purport to prove election fraud in PA, because the first digits of vote counts don’t conform to Benford’s Law. Here’s the problem: first digits of vote counts aren’t expected to conform to Benford’s Law. So, you might just as well say that election fraud is proved by Newton’s 3rd Law or Godwin’s Law.
Benford’s Law describes the distribution of first digits when the set of numbers evaluated derives from a scale-free or Power Law distribution spanning multiple orders of magnitude. Lots of processes generate numbers like this, including Fibonacci numbers and things that grow exponentially. Social networks and evolutionary processes generate Zipf’s Law, which is Benford-conformant.
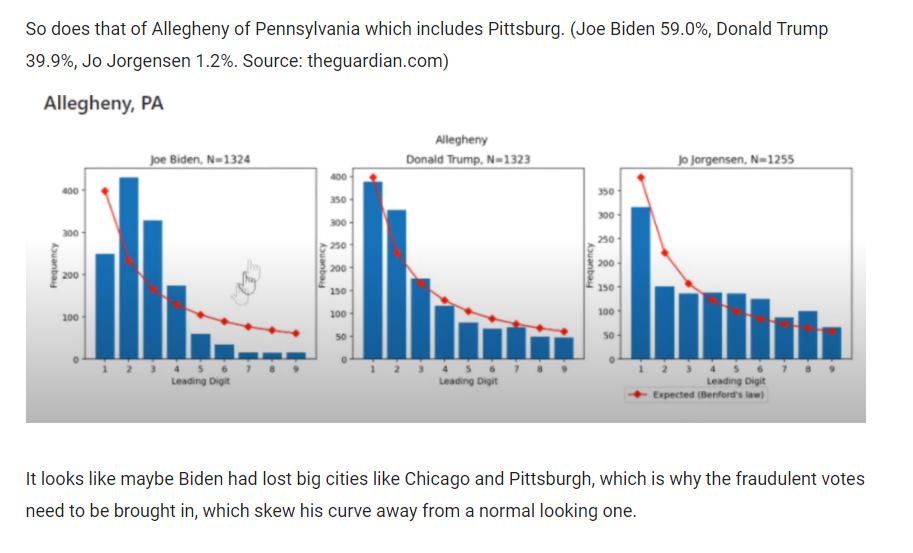
Here’s the problem: vote counts may not have this property. Voting district sizes tend to be similar and truncated above (dividing a jurisdiction into equal chunks), and vote proportions tend to be similar due to gerrymandering and other feedback processes. This means the Benford’s Law assumptions are violated, especially for the first digit.
This doesn’t mean the analysis can’t be salvaged. As a check, look at other elections for the same region. Check the confidence bounds on the test, rather than simply plotting the sample against expectations. Examine the 2nd or 3rd digits to minimize truncation bias. Best of all, throw out Benford and directly simulate a distribution of digits based on assumptions that apply to the specific situation. If what you’re reading hasn’t done these things, it’s probably rubbish.
This is really no different from any other data analysis problem. A statistical test is meaningless, unless the assumptions of the test match the phenomena to be tested. You can’t look at lightning strikes the same way you look at coin tosses. You can’t use ANOVA when the samples are non-Normal, or have unequal variances, because it assumes Normality and equivariance. You can’t make a linear fit to a curve, and you can’t ignore dynamics. (Well, you can actually do whatever you want, but don’t propose that the results mean anything.)