DeSmogBlog documents scientists’ outrage at inclusion on Dennis Avery’s list of 500 Scientists with Documented Doubts of Man-Made Global Warming Scares. Amusingly, the scientists concerned, a few of whom are deceased, are listed as “Co-Authors”. I’m going to put this new “open coauthoring” concept to work – I’m already working on abstracts. First, I think I’ll lower my Erdős number – Paul, dude, you can be my second. Next, I think I’ll team up with Einstein and Bohr to finish up quantum gravity.
Category: Climate
Glacier News
A pair of papers in Science this week refines the understanding of the acceleration of glacier flow from lubrication by meltwater. The bottom line:
Now a two-pronged study–both broader and more focused than the one that sounded the alarm–has confirmed that meltwater reaches the ice sheet’s base and does indeed speed the ice’s seaward flow. The good news is that the process is more leisurely than many climate scientists had feared. “Is it, ‘Run for the hills, the ice sheet is falling in the ocean’?” asks glaciologist Richard Alley of Pennsylvania State University in State College. “No. It matters, but it’s not huge.” The finding should ease concerns that Greenland ice could raise sea level a disastrous meter or more by the end of the century. Experts remain concerned, however, because meltwater doesn’t explain why Greenland’s rivers of ice have recently surged forward.
A remarkable excerpt:
The meltwater monitoring caught a 4-kilometer-long, 8-meter-deep lake disappearing into the ice in an hour and a half. As theorists had supposed, once the lake water was deep enough, its weight began to wedge open existing cracks, which only increased the weight of overlying water on the crack tip and accelerated cracking downward. Once the main crack reached the bottom of the ice, heat from churning water flow melted out parts of the fracture, and drainage took off. The lake disappeared in about 1.4 hours at an average rate of 8700 cubic meters per second, exceeding the average flow over Niagara Falls. That’s almost four Olympic pools a second.
Check it out (subscription required).
The Volunteers Have No Clothes
Naked Capitalism asks Why Companies Aren’t Fighting Climate Change, citing interesting new work by Karin Thorburn and Karen Fisher-Vanden, which indicates that firms lose value when undertaking (or at least signaling) greenhouse gas emissions reductions.
Specifically, we studied the stock market’s reaction when companies joined Climate Leaders, a voluntary government-industry partnership in which firms commit to a long-term reduction of their greenhouse gas emissions. Importantly, when the firms announced to the public that they were joining Climate Leaders their stock prices dropped significantly.
Naked Capitalism concludes that, “the stock market doesn’t get it.” Thorburn and Fisher-Vanden actually go a little further,
The negative market reaction for firms joining Climate Leaders reveals that the reduction of greenhouse gases is a negative net present value project for the company. That is, the capital expenditures required to cut the carbon footprint exceed the present value of the expected future benefits from these investments, such as lower energy costs and increased revenue associated with the green goodwill. Some may argue that the decline in stock price is simply evidence that the market is near-sighted and ignores the long-term benefits of the green investments. Notice, however, that the stock market generally values uncertain cash flows in a distant future despite large investments today: earlier work has shown that firms announcing major capital expenditure programs and investments in research and development tend to experience an increase in their stock price. Similarly, the stock market often assigns substantial value to growth companies with negative current earnings, but with potential profits in the future. In fact, only two percent of the publicly traded firms in the United States have joined the Climate Leaders program to date, supporting our observation that initiatives aimed at curbing greenhouse gas emissions largely are value decreasing.
I personally don’t drink enough of the economic Kool-aid to take it on faith that market perceptions are consistently right. For one thing, high oil prices haven’t been around for very long, which means that firms haven’t had a lot of time to take profitable actions. Markets haven’t had a lot of time to believe in the staying power of high oil prices or to separate the effects of firms’ energy and carbon efficiency initiatives from the noisy background. Expectations could easily be based on a bygone era. However, even if there are some $20 bills on the sidewalk at present, Thorburn and Fisher-Vanden are certainly correct in the long run: emissions reductions will entail real costs at some point. Continue reading “The Volunteers Have No Clothes”
Plus ça change, plus c’est la même chose
Last Wednesday, President Bush called for the US to halt the growth of greenhouse gas emissions by 2025:
‘It is now time for the U.S. to look beyond 2012 and take the next step,’ Mr. Bush said, a reference to his previously stated national goal, announced in 2002, of an 18 percent reduction in the growth of emissions of heat-trapping gases relative to economic growth by 2012. Mr. Bush said the nation was on track to meeting that target. – NYT
Those who remember the 2002 commitment may recall that, at the time, emissions intensity had historically fallen by 1.3% per year on its own, so that the administration policy actually committed only to an additional 0.4% decline (assuming continuity with history). With GDP growth at about 3% per year, that would leave absolute emissions growing at about 1.7% per year. In fact, intensity has fallen about 2.5% per year since 2002, with much of that in 2006. Since it’s way too soon for investments in climate-related R&D to be having any effect, it’s likely that the savings are due to $100 oil. That is not an emissions reduction method that is likely to pass a cost-benefit test.
In the context of the long term,-2.5% over 4 years is still hard to separate from noise. Continue reading “Plus ça change, plus c’est la même chose”
Trade Emissions & Cosmic Rays
Two interesting abstracts I ran across today:
Testing the proposed causal link between cosmic rays and cloud cover
A decrease in the globally averaged low level cloud cover, deduced from the ISCCP infrared data, as the cosmic ray intensity decreased during the solar cycle 22 was observed by two groups. The groups went on to hypothesize that the decrease in ionization due to cosmic rays causes the decrease in cloud cover, thereby explaining a large part of the currently observed global warming. We have examined this hypothesis to look for evidence to corroborate it. None has been found and so our conclusions are to doubt it. From the absence of corroborative evidence, we estimate that less than 23%, at the 95% confidence level, of the 11 year cycle change in the globally averaged cloud cover observed in solar cycle 22 is due to the change in the rate of ionization from the solar modulation of cosmic rays.
Almost one-quarter of carbon dioxide released to the atmosphere is emitted in the production of internationally traded goods and services. Trade therefore represents an unrivalled, and unused, tool for reducing greenhouse gas emissions.
Dangerous Assumptions
Roger Pielke Jr., Tom Wigley, and Christopher Green have a nice commentary in this week’s Nature. It argues that current scenarios are dangerously reliant on business-as-usual technical improvement to reduce greenhouse gas intensity:
Here we show that two-thirds or more of all the energy efficiency improvements and decarbonization of energy supply required to stabilize greenhouse gases is already built into the IPCC reference scenarios. This is because the scenarios assume a certain amount of spontaneous technological change and related decarbonization. Thus, the IPCC implicitly assumes that the bulk of the challenge of reducing future emissions will occur in the absence of climate policies. We believe that these assumptions are optimistic at best and unachievable at worst, potentially seriously underestimating the scale of the technological challenge associated with stabilizing greenhouse-gas concentrations.
They note that assumed rates of decarbonization exceed reality:
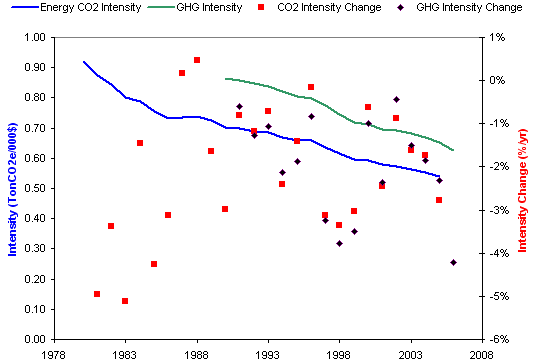
The IPCC scenarios include a wide range of possibilities for the future evolution of energy and carbon intensities. Many of the scenarios are arguably unrealistic and some are likely to be unachievable. For instance, the IPCC assumptions for decarbonization in the short term (2000’“2010) are already inconsistent with the recent evolution of the global economy (Fig. 2). All scenarios predict decreases in energy intensity, and in most cases carbon intensity, during 2000 to 2010. But in recent years, both global energy intensity and carbon intensity have risen, reversing the trend of previous decades.
In an accompanying news article, several commenters object to the notion of a trend reversal:
Energy efficiency has in the past improved without climate policy, and the same is very likely to happen in the future. Including unprompted technological change in the baseline is thus logical. It is not very helpful to discredit emission scenarios on the sole basis of their being at odds with the most recent economic trends in China. Chinese statistics are not always reliable. Moreover, the period in question is too short to signify a global trend-break. (Detlef van Vuuren)
Having seen several trend breaks evaporate, including the dot.com productivity miracle and the Chinese emissions reductions coincident with the Asian crisis, I’m inclined to agree that gloom may be premature. On the other hand, Pielke, Wigley and Green are conservative in that they don’t consider the possible pressure for recarbonization created by a transition from conventional oil and gas to coal and tar sands. A look at the long term is helpful:
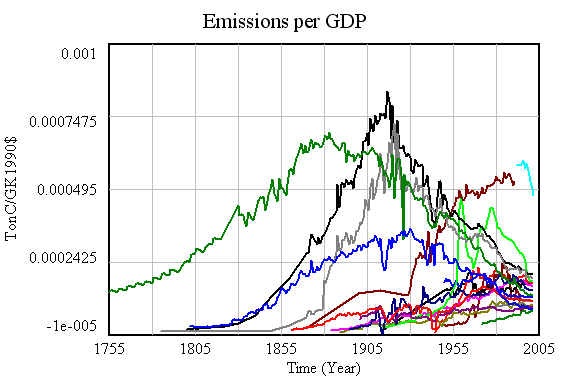
Emissions intensity of GDP for 18 major emitters. Notice the convergence in intensity, with high-intensity nations falling, and low-intensity nations (generally less-developed) rising.
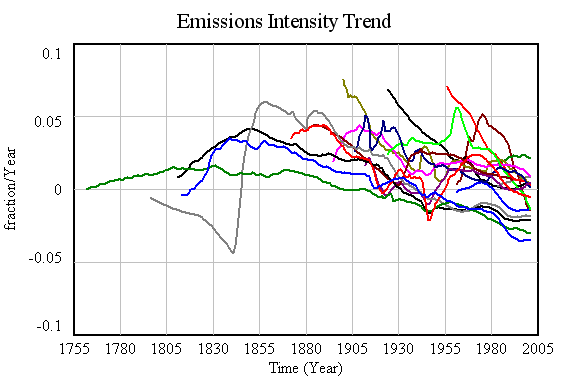
Corresponding decadal trends in emissions intensity. Over the long haul, there’s some indication that emissions are falling faster in developed nations – a reason for hope. But there’s also a lot of diversity, and many nations have positive trends in intensity. More importantly, even with major wars and depressions, no major emitter has achieved the kind of intensity trend (about -7%/yr) needed to achieve 80% emissions reductions by 2050 while sustaining 3%/yr GDP growth. That suggests that achieving aggressive goals may require more than technology, including – gasp – lifestyle changes.
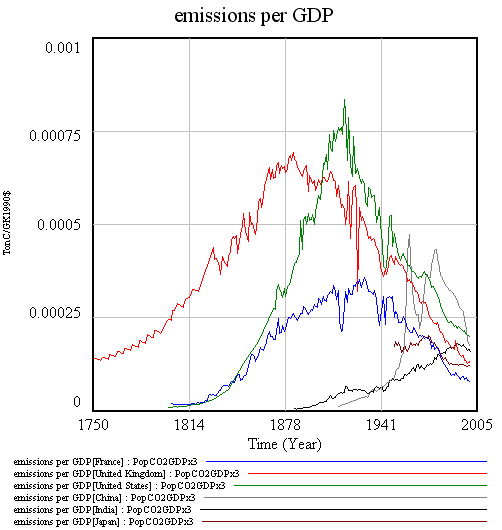
A closer look at intensity for 6 major emitters. Notice intensity rising in China and India until recently, and that Chinese data is indeed suspect.
Pielke, Wigley, and Green wrap up:
There is no question about whether technological innovation is necessary ’” it is. The question is, to what degree should policy focus directly on motivating such innovation? The IPCC plays a risky game in assuming that spontaneous advances in technological innovation will carry most of the burden of achieving future emissions reductions, rather than focusing on creating the conditions for such innovations to occur.
There’s a second risky game afoot, which is assuming that “creating the conditions for such innovations to occur” means investing in R&D, exclusive of other measures. To achieve material reductions in emissions, “occur” must mean “be adopted” not just “be invented.” Absent market signals and institutional changes, it is unlikely that technologies like carbon sequestration will ever be adopted. Others, like vehicle and lighting efficiency, could easily see their gains eroded by increased consumption of energy services, which become cheaper as technology improves productivity.
Take the bet, Al
I’ve asserted here that the Global Warming Challenge is a sucker bet. I still think that’s true, but I may be wrong about the identity of the sucker. Here are the terms of the bet as of this writing:
The general objective of the challenge is to promote the proper use of science in formulating public policy. This involves such things as full disclosure of forecasting methods and data, and the proper testing of alternative methods. A specific objective is to develop useful methods to forecast global temperatures. Hopefully other competitors would join to show the value of their forecasting methods. These are objectives that we share and they can be achieved no matter who wins the challenge.
Al Gore is invited to select any currently available fully disclosed climate model to produce the forecasts (without human adjustments to the model’s forecasts). Scott Armstrong’s forecasts will be based on the naive (no-change) model; that is, for each of the ten years of the challenge, he will use the most recent year’s average temperature at each station as the forecast for each of the years in the future. The naïve model is a commonly used benchmark in assessing forecasting methods and it is a strong competitor when uncertainty is high or when improper forecasting methods have been used.
Specifically, the challenge will involve making forecasts for ten weather stations that are reliable and geographically dispersed. An independent panel composed of experts agreeable to both parties will designate the weather stations. Data from these sites will be listed on a public web site along with daily temperature readings and, when available, error scores for each contestant.
Starting at the beginning of 2008, one-year ahead forecasts then two-year ahead forecasts, and so on up to ten-year-ahead forecasts of annual ‘mean temperature’ will be made annually for each weather station for each of the next ten years. Forecasts must be submitted by the end of the first working day in January. Each calendar year would end on December 31.
The criteria for accuracy would be the average absolute forecast error at each weather station. Averages across stations would be made for each forecast horizon (e.g., for a six-year ahead forecast). Finally, simple unweighted averages will be made of the forecast errors across all forecast horizons. For example, the average across the two-year ahead forecast errors would receive the same weight as that across the nine-year-ahead forecast errors. This unweighted average would be used as the criterion for determining the winner.
I previously noted several problems with the bet:
The Global Warming Challenge is indeed a sucker bet, with terms slanted to favor the naive forecast. It focuses on temperature at just 10 specific stations over only 10 years, thus exploiting the facts that (a) GCMs do not have local resolution (their grids are typically several degrees) (b) GCMs, unlike weather models, do not have infrastructure for realtime updating of forcings and initial conditions (c) ten stations is a pathetically small sample, and thus a low signal-to-noise ratio is expected under any circumstances (d) the decadal trend in global temperature is small compared to natural variability.
It’s actually worse than I initially thought. I assumed that Armstrong would determine the absolute error of the average across the 10 stations, rather than the average of the individual absolute errors. By the triangle inequality, the latter is always greater than or equal to the former, so this approach further worsens the signal-to-noise ratio and enhances the advantage of the naive forecast. In effect, the bet is 10 replications of a single-station test. But wait, there’s still more: the procedure involves simple, unweighted averages of errors across all horizons. But there will be only one 10-year forecast, two 9-year forecasts … , and ten 1-year forecasts. If the temperature and forecast are stationary, the errors at various horizons have the same magnitude, and the weighted average horizon is only four years. Even with other plausible assumptions, the average horizon of the experiment is much less than 10 years, further reducing the value of an accurate long-term climate model.
However, there is a silver lining. I have determined, by playing with the GHCN data, that Armstrong’s procedure can be reliably beaten by a simple extension of a physical climate model published a number of years ago. I’m busy and I have a high discount rate, so I will happily sell this procedure to the best reasonable offer (remember, you stand to make $10,000).
Update: I’m serious about this, by the way. It can be beaten.
More on Climate Predictions
No pun intended.
Scott Armstrong has again asserted on the JDM list that global warming forecasts are merely unscientific opinions (ignoring my prior objections to the claim). My response follows (a bit enhanced here, e.g., providing links).
Today would be an auspicious day to declare the death of climate science, but I’m afraid the announcement would be premature.
JDM researchers might be interested in the forecasts of global warming as they are based on unaided subjective forecasts (unaided by forecasting principles) entered into complex computer models.
This seems to say that climate scientists first form an opinion about the temperature in 2100, or perhaps about climate sensitivity to 2x CO2, then tweak their models to reproduce the desired result. This is a misperception about models and modeling. First, in a complex physical model, there is no direct way for opinions that represent outcomes (like climate sensitivity) to be “entered in.” Outcomes emerge from the specification and calibration process. In a complex, nonlinear, stochastic model it is rather difficult to get a desired behavior, particularly when the model must conform to data. Climate models are not just replicating the time series of global temperature; they first must replicate geographic and seasonal patterns of temperature and precipitation, vertical structure of the atmosphere, etc. With a model that takes hours or weeks to execute, it’s simply not practical to bend the results to reflect preconceived notions. Second, not all models are big and complex. Low order energy balance models can be fully estimated from data, and still yield nonzero climate sensitivity.
I presume that the backing for the statement above is to be found in Green and Armstrong (2007), on which I have already commented here and on the JDM list. Continue reading “More on Climate Predictions”
Flying South
A spruce budworm outbreak here has me worried about the long-term health of our forest, given that climate change is likely to substantially alter conditions here in Montana. The nightmare scenario is for temperatures to warm up without soil moisture keeping up, so that drought-weakened trees are easily ravaged by budworm and other pests, unchecked by the good hard cold you can usually count on here at some point in January, with dead stands ultimately burning before a graceful succession of species can take place. The big questions, then, are what’s the risk, how to see it coming, and how to adapt.
To get a look at the risk, I downloaded some GCM results from the CMIP3 archive. These are huge files, and unfortunately not very informative about local conditions because the global grids simply aren’t fine enough to resolve local features. I’ve been watching for some time for a study to cover my region, and at last there are some preliminary results from Eric Salathé at University of Washington. Regional climate modeling is still an uncertain business, but the results are probably as close as one can come to a peek at the future.
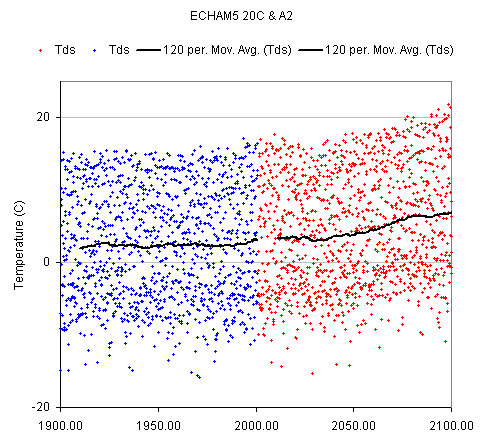
The future is generally warmer. Here’s the regional temperature trend for my grid point, using the ECHAM5 model (downscaled) for the 20th century (blue) and IPCC A2 forcings (red), reported as middle-of-the-road warming:
Space Tourism & Climate
The Saturn V used for the Apollo missions burned 203,000 gallons of RP-1 (basically kerosene) in its first stage. At 820 kg/m^3, that’s 630 metric tons of fuel. Liquid hydrocarbons tend to be close to CxH2x, or about 85% carbon by mass, so that’s 536 metric tons of carbon, which yields 1965 tons CO2 when burned, or 655 TonCO2/astronaut. Obviously that’s not personal consumption, but it is a lot of carbon in the atmosphere.
The emerging space tourism industry, on the other hand, is primarily personal consumption. I’d love to take the trip, but I’d be a little put off if the consequences of seeing the big blue marble from above were to make a major contribution to climate change. So, what are the consequences?