The dynamics of UFO sightings

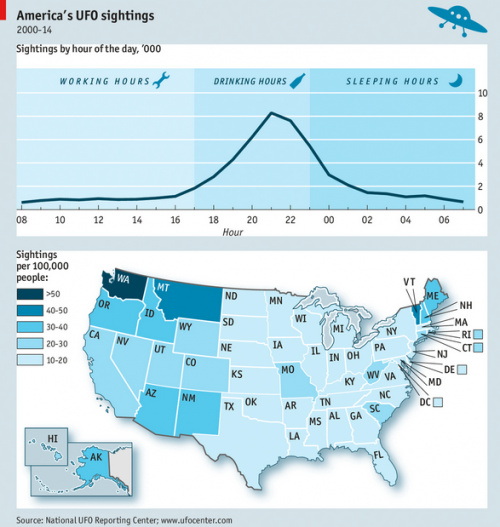
The Economist reports on UFO sightings:

UFOdataThis deserves a model:

UFOs

UFOs.vpm (Vensim published model, requires Pro/DSS or the free Reader)

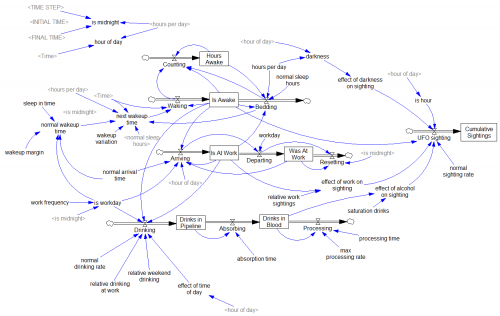
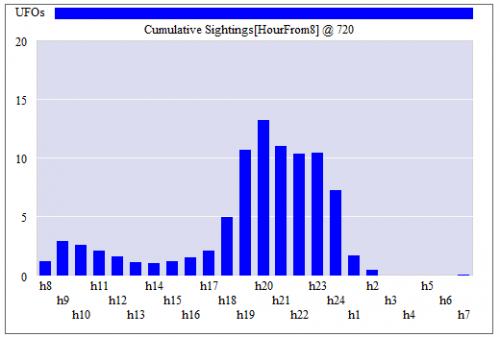
The model is a mixed discrete/continuous simulation of an individual sleeping, working and drinking. This started out as a multi-agent model, but I realized along the way that sleeping, working and drinking is a fairly ergodic process on long time scales (at least with respect to UFOs), so one individual with a distribution of behaviors over time or simulations is as good as a population of agents.

The model replicates the data somewhat faithfully:

UFOdistributionThe model shows a morning peak (people awake but out and about) and a workday dip (inside, lurking near the water cooler) but the data do not. This suggests to me that:

  • Alcohol is the dominant factor in sightings.
  • I don’t party nearly enough to see a UFO.

Actually, now that I’ve built this version, I think the interesting model would have a longer time horizon, to address the non-ergodic part: contagion of sightings across individuals.

h/t Andreas Größler.

Early economic dynamics: Samuelson's multiplier-accelerator

Paul Samuelson’s 1939 analysis of the multiplier-accelerator is a neat piece of work. Too bad it’s wrong.

Interestingly, this work dates from a time in which the very idea of a mathematical model was still questioned:

Contrary to the impression commonly held, mathematical methods properly employed, far from making economic theory more abstract, actually serve as a powerful liberating device enabling the entertainment and analysis of ever more realistic and complicated hypotheses.

Samuelson should be hailed as one of the early explorers of a very big jungle.

The basic statement of the model is very simple:
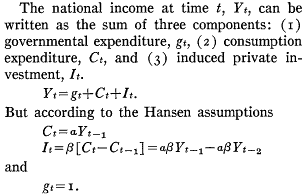
NationalIncome

In quasi-System Dynamics notation, that looks like:
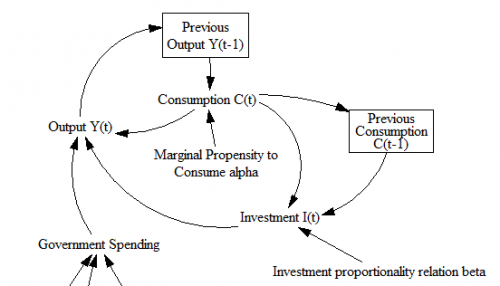
SamuelsonDiagramB

A caveat:

The limitations inherent in so simplified a picture as that presented here should not be overlooked. In particular, it assumes that the marginal propensity to consume and the relation are constants; actually these will change with the level of income, so that this representation is strictly a marginal analysis to be applied to the study of small oscillations. Nevertheless it is more general than the usual analysis.

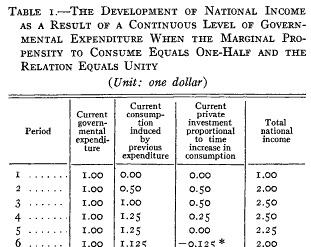
Samuelson hand-simulated the model (it’s fun – once – but he runs four scenarios):Simulated Samuelson then solves the discrete time system, to identify four regions with different behavior: goal seeking (exponential decay to a steady state), damped oscillations, unstable (explosive) oscillations, and unstable exponential growth or decline. He nicely maps the parameter space:
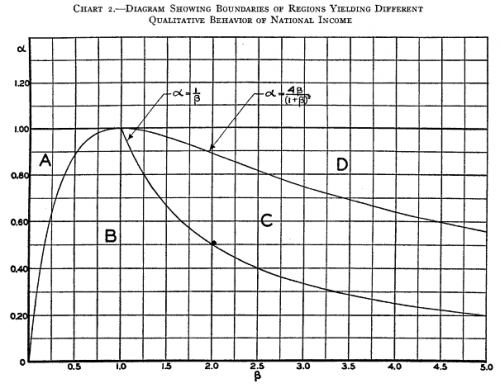
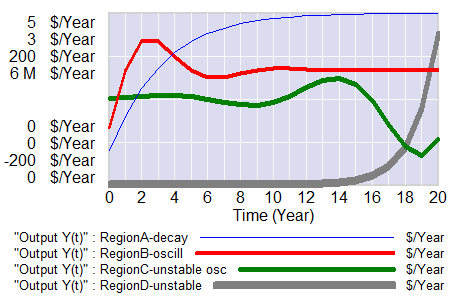
parameterSpace

ParamRegionBehaviorSo where’s the problem?

The first is not so much of Samuelson’s making as it is a limitation of the pre-computer era. The essential simplification of the model for analytic solution is;

Simplified

This is fine, but it’s incredibly abstract. Presented with this equation out of context – as readers often are – it’s almost impossible to posit a sensible description of how the economy works that would enable one to critique the model. This kind of notation remains common in econometrics, to the detriment of understanding and progress.

At the first SD conference, Gil Low presented a critique and reconstruction of the MA model that addressed this problem. He reconstructed the model, providing an operational description of the economy that remains consistent with the multiplier-accelerator framework.
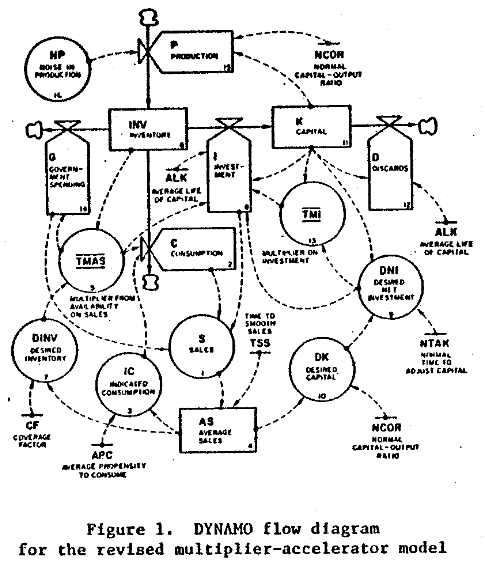
LowThe mere act of crafting a stock-flow description reveals problem #1: the basic multiplier-accelerator doesn’t conserve stuff.

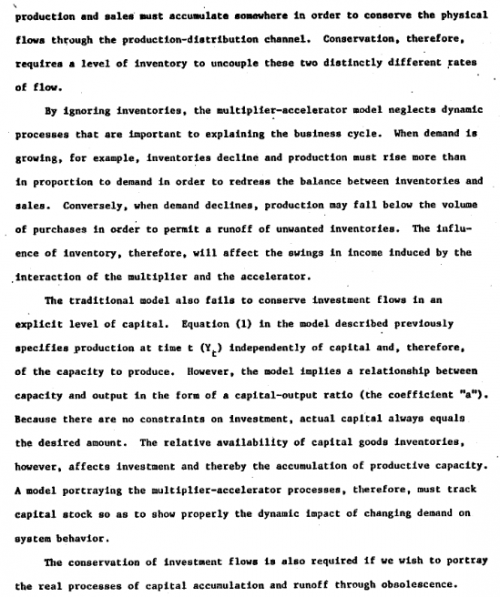
inventory1 InventoryCapital2Non-conservation of stuff leads to problem #2. When you do implement inventories and capital stocks, the period of multiplier-accelerator oscillations moves to about 2 decades – far from the 3-7 year period of the business cycle that Samuelson originally sought to explain. This occurs in part because the capital stock, with a 15-year lifetime, introduces considerable momentum. You simply can’t discover this problem in the original multiplier-accelerator framework, because too many physical and behavioral time constants are buried in the assumptions associated with its 2 parameters.

Low goes on to introduce labor, finding that variations in capacity utilization do produce oscillations of the required time scale.

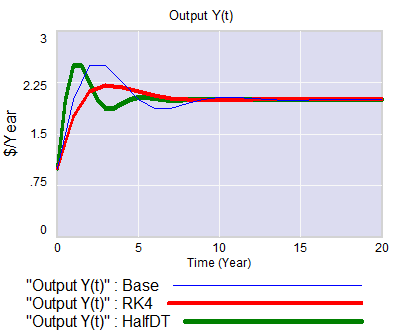
ShortTermI think there’s a third problem with the approach as well: discrete time. Discrete time notation is convenient for matching a model to data sampled at regular intervals. But the economy is not even remotely close to operating in discrete annual steps. Moreover a one-year step is dangerously close to the 3-year period of the business cycle phenomenon of interest. This means that it is a distinct possibility that some of the oscillatory tendency is an artifact of discrete time sampling. While improper oscillations can be detected analytically, with discrete time notation it’s not easy to apply the simple heuristic of halving the time step to test stability, because it merely compresses the time axis or causes problems with implicit time constants, depending on how the model is implemented. Halving the time step and switching to RK4 integration illustrates these issues:
RK4

It seems like a no-brainer, that economic dynamic models should start with operational descriptions, continuous time, and engineering state variable or stock flow notation. Abstraction and discrete time should emerge as simplifications, as needed for analysis or calibration. The fact that this has not become standard operating procedure suggests that the invisible hand is sometimes rather slow as it gropes for understanding.

The model is in my library.

See Richardson’s Feedback Thought in Social Science and Systems Theory for more history.
Samuelson’s Multiplier Accelerator

This is a fairly direct implementation of the multiplier-accelerator model from Paul Samuelson’s classic 1939 paper,

“Interactions between the Multiplier Analysis and the Principle of Acceleration” PA Samuelson – The Review of Economics and Statistics, 1939 (paywalled on JSTOR, but if you register you can read a limited number of publications for free)

SamuelsonDiagramB

This is a nice example of very early economic dynamics analyses, and also demonstrates implementation of discrete time notation in Vensim. Continue reading “Samuelson’s Multiplier Accelerator”

Bulbs banned

The incandescent ban is underway.

Conservative think tanks still hate it:

Actually, I think it’s kind of a dumb idea too – but not as bad as you might think, and in the absence of real energy or climate policy, not as dumb as doing nothing. You’d have to be really dumb to believe this:

The ban was pushed by light bulb makers eager to up-sell customers on longer-lasting and much more expensive halogen, compact fluourescent, and LED lighting.

More expensive? Only in a universe where energy and labor costs don’t count (Texas?) and for a few applications (very low usage, or chicken warming).

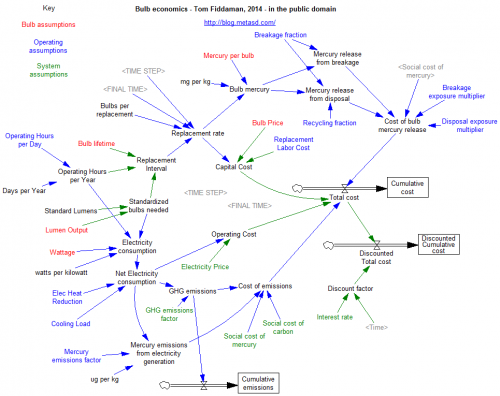
bulb economicsOver the last couple years I’ve replaced almost all lighting in my house with LEDs. The light is better, the emissions are lower, and I have yet to see a failure (unlike cheap CFLs).

I built a little bulb calculator in Vensim, which shows huge advantages for LEDs in most situations, even with conservative assumptions (low social price of carbon, minimum wage) it’s hard to make incandescents look good. It’s also a nice example of using Vensim for spreadsheet replacement, on a problem that’s not very dynamic but has natural array structure.

bulbModelGet it: bulb.mdl or bulb.vpm (uses arrays, so you’ll need the free Model Reader)

What's the empirical distribution of parameters?

Vensim‘s answer to exploring ill-behaved problem spaces is either to do hill-climbing with random restarts, or MCMC and simulated annealing. Either way, you need to start with some initial distribution of points to search.

It’s helpful if that distribution is somehow efficient at exploring the interesting parts of the space. I think this is closely related to the problem of selecting uninformative priors in Bayesian statistics. There’s lots of research about appropriate uninformative priors for various kinds of parameters. For example,

  • If a parameter represents a probability, one might choose the Jeffreys or Haldane prior.
  • Indifference to units, scale and inversion might suggest the use of a log uniform prior, where nothing else is known about a positive parameter

However, when a user specifies a parameter in Vensim, we don’t even know what it represents. So what’s the appropriate prior for a parameter that might be positive or negative, a probability, a time constant, a scale factor, an initial condition for a physical stock, etc.?

On the other hand, we aren’t quite as ignorant as the pure maximum entropy derivation usually assumes. For example,

  • All numbers have to lie between the largest and smallest float or double, i.e. +/- 3e38 or 2e308.
  • More practically, no one scales their models such that a parameter like 6.5e173 would ever be required. There’s a reason that metric prefixes range from yotta to yocto (10^24 to 10^-24). The only constant I can think of that approaches that range is Avogadro’s number (though there are probably others), and that’s not normally a changeable parameter.
  • For lots of things, one can impose more constraints, given a little more information,
    • A time constant or delay must lie on [TIME STEP,infinity], and the “infinity” of interest is practically limited by the simulation duration.
    • A fractional rate of change similarly must lie on [-1/TIME STEP,1/TIME STEP] for stability
    • Other parameters probably have limits for stability, though it may be hard to discover them except by experiment.
    • A parameter with units of year is probably modern, [1900-2100], unless you’re doing Mayan archaeology or paleoclimate.

At some point, the assumptions become too heroic, and we need to rely on users for some help. But it would still be really interesting to see the distribution of all parameters in real models. (See next …)

Environmental Homeostasis

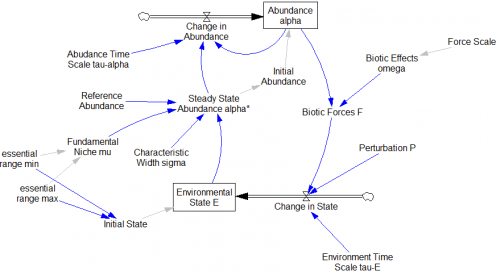
Replicated from

The Emergence of Environmental Homeostasis in Complex Ecosystems

The Earth, with its core-driven magnetic field, convective mantle, mobile lid tectonics, oceans of liquid water, dynamic climate and abundant life is arguably the most complex system in the known universe. This system has exhibited stability in the sense of, bar a number of notable exceptions, surface temperature remaining within the bounds required for liquid water and so a significant biosphere. Explanations for this range from anthropic principles in which the Earth was essentially lucky, to homeostatic Gaia in which the abiotic and biotic components of the Earth system self-organise into homeostatic states that are robust to a wide range of external perturbations. Here we present results from a conceptual model that demonstrates the emergence of homeostasis as a consequence of the feedback loop operating between life and its environment. Formulating the model in terms of Gaussian processes allows the development of novel computational methods in order to provide solutions. We find that the stability of this system will typically increase then remain constant with an increase in biological diversity and that the number of attractors within the phase space exponentially increases with the number of environmental variables while the probability of the system being in an attractor that lies within prescribed boundaries decreases approximately linearly. We argue that the cybernetic concept of rein control provides insights into how this model system, and potentially any system that is comprised of biological to environmental feedback loops, self-organises into homeostatic states.

See my related blog post for details.

Continue reading “Environmental Homeostasis”

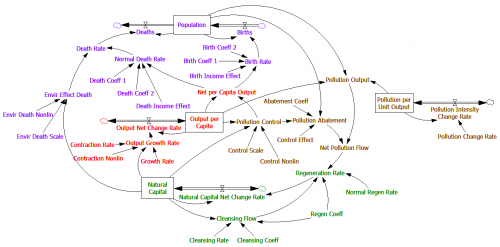
Wonderland

Wonderland model by Sanderson et al.; see Alexandra Milik, Alexia Prskawetz, Gustav Feichtinger, and Warren C. Sanderson, “Slow-fast Dynamics in Wonderland,” Environmental Modeling and Assessment 1 (1996) 3-17.

Here’s an excerpt from my 1998 critique of this model: Continue reading “Wonderland”

Timing Vensim models

Need to time model runs? One way to do it is with Vensim’s log commands, in a cmd script or Venapp:

LOG>CREATE|timing.txt
LOG>MESSAGE|timing.txt|"About to run."
LOG>TIMESTAMP|timing.txt
MENU>RUN|o
LOG>TIMESTAMP|timing.txt
LOG>MESSAGE|timing.txt|"Ran."

These commands were designed for logging user interaction, so they don’t offer millisecond resolution needed for small models. For that, another option is to use the .dll.

Generally, model execution time is close to proportional with equation count x time step count, with exceptions for iterative functions (FIND ZERO) and RK auto integration. You can use the .dll’s vensim_get_varattrib to count equations (expanding subscripts) if it’s helpful for planning to maximize simulation speed.

Early warnings of catastrophe

Catastrophic Collapse Can Occur without Early Warning: Examples of Silent Catastrophes in Structured Ecological Models (PLOS ONE – open access)

Catastrophic and sudden collapses of ecosystems are sometimes preceded by early warning signals that potentially could be used to predict and prevent a forthcoming catastrophe. Universality of these early warning signals has been proposed, but no formal proof has been provided. Here, we show that in relatively simple ecological models the most commonly used early warning signals for a catastrophic collapse can be silent. We underpin the mathematical reason for this phenomenon, which involves the direction of the eigenvectors of the system. Our results demonstrate that claims on the universality of early warning signals are not correct, and that catastrophic collapses can occur without prior warning. In order to correctly predict a collapse and determine whether early warning signals precede the collapse, detailed knowledge of the mathematical structure of the approaching bifurcation is necessary. Unfortunately, such knowledge is often only obtained after the collapse has already occurred.

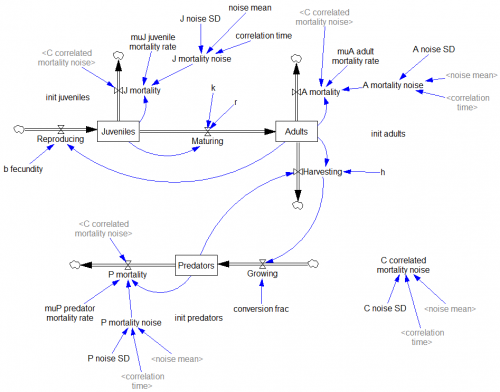
This is a third-order ecological model with juvenile and adult prey and a predator:

See my related blog post on the topic, in which I also mention a generic model of critical slowing down.

The model, with changes files (.cin) implementing some of the experiments: CatastropheWarning.zip

Arab Spring

Hard on the heels of commitment comes another interesting, small social dynamics model on Arxiv. This one’s about the dynamics of the Arab Spring.

The self-immolation of Mohamed Bouazizi on December 17, 2011 in the small Tunisian city of Sidi Bouzid, set off a sequence of events culminating in the revolutions of the Arab Spring. It is widely believed that the Internet and social media played a critical role in the growth and success of protests that led to the downfall of the regimes in Egypt and Tunisia. However, the precise mechanisms by which these new media affected the course of events remain unclear. We introduce a simple compartmental model for the dynamics of a revolution in a dictatorial regime such as Tunisia or Egypt which takes into account the role of the Internet and social media. An elementary mathematical analysis of the model identifies four main parameter regions: stable police state, meta-stable police state, unstable police state, and failed state. We illustrate how these regions capture, at least qualitatively, a wide range of scenarios observed in the context of revolutionary movements by considering the revolutions in Tunisia and Egypt, as well as the situation in Iran, China, and Somalia, as case studies. We pose four questions about the dynamics of the Arab Spring revolutions and formulate answers informed by the model. We conclude with some possible directions for future work.

http://arxiv.org/abs/1210.1841

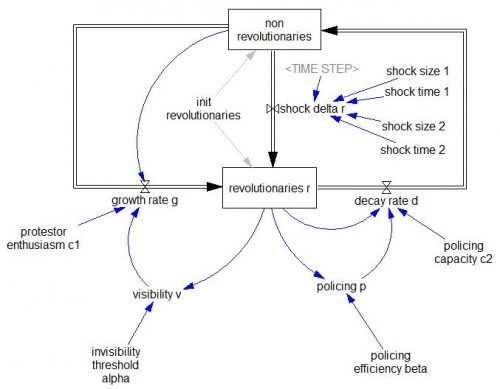
The model has two levels, but since non revolutionaries = 1 – revolutionaries, they’re not independent, so it’s effectively first order. This permits thorough analytical exploration of the dynamics.

This model differs from typical SD practice in that the formulations for visibility and policing use simple discrete logic – policing either works or it doesn’t, for example. There are also no explicit perception processes or delays. This keeps things simple for analysis, but also makes the behavior somewhat bang-bang. An interesting extension of this model would be to explore more operational, behavioral decision rules.

The model can be used as is to replicate the experiments in Figs. 8 & 9. Further experiments in the paper – including parameter changes that reflect social media – should also be replicable, but would take a little extra structure or Synthesim overrides.

This model runs with any recent Vensim version.

ArabSpring1.mdl

ArabSpring1.vpm

I’d especially welcome comments on the model and analysis from people who know the history of events better than I do.