The Mysterious TREND Function

This post is literally trending.

Most System Dynamics software includes a pair of TREND and FORECAST functions. For historic reasons, these are typically the simplest possible first-order structure, which is fine for continuous, deterministic models, but not the best for applications with noise or real data. The waters are further muddied by the fact that Excel has a TREND function that’s really FORECASTing, plus newer FORECAST functions with methods that may differ from typical SD practice. Business Dynamics describes a third-order TREND function that’s considerably better for real-world applications.

As a result of all this variety, I think trend measurement and forecasting remain unnecessarily mysterious, so I built the model below to compare several approaches.

Goal

The point of TREND and FORECAST functions is to model the formation of expectations in a way that closely matches what people in the model are really doing.

This could mean a wide variety of things. In many cases, people aren’t devoting formal thought to observing and predicting the phenomenon of interest. In that case, adaptive expectations may be a good model. The implementation in SD is the SMOOTH function. Using a SMOOTH to set expectations says that people expect the future to be like the past, and they perceive changes in conditions only gradually. This is great if the forecasted variable is in fact stationary, or at least if changes are slow compared to the perception time. On the other hand, for a fast-evolving situation like COVID19, delay can be fatal – literally.

For anything that is in fact changing (or that people perceive to be changing), it makes sense to project changes into the future with some kind of model. For a tiny fraction of reality, that might mean a sophisticated model: multiple regression, machine learning, or some kind of calibrated causal model, for example. However, most things are not subject to that kind of sophisticated scrutiny. Instead, expectations are likely to be formed by some kind of simple extrapolation of past trends into the future.

In some cases, things that are seemingly modeled in a sophisticated way may wind up looking a lot like extrapolation, due to human nature. The forecasters form a priori expectations of what “good” model projections look like, based on fairly naive adaptive-extrapolative expectations and social processes, and use those expectations to filter the results that are deemed acceptable. This makes the sophisticated results look a lot like extrapolation. However, the better the model, the harder it is for this to happen.

More Oil Price Forecasts

The goal, by the way, is generally not to use trend-like functions to make a forecast. Extrapolation may be perfectly reasonable in some cases, particularly where you don’t care too much about the outcome. But generally, you’re better off with a more sophisticated model – the whole point of SD and other methods is to address the feedback and nonlinearities that make extrapolation and other simpleminded methods go wrong. On the other hand, simple extrapolation may be great for creating a naive or null forecast to use as a benchmark for comparison with better approaches.

Basics

So, let’s suppose you want to model the expectations for something that people perceive to be (potentially) steadily increasing or decreasing. You can visit St. Louis FRED and find lots of economic series like this – GDP, prices, etc. Here’s the spot price of West Texas Intermediate crude oil:
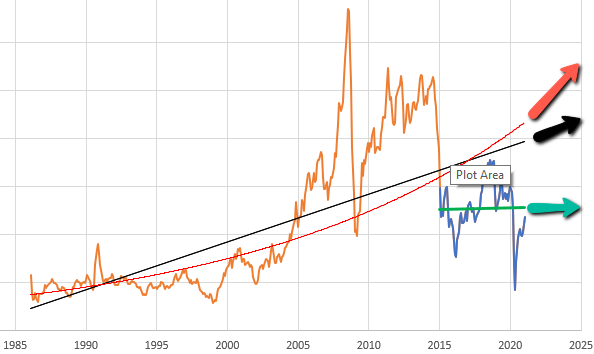
Given this data, there are immediately lots of choices. Thinking about someone today making an investment conditional on future oil prices, should they extrapolate linearly (black and green lines) or exponentially (red line)? Should they use the whole series (black and red) or just the last few years (green)? Each of these implies a different forecast for the future.

Suppose we have some ideas about the forecast horizon, desired sensitivity to noise, etc. How do we actually establish a trend? One option is linear regression, which is just a formal way of eyeballing a straight line that fits some data. It works well, but has some drawbacks. First, it assigns equal weight to all the data throughout the interval, and zero weight to anything outside the interval. That may be a poor model for perceptual processes, where the most recent data has the greatest salience to the decision maker. Second, it’s computation- and storage-intensive: you have to do a lot of math, and keep track of every data point within the window of interest. That’s fine if it resides in a spreadsheet, but not if it resides in someone’s head.
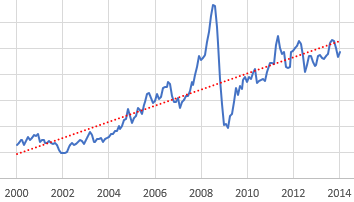
Linear fit to a subset of the WTI spot price data.

The trend-like functions make an elegant simplification that addresses the drawbacks of regression. It’s based on the following observation:*
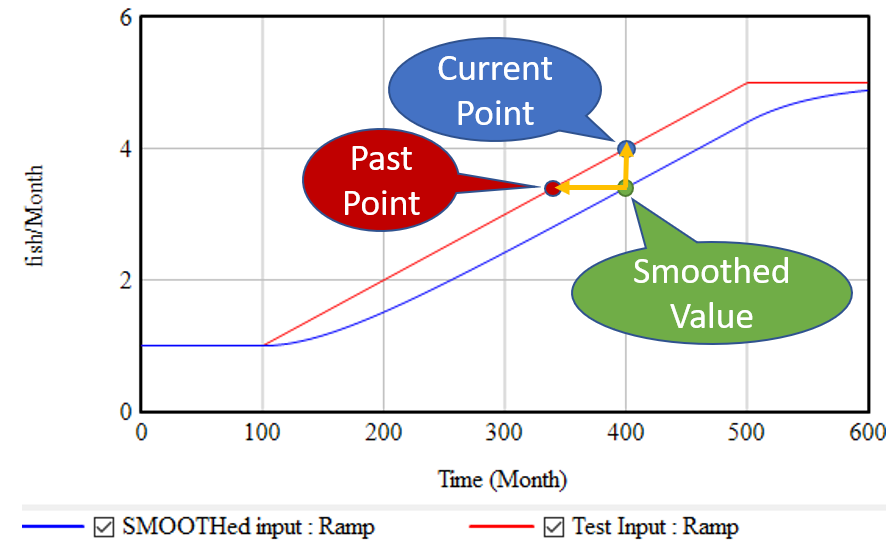
If, as above, you take a growing input (red line) and smooth it exponentially (using the SMOOTH function, or an equivalent first order goal-gap structure), you get the blue line: another ramp, that lags the input with a delay equal to the smoothing time. This means that, at month 400, we know two points: the current value of the input, and the current value of the smoothed input. But the smoothed value represents the past value of the input, in this case 60 months previous. So, we can use these two points to determine the slope of the red line:

(1) slope = (current - smoothed) / smoothing time

This is the slope in terms of input units per time. It’s often convenient to compute the fractional slope instead, expressing the growth as a fractional increase in the input per unit time:

(2) fractional slope = (current - smoothed) / smoothed / smoothing time

This is what the simple TREND functions in SD software typically report. Note that it blows up if the smoothed quantity reaches 0, while the linear method (1) does not.

If we think the growth is exponential, rather than a linear ramp, we can compute the growth rate in continuous time:

(3) fractional growth rate = LN( current / smoothed ) / smoothing time

This has pros and cons. Obviously, if a quantity is really growing exponentially, it should be measured that way. But if we’re modeling how people actually think, they may extrapolate linearly when the underlying behavior is exponential, thereby greatly underestimating future growth. Note that the very idea of forecasting exponentially assumes that the values involved are positive.

Once you know the slope of the (estimated) line, you can extrapolate it into the future via a method that corresponds with the measurement:

(1b) future value = current + slope * forecast horizon
(2b) future value = current * (1 + fractional slope * forecast horizon)
(3b) future value = current * EXP( fractional growth rate * forecast horizon )

Typical FORECAST functions use (2b).

*There’s a nice discussion of this in Appendix L of Industrial Dynamics, around figure L-3.

Refinements

The strategy above has the virtue of great simplicity: you only need to keep track of one extra stock, and the computation needed to extrapolate is minimal. It works great for continuous models. Unfortunately, it’s not very resistant to noise and discontinuities. Consider what happens if the input is not a smooth line, but a set of noisy points scattered around the line:
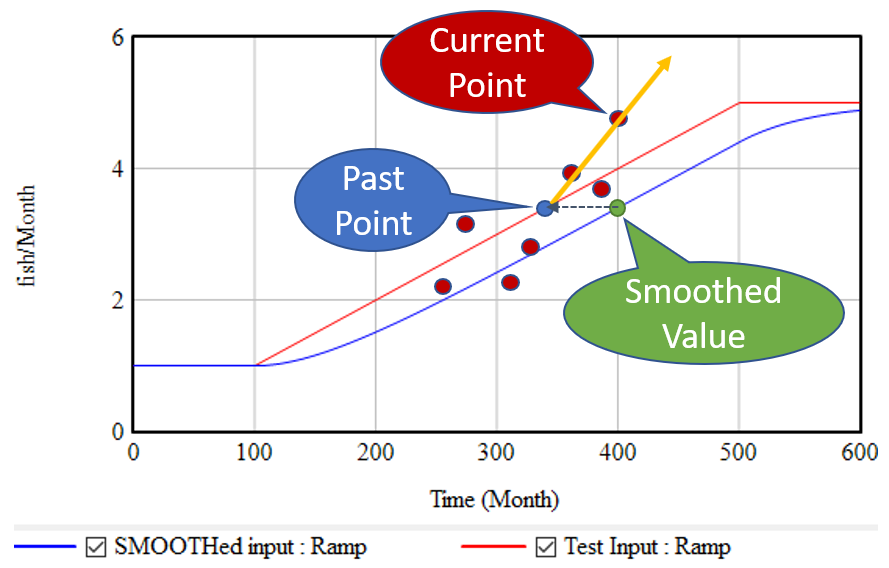
The SMOOTH function filters the data, so the past point (blue) may still be pretty close to the underlying input trend (red line). However, the extrapolation (orange line) relies only on the past point and the single current point. Any noise or discontinuity in the current point therefore can dramatically influence the slope estimate and future projections. This is not good.

Similar perverse behaviors happen if the input is a pulse or step function. For example:
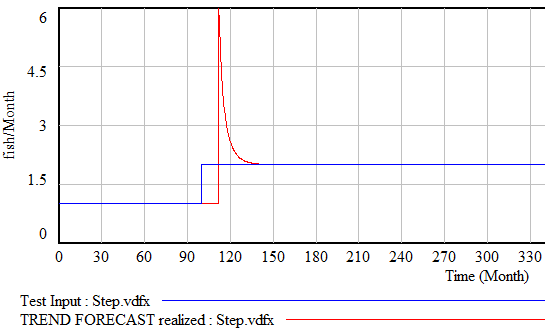
Fortunately, simple functions can be saved. In Expectation Formation in Behavioral Simulation Models, John Sterman describes an alternative third-order TREND function that improves robustness and realism. The same structure can be found in the excellent discussion of expectations in Business Dynamics, Chapter 16.
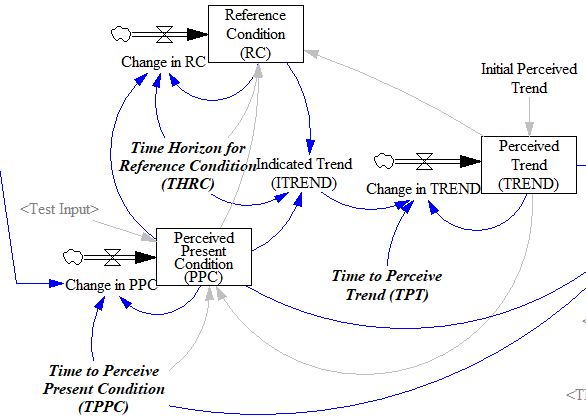
I’ll leave the details to the article, but the basic procedure is:

  • Recognize that the input is not perceived instantaneously, but only after some delay (represented by smoothing). This might capture the fact that formal accounting procedures only report results with a lag, or that you only see the price of cheese at the supermarket intermittently.
  • Track a historic point (the Reference Condition), by smoothing, as in the simpler methods.
  • Measure the Indicated Trend as the fractional slope between the Perceived Present Condition and the Reference Condition.
  • Smooth the Indicated Trend again to form the final Perceived Trend. The smoothing prevents abrupt changes in the indicated trend from causing dramatic overshoots or undershoots in the trend estimate and extrapolations that use it.

There’s an intermediate case that’s actually what I’m most likely to reach for when I need something like this: second-order smoothing. There are actually several very similar approaches (see double exponential smoothing for example) in the statistical literature. You have to be a little cautious, because these are often expressed in discrete time and therefore require a little thought to adapt to continuous time and/or unequal data intervals.

The version I use does the following:

(4) smoothed input = SMOOTH( input, smoothing time )

(5) linear trend = (input-smoothed input) / smoothing time
(6) smoothed trend = SMOOTH( linear trend, trend smoothing time )
(7) forecast = smoothed input + smoothed trend*(smoothing time + forecast horizon)

This provides most of what you want in a simple extrapolation method. It largely ignores a PULSE disturbance. Overshoot is mild when presented with a STEP input (as long as the smoothing times are long enough). It largely rejects noise, but still tracks a real RAMP accurately.

Back to regression

SD models typically avoid linear regression, for a reasons that are partly legitimate (as mentioned above). But it’s also partly cultural, as a reaction to incredibly stupid regressions that passed for models in other fields around the time of SD’s inception. We shouldn’t throw the baby out with that bathwater.

Fortunately, while most software doesn’t make linear regression particularly accessible, it turns out to be easy to implement an online regression algorithm with stocks and flows with no storage of data vectors required. The basic insight is that the regression slope (typically denoted beta) is given by:

(8) slope = covar(x,y) / var(x)

where x is time and y is the input to be forecasted. But var() and covar() are just sums of squares and cross products. If we’re OK with having exponential weighting of the regression, favoring more recent data, we can track these as moving sums (analogous to SMOOTHs). As a further simplification, as long as the smoothing window is not changing, we can compute var(x) directly from the smoothing window, so we only need to track the mean and covariance, yielding another second-order smoothing approach.

If the real decision makers inspiring your model are actually using linear regression, this may be a useful way to implement it. The implementation can be extended to equal weighting over a finite interval if needed. I find the second-order smoothing approach more intuitive, and it performs just as well, so I tend to prefer that in most cases.

Extensions

Most of what I’ve described above is linear, i.e. it assumes linear growth or decline of the quantity of interest. For a lot of things, exponential growth will be a better representation. Equations (3) and (3b) assume that, but any of the other methods can be adapted to assume exponential behavior by operating on the logarithm of the input, and then inverting that with exp(…) to form the final output.

All the models described here share one weakness: cyclical inputs.
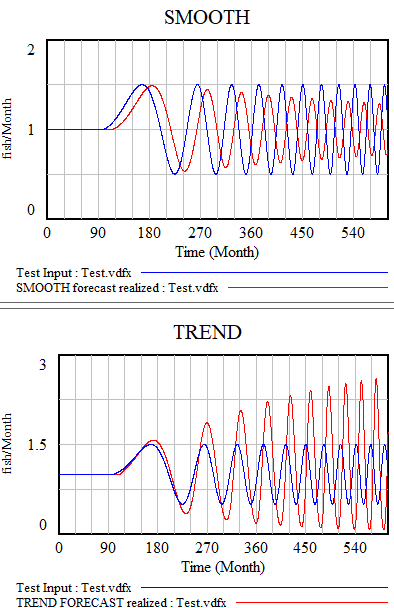
When presented with a sin wave, the simplest approach – smoothing – just bulldozes through. The higher the frequency, the less of the signal passes into the forecast. The TREND function can follow a wave if the period is longer than the smoothing time. If the dynamics are faster, it starts to miss the turning points and overshoot dramatically. The higher-order methods are better, but still not really satisfactory. The bottom line is that your projection method must use a model capable of representing the signal, and none of the methods above embodies anything about cyclical behavior.

There are lots of statistical approaches to detection of seasonality, which you can google. Many involve binning techniques, similar to those described in Appendix N of Industrial Dynamics, Self Generated Seasonal Cycles.

The model

The Vensim model, with changes (.cin) files implementing some different experiments:

trendy 4b.zip

I developed this in DSS and forgot to test PLE before uploading. If you have issues, please comment and I’ll adapt it to work.

A Ventity version is on the way.

The Beer Game

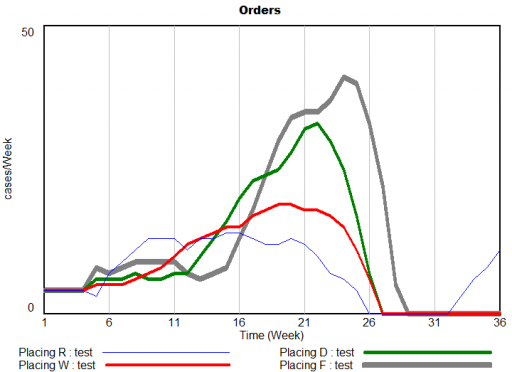
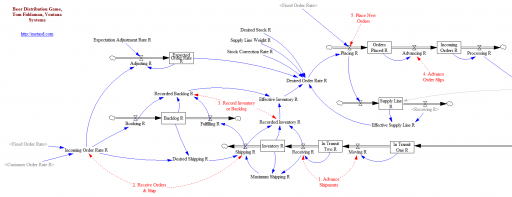
The Beer Game is the classic business game in system dynamics, demonstrating just how tricky it can be to manage a seemingly-simple system with delays and feedback. It’s a great icebreaker for teams, because it makes it immediately clear that catastrophes happen endogenously and fingerpointing is useless.

The system demonstrates amplification, aka the bullwhip effect, in supply chains. John Sterman analyzes the physical and behavioral origins of underperformance in the game in this Management Science paper. Steve Graves has some nice technical observations about similar systems in this MSOM paper.

Here are two versions that are close to the actual board game and the Sterman article:

Beer Game Fiddaman NoSubscripts.zip

This version doesn’t use arrays, and therefore should be usable in Vensim PLE. It includes a bunch of .cin files that implement the (calibrated) decision heuristics of real teams of the past, as well as some sensitivity and optimization control files.

Beer Game Fiddaman Array.zip

This version does use arrays to represent the levels of the supply chain. That makes it a little harder to grasp, but much easier to modify if you want to add or remove levels from the system or conduct optimization experiments. It requires Vensim Pro or DSS, or the Model Reader.

The Dynamics of Initiative Success

This is a new replication of a classic model, for the library. The model began in Nelson Repenning’s thesis, and was later published in Organization Science:

A Simulation-Based Approach to Understanding the Dynamics of Innovation Implementation

The history of management practice is filled with innovations that failed to live up to the promise suggested by their early success. A paradox currently facing organizational theory is that the failure of these innovations often cannot be attributed to an intrinsic lack of efficacy. To resolve this paradox, in this paper I study the process of innovation implementation. Working from existing theoretical frameworks, I synthesize a model that describes the process through which participants in an organization develop commitment to using a newly adopted innovation. I then translate that framework into a formal model and analyze it using computer simulation. The analysis suggests three new constructs—reversion, regeneration, and the motivation threshold—characterizing the dynamics of implementation. Taken together, the constructs provide an internally consistent theory of how seemingly rational decision rules can create the apparent paradox of innovations that generate early results but fail to produce sustained benefit.

An earlier version is online here.

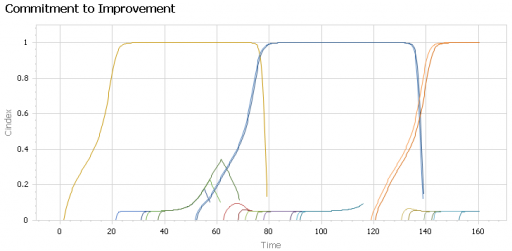
This is another nice example of tipping points. In this case, an initiative must demonstrate enough early success to grow its support base. If it succeeds, word of mouth takes its commitment level to 100%. If not, the positive feedbacks run as vicious cycles, and the initiative fails.

When initiatives compete for scarce resources, this creates a success to the successful dynamic, in which an an initiative that demonstrates early success attracts more support, grows commitment faster, and thereby demonstrates more success.

This version is in Ventity, in order to make it easier to handle multiple competing initiatives, with each as a discrete entity. One initialization dataset for the model creates initiatives at random intervals, with success contingent on the environment (other initiatives) prevailing at the time of launch:

This archive contains two versions of the model: “Intervention2” is the first in the paper, with no resource competition. “Intervention5” is the second, with multiple competing initiatives.

Innovation2+5.zip

Dynamics of the last Twinkie

When Hostess went bankrupt in 2012, there was lots of speculation about the fate of the last Twinkie, perhaps languishing on the dusty shelves of a gas station convenience store somewhere in New Mexico. Would that take ten days, ten weeks, ten years?

So, what does this have to do with system dynamics? It calls to mind the problem of modeling the inventory stockout constraint on sales. This problem dates back to Industrial Dynamics (see the variable NIR driving SSR and the discussion around figs. 15-5 and 15-7).

If there’s just one product in one inventory (i.e. one store), and visibility doesn’t matter, the constraint is pretty simple. As long as there’s one item left, sales or shipments can proceed. The constraint then is:

(1) selling = MIN(desired selling, inventory/time step)

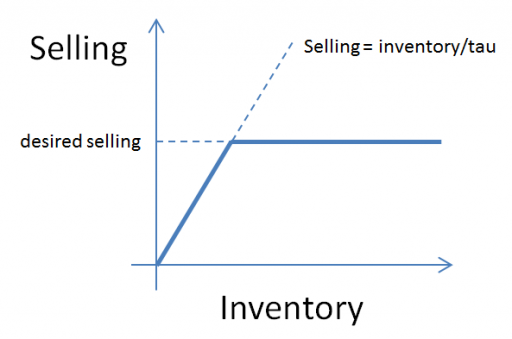
In other words, the most that can be sold in one time step is the amount of inventory that’s actually on hand. Generically, the constraint looks like this:

Here, tau is a time constant, that could be equal to time step (DT), as above, or could be generalized to some longer interval reflecting handling and other lags.

This can be further generalized to some kind of continuous function, like:

(2) selling = desired selling * f( inventory )

where f() is often a lookup table. This can be a bit tricky, because you have to ensure that f() goes to zero fast enough to obey the inventory/DT constraint above.

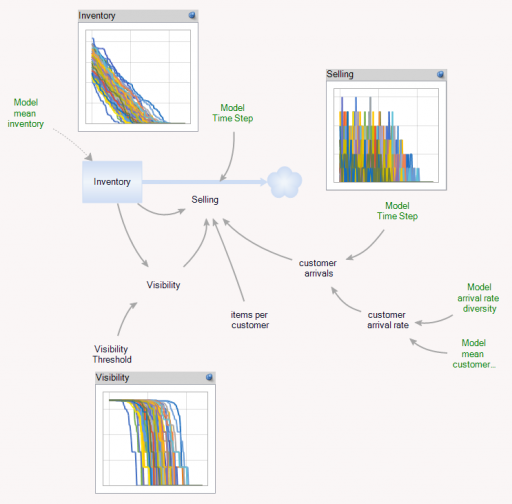
But what if you have lots of products and/or lots of inventory points, perhaps with different normal turnover rates? How does this aggregate? I built the following toy model to find out. You could easily do this in Vensim with arrays, but I found that it was ideally suited to Ventity.

Here’s the setup:

First, there’s a collection of Store entities, each with an inventory. Initial inventory is random, with a Poisson distribution, which ensures integer twinkies. Customer arrivals also have a Poisson distribution, and (optionally), the mean arrival rate varies by store. Selling is constrained to stock on hand via inventory/DT, and is also subject to a visibility effect – shelf stock influences the probability that a customer will buy a twinkie (realized with a Binomial distribution). The visibility effect saturates, so that there are diminishing returns to adding stock, as occurs when new stock goes to the back rows of the shelf, for example.

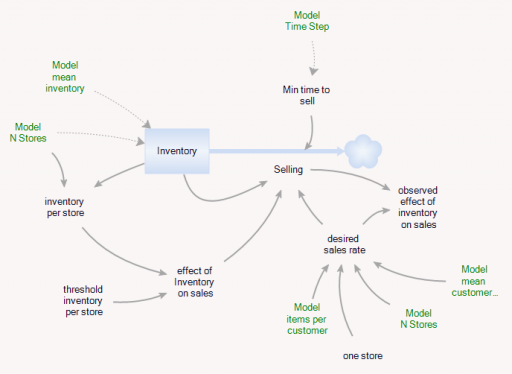
In addition, there’s an Aggregate entitytype, which is very similar to the Store, but deterministic and continuous.

The Aggregate’s initial inventory and sales rates are set to the expected values for individual stores. Two different kinds of constraints on the inventory outflow are available: inventory/tau, and f(inventory). The sales rate simplifies to:

(3) selling = min(desired sales rate*f(inventory),Inventory/Min time to sell)

(4) min time to sell >= time step

In the Store and the Aggregate, the nonlinear effect of inventory on sales (called visibility in the store) is given by

(5) f(inventory) = 1-Exp(-Inventory/Threshold)

However, the aggregate threshold might be different from the individual store threshold (and there’s no compelling reason for the aggregate f() to match the individual f(); it was just a simple way to start).

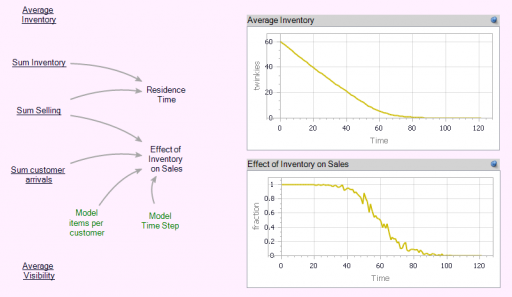
In the Store[] collection, I calculate aggregates of the individual stores, which look quite continuous, even though the population is only 100. (There are over 100,000 gas stations in the US.)

Notice that the time series behavior of the effect of inventory on sales is sigmoid.

Now we can compare individual and aggregate behavior:

Inventory

Selling

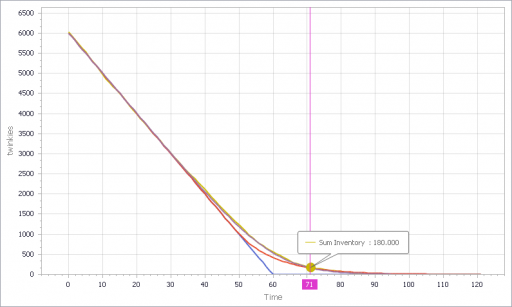
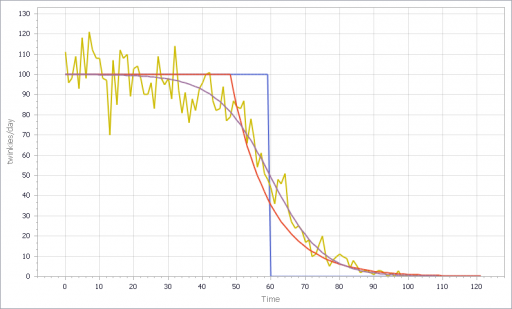
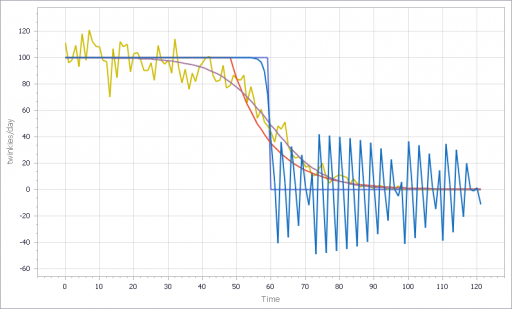
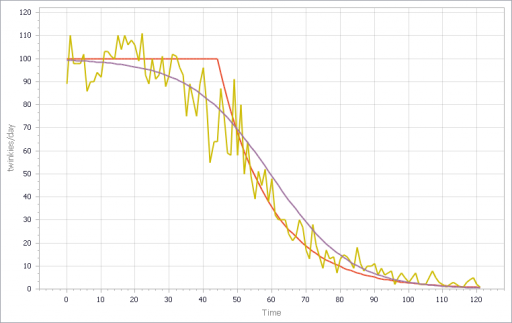
The noisy yellow line is the sum of the individual Stores. The blue line arises from imposing a hard cutoff, equation (1) above. This is like assuming that all stores are equal, and inventory doesn’t affect sales, until it’s gone. Clearly it’s not a great fit, though it might be an adequate shortcut where inventory dynamics are not really the focus of a model.

The red line also imposes an inventory/tau constraint, but the time constant (tau) is much longer than the time step, at 8 days (time step = 1 day). Finally, the purple sigmoid line arises from imposing the nonlinear f(inventory) constraint. It’s quite a good fit, but the threshold for the aggregate must be about twice as big as for the individual Stores.

However, if you parameterize f() poorly, and omit the inventory/tau constraint, you get what appear to be chaotic oscillations – cool, but obviously unphysical:

If, in addition, you add diversity in Store’s customer arrival rates, you get a longer tail on inventory. That last Twinkie is likely to be in a low-traffic outlet. This makes it a little tougher to fit all parts of the curve:

I think there are some interesting questions here, that would make a great paper for the SD conference:

  • (Under what conditions) can you derive the functional form of the aggregate constraint from the properties of the individual Stores?
  • When do the deficiencies of shortcut approaches, that may lack smooth derivatives, matter in aggregate models like Industrial dynamics?
  • What are the practical implications for marketing models?
  • What can you infer about inventory levels from aggregate data alone?
  • Is that really chaos?

Have at it!

The Ventity model: LastTwinkie1.zip

Job tenure dynamics

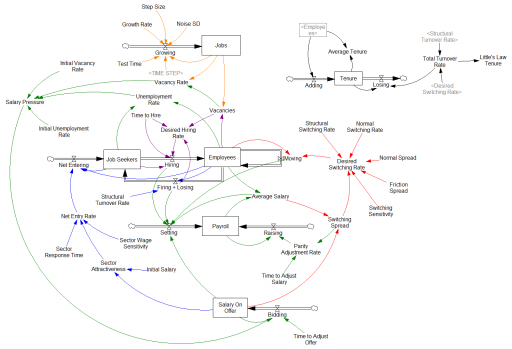
This is a simple model of the dynamics of employment in a sector. I built it for a LinkedIn article that describes the situation and the data.

The model is interesting and reasonably robust, but it has (at least) three issues you should know about:

  • The initialization in equilibrium isn’t quite perfect.
  • The sector-entry decision (Net Entering) is not robust to low unemployment. In some situations, a negative net entering flow could cause negative Job Seekers.
  • The sector-entry decision also formulates attractiveness exclusively as a function of salaries; in fact, it should also account for job availability (perceived vacancy and unemployment rates).

Correcting these shortcomings shouldn’t be too hard, and it should make the model’s oscillatory tendencies more realistic. I leave this as an exercise for you. Drop me a note if you have an improved version.

The model requires Vensim (any version, including free PLE).

Download employees1.mdl

Social network valuation with logistic models

This is a logistic growth model for Facebook’s user base, with a very simple financial projection attached. It’s inspired by:

Quis pendit ipsa pretia: facebook valuation and diagnostic of a bubble based on nonlinear demographic dynamics

Peter Cauwels, Didier Sornette

We present a novel methodology to determine the fundamental value of firms in the social-networking sector based on two ingredients: (i) revenues and profits are inherently linked to its user basis through a direct channel that has no equivalent in other sectors; (ii) the growth of the number of users can be calibrated with standard logistic growth models and allows for reliable extrapolations of the size of the business at long time horizons. We illustrate the methodology with a detailed analysis of facebook, one of the biggest of the social-media giants. There is a clear signature of a change of regime that occurred in 2010 on the growth of the number of users, from a pure exponential behavior (a paradigm for unlimited growth) to a logistic function with asymptotic plateau (a paradigm for growth in competition). We consider three different scenarios, a base case, a high growth and an extreme growth scenario. Using a discount factor of 5%, a profit margin of 29% and 3.5 USD of revenues per user per year yields a value of facebook of 15.3 billion USD in the base case scenario, 20.2 billion USD in the high growth scenario and 32.9 billion USD in the extreme growth scenario. According to our methodology, this would imply that facebook would need to increase its profit per user before the IPO by a factor of 3 to 6 in the base case scenario, 2.5 to 5 in the high growth scenario and 1.5 to 3 in the extreme growth scenario in order to meet the current, widespread, high expectations. …

(via the arXiv blog)

This is not an exact replication of the model (though you can plug in the parameters from C&S’ paper to replicate their results). I used slightly different estimation methods, a generalization of the logistic (for saturation exponent <> 1), and variable revenues and interest rates in the projections (also optional).

This is a good illustration of how calibration payoffs work. The payoff in this model is actually a policy payoff, because the weighted sum-squared-error is calculated explicitly in the model. That makes it possible to generate Monte Carlo samples and filter them by SSE, and also makes it easier to estimate the scale and variation in the standard error of user base reports.

The model is connected to input data in a spreadsheet. Most is drawn from the paper, but I updated users and revenues with the latest estimates I could find.

A command script replicates optimization runs that fit the model to data for various values of the user carrying capacity K.

Note that there are two views, one for users, and one for financial projections.

See my accompanying blog post for some reflections on the outcome.

This model requires Vensim DSS, Pro, or the Model Reader. facebook 3.vpm or facebook3.zip (The .zip is probably easier if you have DSS or Pro and want to work with the supplementary control files.)

Update: I’ve added another set of models for Groupon: groupon 1.vpmgroupon 2.vpm and groupon.zip groupon3.zip

See my latest blog post for details.


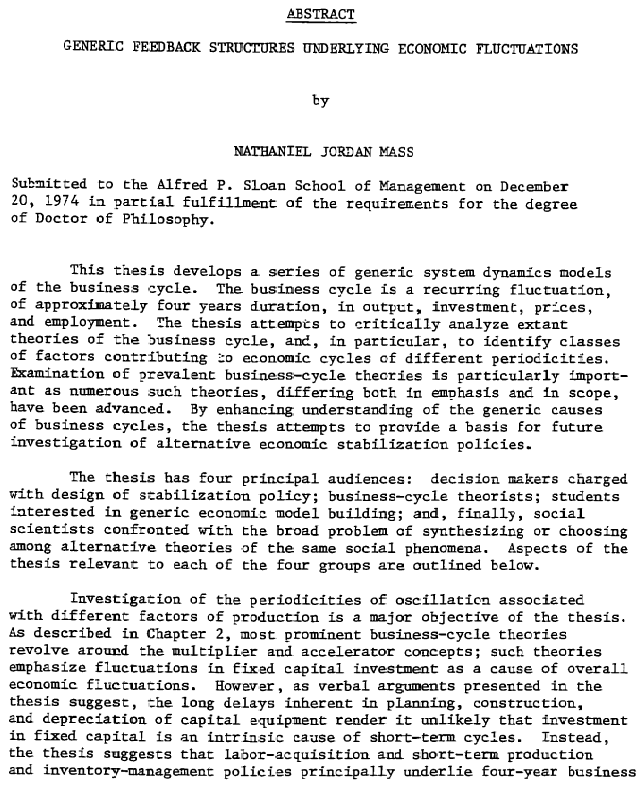
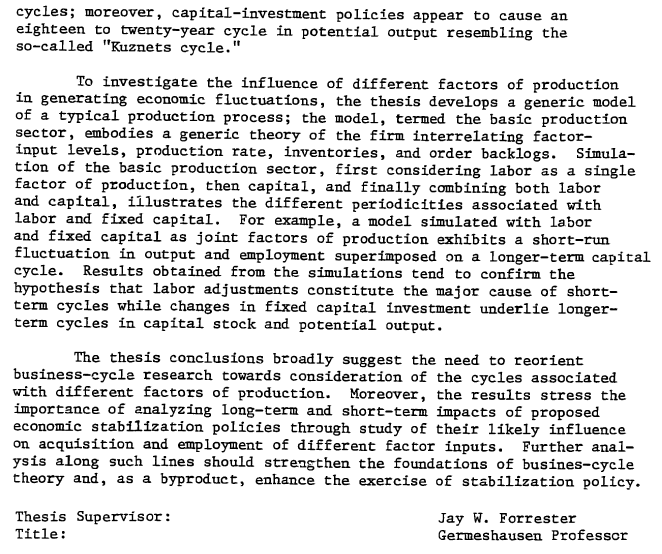
Economic Cycles: Underlying Causes

Nathaniel Mass’ model of economic cycles, replicated from his 1975 book, Economic Cycles: An Analysis of Underlying Causes, which unfortunately seems to have disappeared from the Productivity Press site (though you can still find used copies).

I haven’t checked, but I’m guessing that the model is quite similar to that in his PhD thesis, which you can get from MIT libraries here. Here’s the abstract:


The models: mass2.mdl mass2.vpm

These don’t have units defined, unfortunately – I’d love to have a copy with units if you’re so inclined.

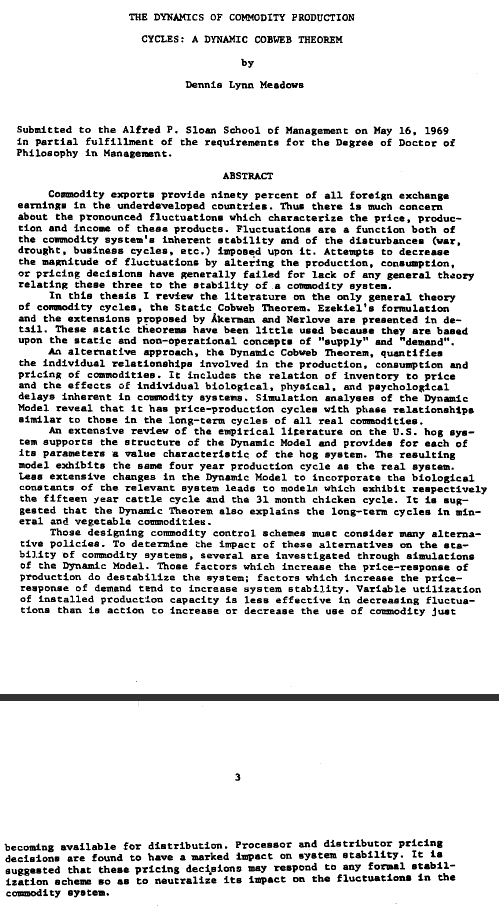
The Dynamics of Commodity Production Cycles

These classic models are from Dennis Meadows’ dissertation, the Dynamics of Commodity Production Cycles:

While times have changed, the dynamics described by these models are still widespread.

These versions should work in all recent Vensim versions:

DLMhogs2.vpm DLMhogs2.mdl

DLMgeneric2.vpm DLMgeneric2.mdl


A System Zoo

I just picked up a copy of Hartmut Bossel’s excellent System Zoo 1, which I’d seen years ago in German, but only recently discovered in English. This is the first of a series of books on modeling – it covers simple systems (integration, exponential growth and decay), logistic growth and variants, oscillations and chaos, and some interesting engineering systems (heat flow, gliders searching for thermals). These are high quality models, with units that balance, well-documented by the book. Every one I’ve tried runs in Vensim PLE so they’re great for teaching.

I haven’t had a chance to work my way through the System Zoo 2 (natural systems – climate, ecosystems, resources) and System Zoo 3 (economy, society, development), but I’m pretty confident that they’re equally interesting.

You can get the models for all three books, in English, from the Uni Kassel Center for Environmental Systems Research – it’s now easy to find a .zip archive of the zoo models for the whole series, in Vensim .mdl format, on CESR’s home page: www2.cesr.de/downloads.

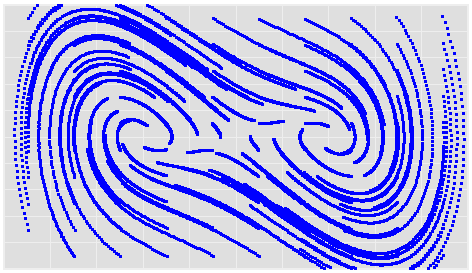
To tantalize you, here are some images of model output from Zoo 1. First, a phase map of a bistable oscillator, which was so interesting that I built one with my kids, using legos and neodymium magnets:

Continue reading “A System Zoo”

The Rise and Fall of the Saturday Evening Post

Replicated by David Sirkin and Julio Gomez from Hall, R. I. 1976. A system pathology of an organization: The rise and fall of the old Saturday Evening Post. Administrative Science Quarterly 21(2): 185-211. (JSTOR link). Just updated for newer Vensim versions.

This is one of the classic models on the Desert Island Dynamics list.

There are some units issues, preserved from the original by David and Julio. As I update it, I also wonder if there are some inconsistencies in the accounting for the subscription pipeline. Please report back here if you find anything interesting.

satevepost2011b.mdl

satevepost2011b.vmf