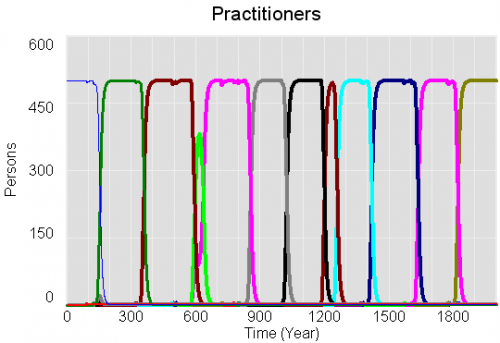
Polya urn with increasing returns

This set of models performs a variant of a Polya urn experiment, along the lines of that described in Bryan Arthur’s Increasing Returns and Path Dependence in the Economy, Chapter 10. There’s a small difference, which is that samples are drawn with replacement (Bernoulli distribution) rather than without (hypergeometric distribution).

The interesting dynamics arise from competing positive feedback loops through the stocks of red and white balls. There’s useful related reading at http://tuvalu.santafe.edu/~wbarthur/Papers/Papers.html

I did the physical version of this experiment with Legos with my kids:

I tried the Polya urns experiment over lunch. We put 5 red and 5 white legos in a bowl, then took turns drawing a sample of 5. We returned the sample to the bowl, plus one lego of whichever color dominated the sample. Iterate. At the start, and after 2 or 3 rounds, I solicited guesses about what would happen. Gratifyingly, the consensus was that the bowl would remain roughly evenly divided between red and white. After a few more rounds, the reality began to diverge, and we stopped when white had a solid 2:1 advantage. I wondered aloud whether using a larger or smaller sample would lead to faster convergence. With no consensus about the answer, we tried it – drawing samples of just 1 lego. I think the experimental outcome was somewhat inconclusive – we quickly reached dominance of red, but the sampling process was much faster, so it may have actually taken more rounds to achieve that. There’s a lot of variation possible in the outcome, which means that superstitious learning is a possible trap.

This model automates the experiment, which makes it easier and more reliable to explore questions like the sensitivity of the rate of divergence to the sample size.

PolyaUrn.vpm

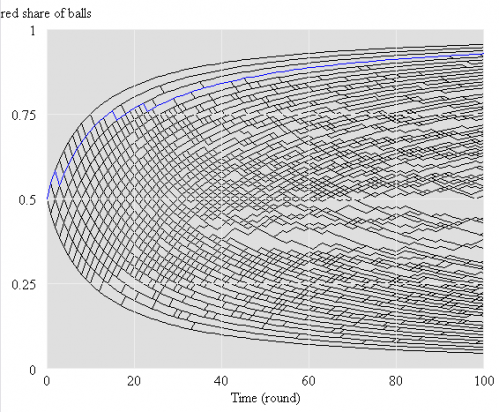
This version works with Vensim PLE (though it’s not supposed to, because it uses the RANDOM BERNOULLI function). It performs a single experiment per run, but includes sensitivity control files for performing hundreds of runs at a time (requires PLE Plus). That makes for a nice map of outcomes:

Continue reading “Polya urn with increasing returns”

A System Zoo

I just picked up a copy of Hartmut Bossel’s excellent System Zoo 1, which I’d seen years ago in German, but only recently discovered in English. This is the first of a series of books on modeling – it covers simple systems (integration, exponential growth and decay), logistic growth and variants, oscillations and chaos, and some interesting engineering systems (heat flow, gliders searching for thermals). These are high quality models, with units that balance, well-documented by the book. Every one I’ve tried runs in Vensim PLE so they’re great for teaching.

I haven’t had a chance to work my way through the System Zoo 2 (natural systems – climate, ecosystems, resources) and System Zoo 3 (economy, society, development), but I’m pretty confident that they’re equally interesting.

You can get the models for all three books, in English, from the Uni Kassel Center for Environmental Systems Research – it’s now easy to find a .zip archive of the zoo models for the whole series, in Vensim .mdl format, on CESR’s home page: www2.cesr.de/downloads.

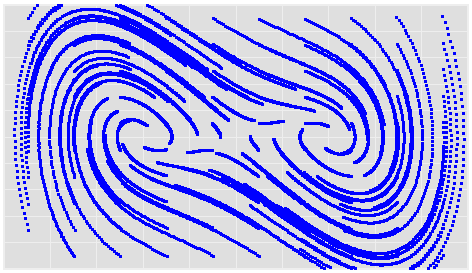
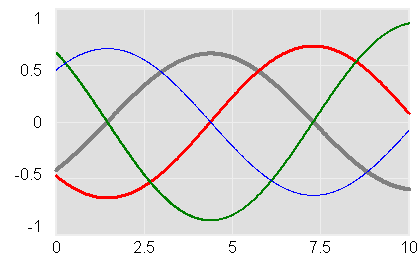
To tantalize you, here are some images of model output from Zoo 1. First, a phase map of a bistable oscillator, which was so interesting that I built one with my kids, using legos and neodymium magnets:

Continue reading “A System Zoo”

Delay Sandbox

There’s a handy rule of thumb for estimating how much of the input to a first order delay has propagated through as output: after three time constants, 95%. (This is the same as the rule for estimating how much material has left a stock that is decaying exponentially – about a 2/3 after one lifetime, 85% after two, 95% after three, and 99% after five lifetimes.)

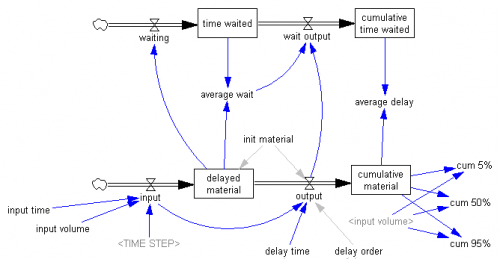
I recently wanted rules of thumb for other delay structures (third order or higher), so I built myself a simple model to facilitate playing with delays. It uses Vensim’s DELAY N function, to make it easy to change the delay order.

Here’s the structure:

Continue reading “Delay Sandbox”

The Rise and Fall of the Saturday Evening Post

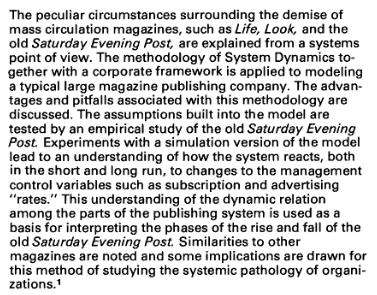
Replicated by David Sirkin and Julio Gomez from Hall, R. I. 1976. A system pathology of an organization: The rise and fall of the old Saturday Evening Post. Administrative Science Quarterly 21(2): 185-211. (JSTOR link). Just updated for newer Vensim versions.

This is one of the classic models on the Desert Island Dynamics list.

There are some units issues, preserved from the original by David and Julio. As I update it, I also wonder if there are some inconsistencies in the accounting for the subscription pipeline. Please report back here if you find anything interesting.

satevepost2011b.mdl

satevepost2011b.vmf

Boiling Water Reactor Dynamics

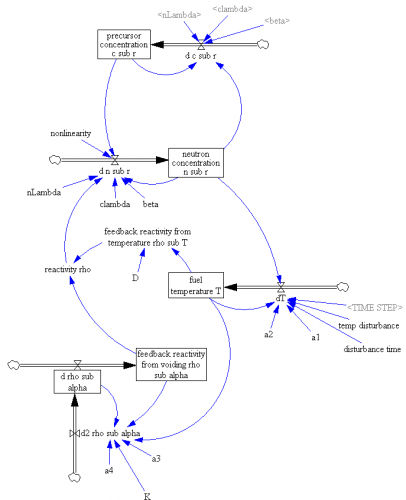
Replicated from “Hybrid Simulation of Boiling Water Reactor Dynamics Using A University Research Reactor” by James A. Turso, Robert M. Edwards, Jose March-Leuba, Nuclear Technology vol. 110, Apr. 1995.

This is a simple 5th-order representation of the operation of a boiling water reactor around its normal operating point, which is subject to interesting limit cycle dynamics.

The original article documents the model well, with the exception of the bifurcation parameter K and a nonlinear term, for which I’ve identified plausible values by experiment.

TursoNuke1.mdl

Fibonacci Rabbits

This is a small, discrete time model that explores the physical interpretation of the Fibonacci sequence. See my blog post about this model for details.

Fibonacci2.vpm This runs with Vensim PLE, but users might want to use the Model Reader in order to load the included .cin file with non-growing eigenvector settings.

Market Growth

John Morecroft’s implementation of Jay Forrester’s Market Growth model, replicated by an MIT colleague whose name is lost to the mists of time, from:

Morecroft, J. D. W. (1983). System Dynamics: Portraying Bounded Rationality. Omega, 11(2), 131-142.

This paper examines the linkages between system dynamics and the Carnegie school in their treatment of human decision making. It is argued that the structure of system dynamics models implicitly assumes bounded rationality in decision making and that recognition of this assumption would aid system dynamicists in model construction and in communication to other social science disciplines. The paper begins by examining Simon’s “Principle of Bounded Rationality” which draws attention to the cognitive limitations on the information gathering and processing powers of human decision makers. Forrester’s “Market Growth Model” is used to illustrate the central theme that system dynamics models are portrayals of bounded rationality. Close examination of the model formulation reveals decision functions involving simple rules of thumb and limited information content. …

Continue reading “Market Growth”

Oscillation from a purely positive loop

Replicated by Mohammad Mojtahedzadeh from Alan Graham’s thesis, or created anew with the same inspiration. He created these models in the course of his thesis work on structural analysis through pathway participation matrices.

Alan Graham, 1977. Principles on the Relationship Between Structure and Behavior of Dynamic Systems. MIT Thesis. Page 76+

These models are pure positive feedback loops that don’t exhibit exponential growth (under the right initial conditions). See my blog post for a discussion of the details.

These are generic models, and therefore don’t have units. All should run with Vensim PLE, except the generic gain matrix version which uses arrays and therefore requires an advanced version or the Model Reader.

The original 4th order model, replicated from Alan’s thesis: PurePosOscill4.vpm – note that this includes a .cin file with an alternate stable initialization.

My slightly modified version, permitting initialization with different gains at each level: PurePosOscill4alt.vpm

Loops of different orders: 3.vpm 6.vpm 8.vpm 12.vpm (I haven’t spent much time with these. It appears that the high-order versions transition to growth rather quickly – my guess is that this is an artifact of numerical precision, i.e. any tiny imprecision in the initialization introduces a bit of the growth eigenvector, which quickly swamps the oscillatory signal. It would be interesting to try these in double precision Vensim to see if I’m right.)

Stable initializations: 2stab.vpm 12stab.vpm

A generic version, representing a system as a generic gain matrix, so you can use it to explore any linear unforced variant: Generic.vpm

Bifurcating Salmon

A nifty paper on nonlinear dynamics of salmon populations caught my eye on ArXiv.org today. The math is straightforward and elegant, so I replicated the model in Vensim.

A three-species model explaining cyclic dominance of pacific salmon

Authors: Christian Guill, Barbara Drossel, Wolfram Just, Eddy Carmack

Abstract: The four-year oscillations of the number of spawning sockeye salmon (Oncorhynchus nerka) that return to their native stream within the Fraser River basin in Canada are a striking example of population oscillations. The period of the oscillation corresponds to the dominant generation time of these fish. Various – not fully convincing – explanations for these oscillations have been proposed, including stochastic influences, depensatory fishing, or genetic effects. Here, we show that the oscillations can be explained as a stable dynamical attractor of the population dynamics, resulting from a strong resonance near a Neimark Sacker bifurcation. This explains not only the long-term persistence of these oscillations, but also reproduces correctly the empirical sequence of salmon abundance within one period of the oscillations. Furthermore, it explains the observation that these oscillations occur only in sockeye stocks originating from large oligotrophic lakes, and that they are usually not observed in salmon species that have a longer generation time.

The paper does a nice job of connecting behavior to structure, and of relating the emergence of oscillations to eigenvalues in the linearized system.

Units balance, though I had to add a couple implicit scale factors to do so.

The general results are qualitatitively replicable. I haven’t tried to precisely reproduce the authors’ bifurcation diagram and other experiments, in part because I couldn’t find a precise specification of numerical methods used (time step, integration method), so I wouldn’t expect to succeed.

Unlike most SD models, this is a hybrid discrete-continuous system. Salmon, predator and zooplankton populations evolve continuously during a growing season, but with discrete transitions between seasons.

The model uses SAMPLE IF TRUE, so you need an advanced version of Vensim to run it, or the free Model Reader. (It should be possible to replace the SAMPLE IF TRUE if an enterprising person wanted a PLE version). It would also be a good candidate for an application of SHIFT IF TRUE if someone wanted to experiment with the cohort age structure.

sockeye.vmf

For a more policy-oriented take on salmon, check out Andy Ford’s work on smolt migration.

Urban Dynamics

This is an updated version of Urban Dynamics, the classic by Forrester et al.

John Richardson upgraded the diagrams and cleaned up a few variable names that had typos.

I added some units equivalents and fixed a few variables in order to resolve existing errors. The model is now free of units errors, except for 7 warnings about use of dimensioned inputs to lookups (not uncommon practice, but it would be good to normalize these to suppress the warnings and make the model parameterization more flexible). There are also some runtime warnings about lookup bounds that I have not investigated (take a look – there could be a good paper lurking here).

Behavior is identical to that of the original from the standard Vensim distribution.

Urban Dynamics 2010-06-14.vpm

Urban Dynamics 2010-06-14.mdl

Urban Dynamics 2010-06-14.vmf