Category: News
The envelope please…
The 2011 Ig Nobel in Mathematics is for modeling … it goes to predictors of the end of the world:
Dorothy Martin of the USA (who predicted the world would end in 1954), Pat Robertson of the USA (who predicted the world would end in 1982), Elizabeth Clare Prophet of the USA (who predicted the world would end in 1990), Lee Jang Rim of KOREA (who predicted the world would end in 1992), Credonia Mwerinde of UGANDA (who predicted the world would end in 1999), and Harold Camping of the USA (who predicted the world would end on September 6, 1994 and later predicted that the world will end on October 21, 2011), for teaching the world to be careful when making mathematical assumptions and calculations.
Notice that the authors of Limits to Growth aren’t here, not because they were snubbed, but because Limits didn’t actually predict the end of the world. Update: perhaps the Onion should be added to the list though.
The Medicine prize goes to a pair of behavior & decision making studies:
Mirjam Tuk (of THE NETHERLANDS and the UK), Debra Trampe (of THE NETHERLANDS) and Luk Warlop (of BELGIUM). and jointly to Matthew Lewis, Peter Snyder and Robert Feldman (of the USA), Robert Pietrzak, David Darby, and Paul Maruff (of AUSTRALIA) for demonstrating that people make better decisions about some kinds of things — but worse decisions about other kinds of things‚ when they have a strong urge to urinate. REFERENCE: “Inhibitory Spillover: Increased Urination Urgency Facilitates Impulse Control in Unrelated Domains,” Mirjam A. Tuk, Debra Trampe and Luk Warlop, Psychological Science, vol. 22, no. 5, May 2011, pp. 627-633.
REFERENCE: “The Effect of Acute Increase in Urge to Void on Cognitive Function in Healthy Adults,” Matthew S. Lewis, Peter J. Snyder, Robert H. Pietrzak, David Darby, Robert A. Feldman, Paul T. Maruff, Neurology and Urodynamics, vol. 30, no. 1, January 2011, pp. 183-7.
ATTENDING THE CEREMONY: Mirjam Tuk, Luk Warlop, Peter Snyder, Robert Feldman, David Darb
Perhaps we need more (or is it less?) restrooms in the financial sector and Washington DC these days.
Energy unprincipled
I’ve been browsing the ALEC model legislation on ALECexposed, some of which infiltrated the Montana legislature. It’s discouragingly predictable stuff, but not without a bit of amusement. Take the ALEC Energy Principles:
Mission: To define a comprehensive strategy for energy security, production, and distribution in the states consistent with the Jeffersonian principles of free markets and federalism.
Except when authoritarian government is needed to stuff big infrastructure projects down the throats of unwilling private property owners:
Reliable electricity supply depends upon significant improvement of the transmission grid. Interstate and intrastate transmission siting authority and procedures must be addressed to facilitate the construction of needed new infrastructure.
Like free markets, federalism apparently has its limits:
Such plan shall only be approved by the commission if the expense of implementing such a plan is borne by the federal government.
The overconfidence of nuclear engineers
Rumors that the Fort Calhoun nuclear power station is subject to a media blackout appear to be overblown, given that the NRC is blogging the situation.
Apparently floodwaters at the plant were at 1006 feet ASL yesterday, which is a fair margin from the 1014 foot design standard for the plant. That margin might have been a lot less, if the NRC hadn’t cited the plant for design violations last year, which it estimated would lead to certain core damage at 1010 feet.
Still, engineers say things like this:
“We have much more safety measures in place than we actually need right now,” Jones continued. “Even if the water level did rise to 1014 feet above mean sea level, the plant is designed to handle that much water and beyond. We have additional steps we can take if we need them, but we don’t think we will. We feel we’re in good shape.” – suite101
Wedge furor
Socolow is quoted in Nat Geo as claiming the stabilization wedges were a mistake,
“With some help from wedges, the world decided that dealing with global warming wasn’t impossible, so it must be easy,” Socolow says. “There was a whole lot of simplification, that this is no big deal.”
Pielke quotes & gloats:
Socolow’s strong rebuke of the misuse of his work is a welcome contribution and, perhaps optimistically, marks a positive step forward in the climate debate.
Romm refutes,
I spoke to Socolow today at length, and he stands behind every word of that — including the carefully-worded title. Indeed, if Socolow were king, he told me, he’d start deploying some 8 wedges immediately. A wedge is a strategy and/or technology that over a period of a few decades ultimately reduces projected global carbon emissions by one billion metric tons per year (see Princeton website here). Socolow told me we “need a rising CO2 price” that gets to a serious level in 10 years. What is serious? “$50 to $100 a ton of CO2.”
Revkin weighs in with a broader view, but the tone is a bit Pielkeish,
From the get-go, I worried about the gushy nature of the word “solving,” particularly given that there was then, and remains, no way to solve the climate problem by 2050.
David Roberts wonders what the heck Socolow is thinking.
Who’s right? I think it’s best in Socolow’s own words (posted by Revkin):
1. Look closely at what is in quotes, which generally comes from my slides, and what is not in quotes. What is not in quotes is just enough “off” in several places to result in my messages being misconstrued. I have given a similar talk about ten times, starting in December 2010, and this is the first time that I am aware of that anyone in the audience so misunderstood me. I see three places where what is being attributed to me is “off.”
a. “It was a mistake, he now says.” Steve Pacala’s and my wedges paper was not a mistake. It made a useful contribution to the conversation of the day. Recall that we wrote it at a time when the dominant message from the Bush Administration was that there were no available tools to deal adequately with climate change. I have repeated maybe a thousand times what I heard Spencer Abraham, Secretary of Energy, say to a large audience in Alexandria. Virginia, early in 2004. Paraphrasing, “it will take a discovery akin to the discovery of electricity” to deal with climate change. Our paper said we had the tools to get started, indeed the tools to “solve the climate problem for the next 50 years,” which our paper defined as achieving emissions 50 years from now no greater than today. I felt then and feel now that this is the right target for a world effort. I don’t disown any aspect of the wedges paper.
b. “The wedges paper made people relax.” I do not recognize this thought. My point is that the wedges people made some people conclude, not surprisingly, that if we could achieve X, we could surely achieve more than X. Specifically, in language developed after our paper, the path we laid out (constant emissions for 50 years, emissions at stabilization levels after a second 50 years) was associated with “3 degrees,” and there was broad commitment to “2 degrees,” which was identified with an emissions rate of only half the current one in 50 years. In language that may be excessively colorful, I called this being “outflanked.” But no one that I know of became relaxed when they absorbed the wedges message.
c. “Well-?intentioned groups misused the wedges theory.” I don’t recognize this thought. I myself contributed the Figure that accompanied Bill McKibben’s article in National Geographic that showed 12 wedges (seven wedges had grown to eight to keep emissions level, because of emissions growth post-?2006 and the final four wedges drove emissions to half their current levels), to enlist the wedges image on behalf of a discussion of a two-?degree future. I am not aware of anyone misusing the theory.
2. I did say “The job went from impossible to easy.” I said (on the same slide) that “psychologists are not surprised,” invoking cognitive dissonance. All of us are more comfortable with believing that any given job is impossible or easy than hard. I then go on to say that the job is hard. I think almost everyone knows that. Every wedge was and is a monumental undertaking. The political discourse tends not to go there.
3. I did say that there was and still is a widely held belief that the entire job of dealing with climate change over the next 50 years can be accomplished with energy efficiency and renewables. I don’t share this belief. The fossil fuel industries are formidable competitors. One of the points of Steve’s and my wedges paper was that we would need contributions from many of the available option. Our paper was a call for dialog among antagonists. We specifically identified CO2 capture and storage as a central element in climate strategy, in large part because it represents a way of aligning the interests of the fossil fuel industries with the objective of climate change.
…
It is distressing to see so much animus among people who have common goals. The message of Steve’s and my wedges paper was, above all, ecumenical.
My take? It’s rather pointless to argue the merits of 7 or 14 or 25 wedges. We don’t really know the answer in any detail. Do a little, learn, do some more. Socolow’s $50 to $100 a ton would be a good start.
three
a. “It
It
time
available
thousand
audience
akin
the
tools
to
get
started,
indeed
the
tools
to
“solve
the
climate
problem
for
the
next
50
years,”
than
disown
any
aspect
of
the
wedges
paper.
b. “The
wedges
paper
made
people
relax.”
I
do
not
recognize
this
thought.
My
point
is
that
the
wedges
people
made
some
people
conclude,
not
surprisingly,
that
if
we
could
achieve
after
our
paper,
the
path
we
laid
out
(constant
emissions
for
50
years,
emissions
at
stabilization
was
only
half
the
current
one
in
50
years.
In
language
that
may
be
excessively
colorful,
I
called
this
being
“outflanked.”
But
no
one
that
I
know
of
became
relaxed
when
they
absorbed
the
wedges
message.
c.
“Well-?intentioned
myself
contributed
the
Figure
that
accompanied
Bill
McKibben’s
article
in
National
Geographic
emissions
emissions
discussion
A walk through the Ryan budget proposal
Since the budget deal was announced, I’ve been wondering what was in it. It’s hard to imagine that it really works like this:
“This is an agreement to invest in our country’s future while making the largest annual spending cut in our history,” Obama said.
However, it seems that there isn’t really much substance to the deal yet, so I thought I’d better look instead at one target: the Ryan budget roadmap. The CBO recently analyzed it, and put the $ conveniently in a spreadsheet.
Like most spreadsheets, this is very good at presenting the numbers, and lousy at revealing causality. The projections are basically open-loop, but they run to 2084. There’s actually some justification for open-loop budget projections, because many policies are open loop. The big health and social security programs, for example, are driven by demographics, cutoff ages and inflation adjustment formulae. The demographics and cutoff ages are predictable. It’s harder to fathom the possible divergence between inflation adjustments and broad inflation (which affects the health sector share) and future GDP growth. So, over long horizons, it’s a bit bonkers to look at the system without considering feedback, or at least uncertainty in the future trajectory of some key drivers.
There’s also a confounding annoyance in the presentation, with budgets and debt as percentages of GDP. Here’s revenue and “other” expenditures (everything but social security, health and interest):
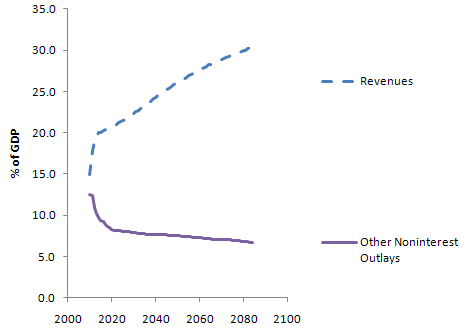 There’s a huge transient in each, due to the current financial mess. (Actually this behavior is to some extent deliberately Keynesian – the loss of revenue in a recession is amplified over the contraction of GDP, because people fall into lower tax brackets and profits are more volatile than gross activity. Increased borrowing automatically takes up the slack, maintaining more stable spending.) The transient makes it tough to sort out what’s real change, and what is merely the shifting sands of the GDP denominator. This graph also points out another irritation: there’s no history. Is this plausible, or unprecedented behavior?
The Ryan team actually points out some of the same problems with budgets and their analyses:
One reason the Federal Government’s major entitlement programs are difficult to control is that they are designed that way. A second is that current congressional budgeting provides no means of identifying the long-term effects of near-term program expansions. A third is that these programs are not subject to regular review, as annually appropriated discretionary programs are; and as a result, Congress rarely evaluates the costs and effectiveness of entitlements except when it is proposing to enlarge them. Nothing can substitute for sound and prudent policy choices. But an improved budget process, with enforceable limits on total spending, would surely be a step forward. This proposal calls for such a reform.
Unfortunately the proposed reforms don’t seem to change anything about the process for analyzing the budget or designing programs. We need transparent models with at least a little bit of feedback in them, and programs that are robust because they’re designed with that little bit of feedback in mind.
Setting aside these gripes, here’s what I can glean from the spreadsheet.
The Ryan proposal basically flatlines revenue at 19% of GDP, then squashes programs to fit. By contrast, the CBO Extended Baseline scenario expands programs per current rules and then raises revenue to match (very roughly – the Ryan proposal actually winds up with slightly more public debt 20 years from now).
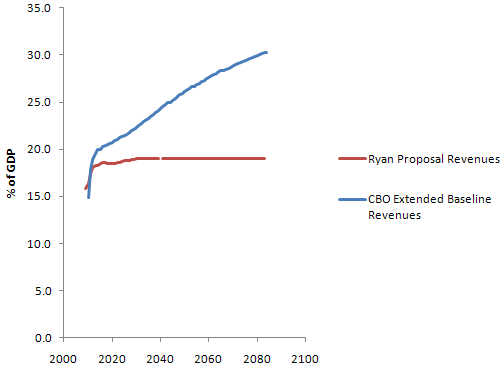 It’s not clear how the 19% revenue level arises; the CBO used a trajectory from Ryan’s staff, not its own analysis. Ryan’s proposal says:
- Provides individual income tax payers a choice of how to pay their taxes – through existing law, or through a highly simplified code that fits on a postcard with just two rates and virtually no special tax deductions, credits, or exclusions (except the health care tax credit).
- Simplifies tax rates to 10 percent on income up to $100,000 for joint filers, and $50,000 for single filers; and 25 percent on taxable income above these amounts. Also includes a generous standard deduction and personal exemption (totaling $39,000 for a family of four).
- Eliminates the alternative minimum tax [AMT].
- Promotes saving by eliminating taxes on interest, capital gains, and dividends; also eliminates the death tax.
- Replaces the corporate income tax – currently the second highest in the industrialized world – with a border-adjustable business consumption tax of 8.5 percent. This new rate is roughly half that of the rest of the industrialized world.
It’s not clear that there’s any analysis to back up the effects of this proposal. Certainly it’s an extremely regressive shift. Real estate fans will flip when they find out that the mortgage interest deduction is gone (actually a good idea, I think).
On the outlay side, here’s the picture (CBO in solid lines; Ryan proposal with dashes):
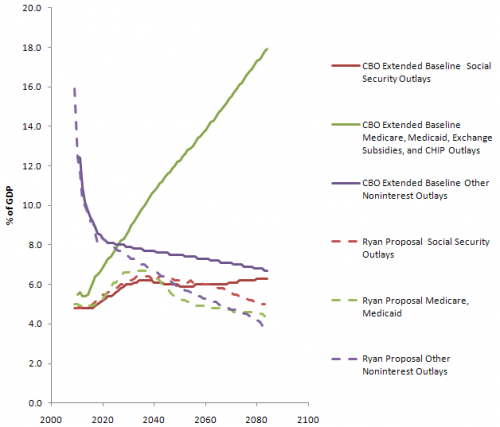 You can see several things here:
- Social security is untouched until some time after 2050. CBO says that the proposal doesn’t change the program; Ryan’s web site partially privatizes it after about a decade and “eventually” raises the retirement age. There seems to be some disconnect here.
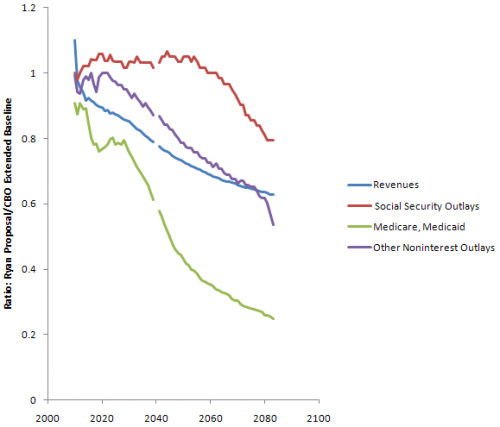
- Health care outlays are drastically lower; this is clearly where the bulk of the savings originate. Even so, there’s not much change in the trend until at least 2025 (the initial absolute difference is definitional – inclusion of programs other than Medicare/Medicaid in the CBO version).
- Other noninterest outlays also fall substantially – presumably this means that all other expenditures would have to fit into a box not much bigger than today’s defense budget, which seems like a heroic assumption even if you get rid of unemployment, SSI, food stamps, Section 8, and all similar support programs.
You can also look at the ratio of outlays under Ryan vs. CBO’s Extended Baseline:
Since health care carries the flag for savings, the question is, will the proposal work? I’ll take a look at that next.
Federal budget perceptions vs. reality
There’s an interesting discussion about a CNN poll of public perceptions of the federal budget over at Statistical Modeling. Don’t bias yourself – check it out and test yourself before you peek at my contribution below the fold.
April Fools in the MT Legislature
I was planning an April Fool’s Day post to mock the Montana legislature, but I really can’t top what’s actually been going on in Helena over the past few days. One bar-owning legislator proposed rolling back DUI laws, to preserve the sacred small town rite of driving home drunk from the bar. The same day, they seriously debated putting the state on the gold standard, which drew open laughter and an amendment to permit paying state transactions in coal. The gold bugs, who fancy themselves constitutional scholars, evidently weren’t around when the proposal to assert eminent domain power over federal lands was drafted. I could go on and on… It’s troubling, because I keep getting my news reader feed mixed up with The Onion.
A comment at the Bozeman Daily Chronicle captured widespread sentiment around here better than I can:
Hey members of the house- Thanks for wasting our money. Try to do something productive up there instead of making all Montanans look like a bunch of idiots. If I was as worthless as you I’d kick my own a_$. Put that in your cowboy code…
Dynamics of Fukushima Radiation
I like maps, but I love time series.
ScienceInsider has a nice roundup of radiation maps. I visited a few, and found current readings, but got curious about the dynamics, which were not evident.
So, I grabbed Marian Steinbach’s scraped data and filtered it to a manageable size. Here’s what I got for the 9 radiation measurement stations in Ibaraki prefecture, where the Fukushima-Daiichi reactors are located:
The time series above (click it to enlarge) shows about 10 days of background readings, pre-quake, followed by some intense spikes of radiation, with periods of what looks like classic exponential decay behavior. “Intense” is relative, because fortunately those numbers are in nanoGrays, which are small.
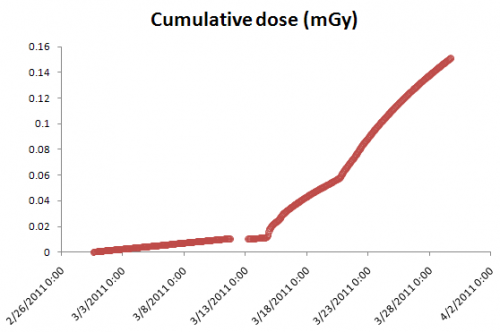
The cumulative dose at these sites is not yet high, but climbing:
The Fukushima contribution to cumulative dose is about .15 milliGrays – according to this chart, roughly a chest x-ray. Of course, if you extrapolate to long exposure from living there, that’s not good, but fortunately the decay process is also underway.
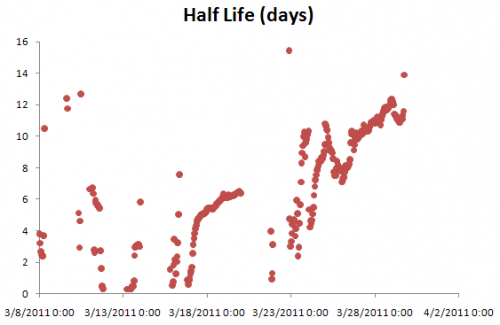
The interesting thing about the decay process is that it shows signs of having multiple time constants. That’s exactly what you’d expect, given that there’s a mix of isotopes with different half lives and a mix of processes (radioactive decay and physical transport of deposited material through the environment).
The linear increases in the time constant during the long, smooth periods of decay presumably arise as fast processes play themselves out, leaving the longer time constants to dominate. For example, if you have a patch of soil with cesium and iodine in it, the iodine – half life 8 days – will be 95% gone in a little over a month, leaving the cesium – half life 30 years – to dominate the local radiation, with a vastly slower rate of decay.
Since the longer-lived isotopes will dominate the future around the plant, the key question then is what the environmental transport processes do with the stuff.
Update: Here’s the Steinbach data, aggregated to hourly (from 10min) frequency, with -888 and -888 entries removed, and trimmed in latitude range. Station_data Query hourly (.zip)
Nuclear safety follies
I find panic-fueled iodine marketing and disingenuous comparisons of Fukushima to Chernobyl deplorable.
 But those are balanced by pronouncements like this:
Telephone briefing from Sir John Beddington, the UK’s chief scientific adviser, and Hilary Walker, deputy director for emergency preparedness at the Department of Health.“Unequivocally, Tokyo will not be affected by the radiation fallout of explosions that have occurred or may occur at the Fukushima nuclear power stations.”
Surely the prospect of large scale radiation release is very low, but it’s not approximately zero, which is my interpretation of “unequivocally not.”
On my list of the seven deadly sins of complex systems management, number four is,
Certainty. Planning for it leads to fragile strategies. If you can’t imagine a way you could be wrong, you’re probably a fanatic.
Nuclear engineers disagree, but some seem to have a near-fanatic faith in plant safety. Normal Accidents documents some bizarrely cheerful post-accident reflections on safety. I found another when reading up over the last few days:

