Cumulative Normal Distribution

Vensim doesn’t have a function for the cumulative normal distribution, but it’s easy to implement via a macro. I used to use a polynomial cited in Numerical Recipes (error function, Ch. 6.2):

:MACRO: NCDF(x)
NCDF = 1-Complementary Normal CDF
~	dmnl
~		|
Complementary Normal CDF=
ERFCy/2
~	dmnl
~		|
ERFCy = IF THEN ELSE(y>=0,ans,2-ans)
~	dmnl
~	http://www.library.cornell.edu/nr/bookcpdf/c6-2.pdf
|
y = x/sqrt(2)
~	dmnl
~		|
ans=t*exp(-z*z-1.26551+t*(1.00002+t*(0.374092+t*(0.0967842+
t*(-0.186288+t*(0.278868+t*(-1.1352+t*(1.48852+
t*(-0.822152+t*0.170873)))))))))
~	dmnl
~		|
t=1/(1+0.5*z)
~	dmnl
~		|
z = ABS(y)
~	dmnl
~		|
:END OF MACRO:

I recently discovered a better approximation here, from algorithm 26.2.17 in Abromowitz and Stegun, Handbook of Mathematical Functions:

:MACRO: NCDF2(x)
NCDF2 =  IF THEN ELSE(x >= 0,
(1 - c * exp( -x * x / 2 ) * t *
( t *( t * ( t * ( t * b5 + b4 ) + b3 ) + b2 ) + b1 )),  ( c * exp( -x * x / 2 ) * t *
( t *( t * ( t * ( t * b5 + b4 ) + b3 ) + b2 ) + b1 ))
)
~     dmnl
~     From http://www.sitmo.com/doc/Calculating_the_Cumulative_Normal_Distribution
Implements algorithm 26.2.17 from Abromowitz and Stegun, Handbook of Mathematical 
Functions. It has a maximum absolute error of 7.5e^-8.
http://www.math.sfu.ca/
|
c  =  0.398942
~     dmnl
~           |
t = IF THEN ELSE( x >= 0, 1/(1+p*x), 1/(1-p*x))
~     dmnl
~           |
b5 =  1.33027
~     dmnl
~           |
b4 = -1.82126
~     dmnl
~           |
b3 =  1.78148
~     dmnl
~           |
b2 = -0.356564
~     dmnl
~           |
b1 =  0.319382
~     dmnl
~           |
p  =  0.231642
~     dmnl
~           |
:END OF MACRO:

In advanced Vensim versions, paste the macro into the header of your model (View>As Text). Otherwise, you can implement the equations inside the macro directly in your model.

Diagrams vs. Models

Following Bill Harris’ comment on Are causal loop diagrams useful? I went looking for Coyle’s hybrid influence diagrams. I didn’t find them, but instead ran across this interesting conversation in the SDR:

The tradition, one might call it the orthodoxy, in system dynamics is that a problem can only be analysed, and policy guidance given, through the aegis of a fully quantified model. In the last 15 years, however, a number of purely qualitative models have been described, and have been criticised, in the literature. This article briefly reviews that debate and then discusses some of the problems and risks sometimes involved in quantification. Those problems are exemplified by an analysis of a particular model, which turns out to bear little relation to the real problem it purported to analyse. Some qualitative models are then reviewed to show that they can, indeed, lead to policy insights and five roles for qualitative models are identified. Finally, a research agenda is proposed to determine the wise balance between qualitative and quantitative models.

… In none of this work was it stated or implied that dynamic behaviour can reliably be inferred from a complex diagram; it has simply been argued that describing a system is, in itself, a useful thing to do and may lead to better understanding of the problem in question. It has, on the other hand, been implied that, in some cases, quantification might be fraught with so many uncertainties that the model’s outputs could be so misleading that the policy inferences drawn from them might be illusory. The research issue is whether or not there are circumstances in which the uncertainties of simulation may be so large that the results are seriously misleading to the analyst and the client. … This stream of work has attracted some adverse comment. Lane has gone so far as to assert that system dynamics without quantified simulation is an oxymoron and has called it ‘system dynamics lite (sic)’. …

Coyle (2000) Qualitative and quantitative modelling in system dynamics: some research questions

Jack Homer and Rogelio Oliva aren’t buying it:

Geoff Coyle has recently posed the question as to whether or not there may be situations in which computer simulation adds no value beyond that gained from qualitative causal-loop mapping. We argue that simulation nearly always adds value, even in the face of significant uncertainties about data and the formulation of soft variables. This value derives from the fact that simulation models are formally testable, making it possible to draw behavioral and policy inferences reliably through simulation in a way that is rarely possible with maps alone. Even in those cases in which the uncertainties are too great to reach firm conclusions from a model, simulation can provide value by indicating which pieces of information would be required in order to make firm conclusions possible. Though qualitative mapping is useful for describing a problem situation and its possible causes and solutions, the added value of simulation modeling suggests that it should be used for dynamic analysis whenever the stakes are significant and time and budget permit.

Homer & Oliva (2001) Maps and models in system dynamics: a response to Coyle

Coyle rejoins:

This rejoinder clarifies that there is significant agreement between my position and that of Homer and Oliva as elaborated in their response. Where we differ is largely to the extent that quantification offers worthwhile benefit over and above analysis from qualitative analysis (diagrams and discourse) alone. Quantification may indeed offer potential value in many cases, though even here it may not actually represent ‘‘value for money’’. However, even more concerning is that in other cases the risks associated with attempting to quantify multiple and poorly understood soft relationships are likely to outweigh whatever potential benefit there might be. To support these propositions I add further citations to published work that recount effective qualitative-only based studies, and I offer a further real-world example where any attempts to quantify ‘‘multiple softness’’ could have lead to confusion rather than enlightenment. My proposition remains that this is an issue that deserves real research to test the positions of Homer and Oliva, myself, and no doubt others, which are at this stage largely based on personal experiences and anecdotal evidence.

Coyle (2001) Rejoinder to Homer and Oliva

My take: I agree with Coyle that qualitative models can often lead to insight. However, I don’t buy the argument that the risks of quantification of poorly understood soft variables exceeds the benefits. First, if the variables in question are really too squishy to get a grip on, that part of the modeling effort will fail. Even so, the modeler will have some other working pieces that are more physical or certain, providing insight into the context in which the soft variables operate. Second, as long as the modeler is doing things right, which means spending ample effort on validation and sensitivity analysis, the danger of dodgy quantification will reveal itself as large uncertainties in behavior subject to the assumptions in question. Third, the mere attempt  to quantify the qualitative is likely to yield some insight into the uncertain variables, which exceeds that derived from the purely qualitative approach. In fact, I would argue that the greater danger lies in the qualitative approach, because it is quite likely that plausible-looking constructs on a diagram will go unchallenged, yet harbor deep conceptual problems that would be revealed by modeling.

I see this as a cost-benefit question. With infinite resources, a model always beats a diagram. The trouble is that in many cases time, money and the will of participants are in short supply, or can’t be justified given the small scale of a problem. Often in those cases a qualitative approach is justified, and diagramming or other elicitation of structure is likely to yield a better outcome than pure talk. Also, where resources are limited, an overzealous modeling attempt could lead to narrow focus, overemphasis on easily quantifiable concepts, and implementation failure due to too much model and not enough process. If there’s a risk to modeling, that’s it – but that’s a risk of bad modeling, and there are many of those.

Are causal loop diagrams useful?

Reflecting on the Afghanistan counterinsurgency diagram in the NYTimes, Scott Johnson asked me whether I found causal loop diagrams (CLDs) to be useful. Some system dynamics hardliners don’t like them, and others use them routinely.

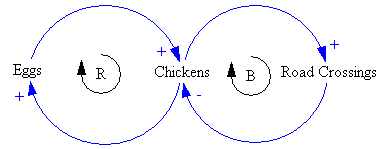
Here’s a CLD:

Chicken CLD

And here’s it’s stock-flow sibling:

Chicken Stock Flow

My bottom line is:

  • CLDs are very useful, if developed and presented with a little care.
  • It’s often clearer to use a hybrid diagram that includes stock-flow “main chains”. However, that also involves a higher burden of explanation of the visual language.
  • You can get into a lot of trouble if you try to mentally simulate the dynamics of a complex CLD, because they’re so underspecified (but you might be better off than talking, or making lists).
  • You’re more likely to know what you’re talking about if you go through the process of building a model.
  • A big, messy picture of a whole problem space can be a nice complement to a focused, high quality model.

Here’s why:

Continue reading “Are causal loop diagrams useful?”

Visualizing biological time

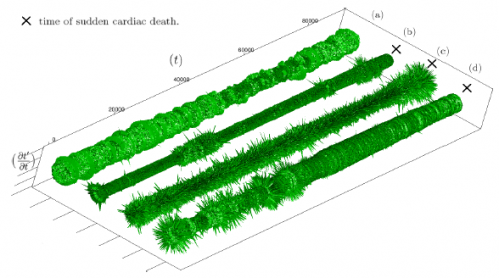
A new paper on arXiv shows an interesting approach to visualizing time in systems with circadian or other rhythms. I haven’t figured out if it’s useful for oscillatory dynamic systems more generally, but it makes some neat visuals:

scheme

The method makes it possible to see changes in behavior in time series with waaay to many oscillations to explore on a normal 2D time-value plot:

cardiac

Read more on arXiv.

WORLD3-03

This is the latest instance of the WORLD3 model, as in Limits to Growth – the 30 year update, from the standard Vensim distribution. It’s not much changed from the 1972 original used in Limits to Growth, which is documented in great detail in Dynamics of Growth in a Finite World (half off at Pegasus as of this moment).

There have been many critiques of this model, including the fairly famous Models of Doom. Many are ideological screeds that miss the point, and many modern critics do not appear to have read the book. The only good, comprehensive technical critique of World3 that I’m aware of is Wil Thissen’s thesis, Investigations into the Club of Rome’s WORLD3 model: lessons for understanding complicated models (Eindhoven, 1978). Portions appeared in IEEE Transactions.

My take on the more sensible critiques is that they show two things:

  • WORLD3 is an imperfect expression of the underlying ideas in Limits to Growth.
  • WORLD3 doesn’t have the policy space to capture competing viewpoints about the global situation; in particular it does not represent markets and technology as many see them.

It doesn’t necessarily follow from those facts that the underlying ideas of Limits are wrong. We still have to grapple with the consequences of exponential growth confronting finite planetary boundaries with long perception and action delays.

I’ve written some other material on limits here.

Files: WORLD3-03 (zipped archive of Vensim models and constant changes)

Payments for Environmental Services

From ModelWiki

Jump to: navigation, search

Model Name: payments, penalties, and environmental ethic

Citation: Dudley, R. 2007. Payments, penalties, payouts, and environmental ethics: a system dynamics examination Sustainability: Science, Practice, & Policy 3(2):24-35. http://ejournal.nbii.org/archives/vol3iss2/0706-013.dudley.html.

Source: Richard G. Dudley

Copyright: Richard G. Dudley (2007)

License: Gnu GPL

Peer reviewed: Yes (probably when submitted for publication?)

Units balance: Yes

Format: Vensim

Target audience: People interested in the concept of payments for environmental services as a means of improving land use and conservation of natural resources.

Questions answered: How might land users’ environmental ethic be influenced by, and influence, payments for environmental services.

Software: Vensim

Files:

http://modelwiki.metasd.com/images/d/db/SSPP_PES_and_Env_Ethic_2007-09-25.vmf

Rental car stochastic dynamics

This is a little experimental model that I developed to investigate stochastic allocation of rental cars, in response to a Vensim forum question.

There’s a single fleet of rental cars distributed around 50 cities, connected by a random distance matrix (probably not physically realizable on a 2D manifold, but good enough for test purposes). In each city, customers arrive at random, rent a car if available, and return it locally or in another city. Along the way, the dawdle a bit, so returns are essentially a 2nd order delay of rentals: a combination of transit time and idle time.

The two interesting features here are:

  • Proper use of Poisson arrivals within each time step, so that car flows are dimensionally consistent and preserve the integer constraint (no fractional cars)
  • Use of Vensim’s ALLOC_P/MARKETP functions to constrain rentals when car availability is low. The usual approach, setting actual = MIN(desired, available/TIME STEP), doesn’t work because available is subscripted by 50 cities, while desired has 50 x 50 origin-destination pairs. Therefore the constrained allocation could result in fractional cars. The alternative approach is to set up a randomized first-come, first-served queue, so that any shortfall preserves the integer constraint.

The interesting experiment with this model is to lower the fleet until it becomes a constraint (at around 10,000 cars).

Documentation is sparse, but units balance.

Requires an advanced Vensim version (for arrays) or the free Model Reader.

carRental.vpm carRental.vmf

Update, with improved distribution choice and smaller array dimensions for convenience:

carRental2.mdl carRental2.vpm

Pink Noise

In a continuous time dynamic model, representing noise as a random draw at every time step can be problematic. As the time step is decreased, the high frequency power of the noise spectrum increases accordingly, potentially changing the behavior. In the limit of small time steps, the resulting white noise has infinite power, which is not physically realistic.

The solution is to use pink noise, which is essentially white noise filtered to cut off high frequencies. SD models from the bad old days typically employed a pink noise generating structure that employed uniformly distributed white noise, relying on the central limit theorem to yield a normally distributed output. Ed Anderson improved that structure to incorporate a normally distributed input, which works better, especially if the cutoff frequency is close to the inverse of the time step.

Two versions of the model are attached: one for advanced versions of Vensim, which permit implementation as a :MACRO:, for efficient reuse. The other works with Vensim PLE.

PinkNoise2010.mdl PinkNoise2010.vmf PinkNoise2010.vpm

PinkNoise2010-PLE.vmf PinkNoise2010-PLE.vpm

Contributed by Ed Anderson, updated by Tom Fiddaman

Notes (also in the model files):

Description: The pink noise molecule described generates a simple random series with autocorrelation. This is useful in representing time series, like rainfall from day to day, in which today’s value has some correlation with what happened yesterday. This particular formulation will also have properties such as standard deviation and mean that are insensitive both to the time step and the correlation (smoothing) time. Finally, the output as a whole and the difference in values between any two days is guaranteed to be Gaussian (normal) in distribution.

Behavior: Pink noise series will have both a historical and a random component during each period. The relative “trend-to-noise” ratio is controlled by the length of the correlation time. As the correlation time approaches zero, the pink noise output will become more independent of its historical value and more “noisy.” On the other hand, as the correlation time approaches infinity, the pink noise output will approximate a continuous time random walk or Brownian motion. Displayed above are two time series with correlation times of 1 and 8 months. While both series have approximately the same standard deviation, the 1-month correlation time series is less smooth from period to period than the 8-month series, which is characterized by “sustained” swings in a given direction. Note that this behavior will be independent of the time-step. The “pink” in pink noise refers to the power spectrum of the output. A time series in which each period’s observation is independent of the past is characterized by a flat or “white” power spectrum. Smoothing a time series attenuates the higher or “bluer” frequencies of the power spectrum, leaving the lower or “redder” frequencies relatively stronger in the output.

Caveats: This assumes the use of Euler integration with a time step of no more than 1/4 of the correlation time. Very long correlation times should be avoided also as the multiplication in the scaled white noise will become progressively less accurate.

Technical Notes: This particular form of pink noise is superior to that of Britting presented in Richardson and Pugh (1981) because the Gaussian (Normal) distribution of the output does not depend on the Central Limit Theorem. (Dynamo did not have a Gaussian random number generator and hence R&P had to invoke the CLM to get a normal distribution.) Rather, this molecule’s normal output is a result of the observations being a sum of Gaussian draws. Hence, the series over short intervals should better approximate normality than the macro in R&P.

MEAN: This is the desired mean for the pink noise.

STD DEVIATION: This is the desired standard deviation for the pink noise.

CORRELATION TIME: This is the smooth time for the noise, or for the more technically minded this is the inverse of the filter’s cut-off frequency in radians.

The Trouble with Spreadsheets

As a prelude to my next look at alternative fuels models, some thoughts on spreadsheets.

Everyone loves to hate spreadsheets, and it’s especially easy to hate Excel 2007 for rearranging the interface: a productivity-killer with no discernible benefit. At the same time, everyone uses them. Magne Myrtveit wonders, Why is the spreadsheet so popular when it is so bad?

Spreadsheets are convenient modeling tools, particularly where substantial data is involved, because numerical inputs and outputs are immediately visible and relationships can be created flexibly. However, flexibility and visibility quickly become problematic when more complex models are involved, because:

  • Structure is invisible and equations, using row-column addresses rather than variable names, are sometimes incomprehensible.
  • Dynamics are difficult to represent; only Euler integration is practical, and propagating dynamic equations over rows and columns is tedious and error-prone.
  • Without matrix subscripting, array operations are hard to identify, because they are implemented through the geography of a worksheet.
  • Arrays with more than two or three dimensions are difficult to work with (row, column, sheet, then what?).
  • Data and model are mixed, so that it is easy to inadvertently modify a parameter and save changes, and then later be unable to easily recover the differences between versions. It’s also easy to break the chain of causality by accidentally replacing an equation with a number.
  • Implementation of scenario and sensitivity analysis requires proliferation of spreadsheets or cumbersome macros and add-in tools.
  • Execution is slow for large models.
  • Adherence to good modeling practices like dimensional consistency is impossible to formally verify

For some of the reasons above, auditing the equations of even a modestly complex spreadsheet is an arduous task. That means spreadsheets hardly ever get audited, which contributes to many of them being lousy. (An add-in tool called Exposé can get you out of that pickle to some extent.)

There are, of course, some benefits: spreadsheets are ubiquitous and many people know how to use them. They have pretty formatting and support a wide variety of data input and output. They support many analysis tools, especially with add-ins.

For my own purposes, I generally restrict spreadsheets to data pre- and post-processing. I do almost everything else in Vensim or a programming language. Even seemingly trivial models are better in Vensim, mainly because it’s easier to avoid unit errors, and more fun to do sensitivity analysis with Synthesim.