The Beer-TV loop

We recently discovered – after 8 years without TV – that we actually can get reception. We watched a bit of the Olympics. My sons were amused and amazed by the ads, which they otherwise seldom see.

That led them to postulate the beer-TV feedback loop, which is a self-reinforcing descent into ignorance and drunken sloth: TV watching -> + beer ad viewing -> + beer drinking -> – cognitive capacity, motivation -> TV watching.

The loop makes a cameo appearance in this CLD we dreamed up during a conversation about education, skill and motivation:

TV beer LoopIt’s a good thing we don’t get Fox, or they’d probably have a lot more to say.

Bulbs banned

The incandescent ban is underway.

Conservative think tanks still hate it:

Actually, I think it’s kind of a dumb idea too – but not as bad as you might think, and in the absence of real energy or climate policy, not as dumb as doing nothing. You’d have to be really dumb to believe this:

The ban was pushed by light bulb makers eager to up-sell customers on longer-lasting and much more expensive halogen, compact fluourescent, and LED lighting.

More expensive? Only in a universe where energy and labor costs don’t count (Texas?) and for a few applications (very low usage, or chicken warming).

bulb economicsOver the last couple years I’ve replaced almost all lighting in my house with LEDs. The light is better, the emissions are lower, and I have yet to see a failure (unlike cheap CFLs).

I built a little bulb calculator in Vensim, which shows huge advantages for LEDs in most situations, even with conservative assumptions (low social price of carbon, minimum wage) it’s hard to make incandescents look good. It’s also a nice example of using Vensim for spreadsheet replacement, on a problem that’s not very dynamic but has natural array structure.

bulbModelGet it: bulb.mdl or bulb.vpm (uses arrays, so you’ll need the free Model Reader)

Those crazy Marxists are at it again

“Normally, conservatives extol the magic of markets and the adaptability of the private sector, which is supposedly able to transcend with ease any constraints posed by, say, limited supplies of natural resources. But as soon as anyone proposes adding a few limits to reflect environmental issues — such as a cap on carbon emissions — those all-capable corporations supposedly lose any ability to cope with change.” Krugman – NYT

Parameter Distributions

Answering my own question, here’s the distribution of all 12,000 constants from a dozen models, harvested from my hard drive. About half are from Ventana, and there are a few classics, like World3. All are policy models – no physics, biology, etc.

ParamDist
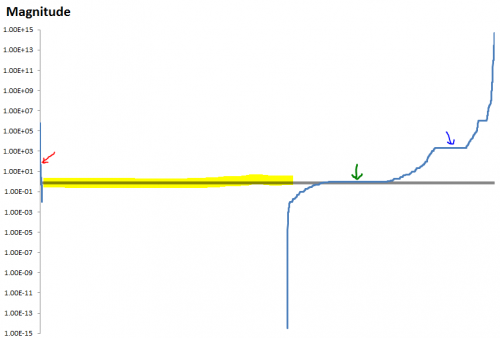
The vertical scale is magnitude, ABS(x). Values are sorted on the horizontal axis, so that negative values appear on the left. Incredibly, there were only about 60 negative values in the set. Clearly, unlike linear models where signs fall where they may, there’s a strong user preference for parameters with a positive sense.

Next comes a big block of 0s, which don’t show on the log scale. Most of the 0s are not really interesting parameters; they’re things like switches in subscript mapping, though doubtless some are real.

At the right are the positive values, ranging from about 10^-15 to 10^+15. The extremes are units converters and physical parameters (area of the earth). There are a couple of flat spots in the distribution – 1s (green arrow), probably corresponding with the 0s, though some are surely “interesting”, and years (i.e. things with a value of about 2000, blue arrow).

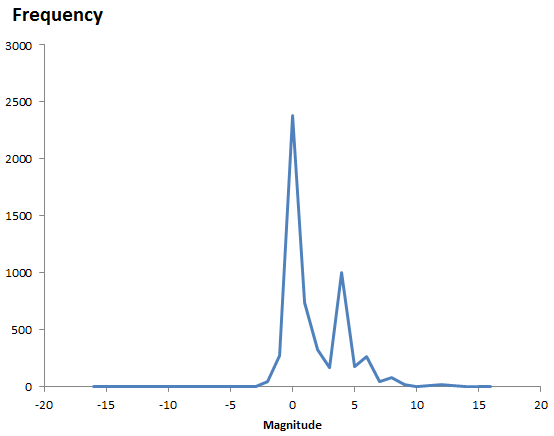
If you look at just the positive parameters, here’s the density histogram, in log10 magnitude bins:

PositiveParmDistAgain, the two big peaks are the 1s and the 2000s. The 0s would be off the scale by a factor of 2. There’s clearly some asymmetry – more numbers greater than 1 (magnitude 0) than less.

LogPositiveParamDist
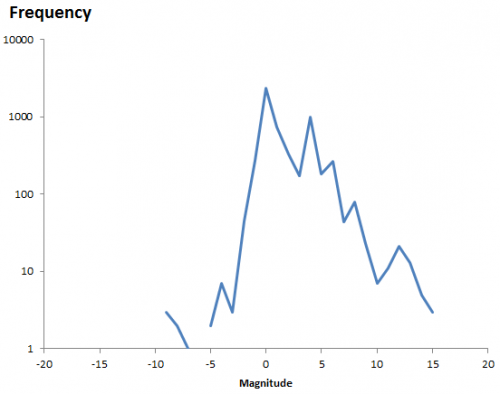
One thing that seems clear here is that log-uniform (which would be a flat line on the last two graphs) is a bad guess.

What's the empirical distribution of parameters?

Vensim‘s answer to exploring ill-behaved problem spaces is either to do hill-climbing with random restarts, or MCMC and simulated annealing. Either way, you need to start with some initial distribution of points to search.

It’s helpful if that distribution is somehow efficient at exploring the interesting parts of the space. I think this is closely related to the problem of selecting uninformative priors in Bayesian statistics. There’s lots of research about appropriate uninformative priors for various kinds of parameters. For example,

  • If a parameter represents a probability, one might choose the Jeffreys or Haldane prior.
  • Indifference to units, scale and inversion might suggest the use of a log uniform prior, where nothing else is known about a positive parameter

However, when a user specifies a parameter in Vensim, we don’t even know what it represents. So what’s the appropriate prior for a parameter that might be positive or negative, a probability, a time constant, a scale factor, an initial condition for a physical stock, etc.?

On the other hand, we aren’t quite as ignorant as the pure maximum entropy derivation usually assumes. For example,

  • All numbers have to lie between the largest and smallest float or double, i.e. +/- 3e38 or 2e308.
  • More practically, no one scales their models such that a parameter like 6.5e173 would ever be required. There’s a reason that metric prefixes range from yotta to yocto (10^24 to 10^-24). The only constant I can think of that approaches that range is Avogadro’s number (though there are probably others), and that’s not normally a changeable parameter.
  • For lots of things, one can impose more constraints, given a little more information,
    • A time constant or delay must lie on [TIME STEP,infinity], and the “infinity” of interest is practically limited by the simulation duration.
    • A fractional rate of change similarly must lie on [-1/TIME STEP,1/TIME STEP] for stability
    • Other parameters probably have limits for stability, though it may be hard to discover them except by experiment.
    • A parameter with units of year is probably modern, [1900-2100], unless you’re doing Mayan archaeology or paleoclimate.

At some point, the assumptions become too heroic, and we need to rely on users for some help. But it would still be really interesting to see the distribution of all parameters in real models. (See next …)

In {R^n, n large}, no one can hear you scream.

I haven’t had time to write much lately. I spent several weeks in arcane code purgatory, discovering the fun of macros containing uninitialized thread pointers that only fail in 64 bit environments, and for different reasons on Windows, Mac and Linux. That’s a dark place that I hope never again to visit.

Now I’m working fun things again, but they’re secret, so I can’t discuss details. Instead, I’ll just share a little observation that came up in the process.

Frequently, we do calibration or policy optimization on models with a lot of parameters. “A lot” is actually a pretty small number – like 10 – when you have to do things by brute force. This works more often than we have a right to expect, given the potential combinatorial explosion this entails.

However, I suspect that we (at least I) don’t fully appreciate what’s going on. Here are two provable facts that make sense upon reflection, but weren’t part of my intuition about such problems:

In other words, R^n gets big really fast, and it’s all corners. The saving grace is probably that sensible parameters are frequently distributed on low-dimensional manifolds embedded in high dimensional spaces. But we should probably be more afraid than we typically are.

We already tried monarchy

Tom Perkins thinks votes should be proportional to taxes paid. (As if they weren’t already, to some degree!)

PerkinsHenryVIIIImages: CNN & The London Dungeon

You don’t have to look very far in history to find a system in which political power and ownership of assets were embodied in the same few people. We called its advocates “monarchists,” and there were remedies for that.

tar-and-featherThe founding fathers were rightfully aware of the need to prevent runaway positive feedback of wealth and power. Perkins evidently fears runaway negative feedback:

“The fear is wealth tax, higher taxes, higher death taxes — just more taxes until there is no more 1%. And that that will creep down to the 5% and then the 10%,” he said.

This is ignores conservation laws. If punitive taxation could really bring the wealth of the 1% down, where would all that money, and its underlying assets, actually go? And how can this be a real concern, when in fact incomes at the top are dramatically increasing by any measure?

So, Perkins is,

  • not a student of history
  • not a fan of democracy
  • not a keen observer of current trends
  • bad at economics

— or —

  • willing to fib about it all for personal gain

and we should give him a million votes?

Update: I’ve played this game before.

Species Restoration & Policy Resistance

I’ve seen a lot of attention lately to restoration of extinct species. It strikes me as a band-aid, not a solution.

Here’s the core of the system:

speciesReintroCritters don’t go extinct for lack of human intervention. They go extinct because the balance of birth and death rates is unfavorable, so that population declines, and (stochastically) winks out.

That happens naturally of course, but anthropogenic extinctions are happening much faster than usual. The drivers (red) are direct harvest and loss of the resource base on which species rely. The resource base is largely habitat, but also other species and ecosystem services that are themselves harvested, poisoned by pollutants, etc.

Reintroducing lost species may be helpful in itself (who wouldn’t want to see millions of passenger pigeons?), but unless the basic drivers of overharvest and resource loss are addressed, species are reintroduced into an environment in which the net gain of births and deaths favors re-extinction. What’s the point of that?

If the drivers of extinction – ultimately population and capital growth plus bad management – were under control, we wouldn’t need much restoration. If they’re out of control, genetic restoration seems likely to be overwhelmed, or perhaps even to contribute to problems through parachuting cats side effects.

speciesReintro2This is not where I’d be looking for leverage.

Geoengineering justice & governance

From Clive Hamilton via Technology Review,

If humans were sufficiently omniscient and omnipotent, would we, like God, use climate engineering methods benevolently? Earth system science cannot answer this question, but it hardly needs to, for we know the answer already. Given that humans are proposing to engineer the climate because of a cascade of institutional failings and self-interested behaviours, any suggestions that deployment of a solar shield would be done in a way that fulfilled the strongest principles of justice and compassion would lack credibility, to say the least.

Geoengineering seems sure to make a mess, even if the tech works.

Self-generated seasonal cycles

This time of year, systems thinkers should eschew sugar plum fairies and instead dream of Industrial Dynamics, Appendix N:

Self-generated Seasonal Cycles

Industrial policies adopted in recognition of seasonal sales patterns may often accentuate the very seasonality from which they arise. A seasonal forecast can lead to action that may cause fulfillment of the forecast. In closed-loop systems this is a likely possibility. The analysis of sales data in search of seasonality is fraught with many dangers. As discussed in Appendix F, random-noise disturbances contain a broad band of component frequencies. This means that any effort toward statistical isolation of a seasonal sales component will find some seasonality in the random disturbances. Should the seasonality so located lead to decisions that create actual seasonality, the process can become self-regenerative.

Self-induced seasonality appears to occur many places in American industry. Sometimes it is obvious and clearly recognized, and perhaps little can be done about it. An example of the obvious is the strong seasonality in items such as cameras sold in the Christmas trade. By bringing out new models and by advertising and other sales promotion in anticipation of Christmas purchases, the industry tends to concentrate its sales at this particular time of year.

Other kinds of seasonality are much less clear. Almost always when seasonality is expected, explanations can be found to justify whatever one believes to be true. A tradition can be established that a particular item sells better at a certain time of year. As this “fact” becomes more and more widely believed, it may tend to concentrate sales effort at the time when the customers are believed to wish to buy. This in turn still further heightens the sales at that particular time.

Retailer sales & e-commerce sales, from FRED