Kerry-Lieberman "American Power Act" leaked

I think it’s a second-best policy, but perhaps the most we can hope for, and better than nothing.

Climate Progress has a first analysis and links to the leaked draft legislation outline and short summary of the Kerry-Lieberman American Power Act. [Update: there’s now a nice summary table.] For me, the bottom line is, what are the emissions and price trajectories, what emissions are covered, and where does the money go?

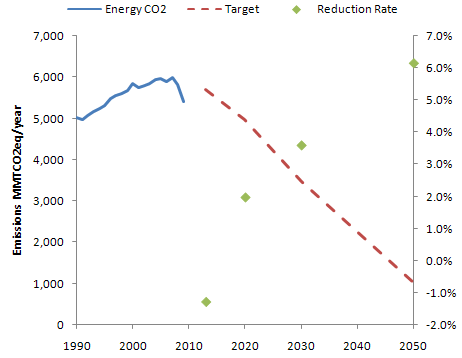
The target is 95.25% of 2005 by 2013, 83% by 2020, 58% by 2030, and 17% by 2050, with six Kyoto gases covered. Entities over 25 MTCO2eq/year are covered. Sector coverage is unclear; the summary refers to “the three major emitting sectors, power plants, heavy industry, and transportation” which is actually a rather incomplete list. Presumably the implication is that a lot of residential, commercial, and manufacturing emissions get picked up upstream, but the mechanics aren’t clear.

The target looks like this [Update: ignoring minor gases]:
Kerry Lieberman Target

This is not much different from ACES or CLEAR, and like them it’s backwards. Emissions reductions are back-loaded. The rate of reduction (green dots) from 2030 to 2050, 6.1%/year, is hardly plausible without massive retrofit or abandonment of existing capital (or negative economic growth). Given that the easiest reductions are likely to be the first, not the last, more aggressive action should be happening up front. (Actually there are a multitude of reasons for front-loading reductions as much as reasonable price stability allows).

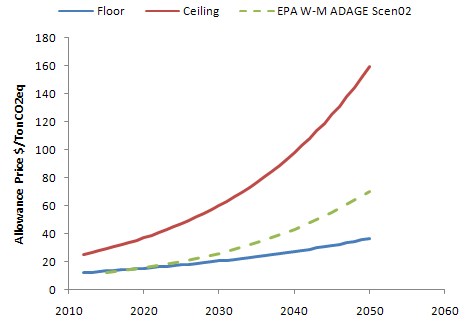
There’s also a price collar:
Kerry Lieberman Price

These mechanisms provide a predictable price corridor, with the expected prices of the EPA Waxman-Markey analysis (dashed green) running right up the middle. The silly strategic reserve is gone. Still, I think this arrangement is backwards, in a different sense from the target. The right way to manage the uncertainty in the long run emissions trajectory needed to stabilize climate without triggering short run economic dislocation is with a mechanism that yields stable prices over the short to medium term, while providing for adaptive adjustment of the long term price trajectory to achieve emissions stability. A cap and trade with no safety valve is essentially the opposite of that: short run volatility with long run rigidity, and therefore a poor choice. The price collar bounds the short term volatility to 2:1 (early) to 4:1 (late) price movements, but it doesn’t do anything to provide for adaptation of the emissions target or price collar if emissions reductions turn out to be unexpectedly hard, easy, important, etc. It’s likely that the target and collar will be regarded as property rights and hard to change later in the game.

I think we should expect the unexpected. My personal guess is that the EPA allowance price estimates are way too low. In that case, we’ll find ourselves stuck on the price ceiling, with targets unmet. 83% reductions in emissions at an emissions price corresponding with under $1/gallon for fuel just strike me as unlikely, unless we’re very lucky technologically. My preference would be an adaptive carbon price, starting at a substantially higher level (high enough to prevent investment in new carbon intensive capital, but not so high initially as to strand those assets – maybe $50/TonCO2). By default, the price should rise at some modest rate, with an explicit adjustment process taking place at longish intervals so that new information can be incorporated. Essentially the goal is to implement feedback control that stabilizes long term climate without short term volatility (as here or here and here).

Some other gut reactions:

Good:

  • Clean energy R&D funding.
  • Allowance distribution by auction.
  • Border adjustments (I can only find these in the summary, not the draft outline).

Bad:

  • More subsidies, guarantees and other support for nuclear power plants. Why not let the first round play out first? Is this really a good use of resources or a level playing field?
  • Subsidized CCS deployment. There are good reasons for subsidizing R&D, but deployment should be primarily motivated by the economic incentive of the emissions price.
  • Other deployment incentives. Let the price do the work!
  • Rebates through utilities. There’s good evidence that total bills are more salient to consumers than marginal costs, so this at least partially defeats the price signal. At least it’s temporary (though transient measures have a way of becoming entitlements).

Indifferent:

  • Preemption of state cap & trade schemes. Sorry, RGGI, AB32, and WCI. This probably has to happen.
  • Green jobs claims. In the long run, employment is controlled by a bunch of negative feedback loops, so it’s not likely to change a lot. The current effects of the housing bust/financial crisis and eventual effects of big twin deficits are likely to overwhelm any climate policy signal. The real issue is how to create wealth without borrowing it from the future (e.g., by filling up the atmospheric bathtub with GHGs) and sustaining vulnerability to oil shocks, and on that score this is a good move.
  • State preemption of offshore oil leasing within 75 miles of its shoreline. Is this anything more than an illusion of protection?
  • Banking, borrowing and offsets allowed.

Unclear:

  • Performance standards for coal plants.
  • Transportation efficiency measures.
  • Industry rebates to prevent leakage (does this defeat the price signal?).

John Sterman on solving our biggest problems


The key message is that climate, health, and other big messy problems don’t have purely technical fixes. Therefore Manhattan Project approaches to solving them won’t work. Creating and deploying solutions to these problems requires public involvement and widespread change with distributed leadership. The challenge is to get public understanding of climate to carry the same sense of urgency that drove the civil rights movement. From a series at the IBM Almaden Institute conference.

Another look at inadequate Copenhagen pledges

Joeri Rogelj and others argue that Copenhagen Accord pledges are paltry in a Nature Opinion,

Current national emissions targets can’t limit global warming to 2 °C, calculate Joeri Rogelj, Malte Meinshausen and colleagues — they might even lock the world into exceeding 3 °C warming.

  • Nations will probably meet only the lower ends of their emissions pledges in the absence of a binding international agreement
  • Nations can bank an estimated 12 gigatonnes of Co2 equivalents surplus allowances for use after 2012
  • Land-use rules are likely to result in further allowance increases of 0.5 GtCO2-eq per year
  • Global emissions in 2020 could thus be up to 20% higher than today
  • Current pledges mean a greater than 50% chance that warming will exceed 3°C by 2100
  • If nations agree to halve emissions by 2050, there is still a 50% chance that warming will exceed 2°C and will almost certainly exceed 1.5°C

Via Nature’s Climate Feedback, Copenhagen Accord – missing the mark.

Montana's climate future

A selection of data and projections on past and future climate in Montana:

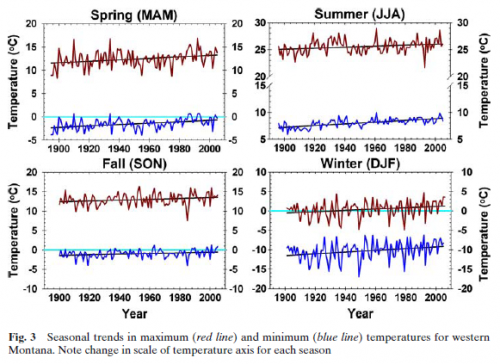
Temperature Trends Western MT

Pederson et al. (2010) A century of climate and ecosystem change in Western Montana: what do temperature trends portend? Climatic Change 98:133-154. It’s hard to read precisely off the graph, but there have been significant increases in maximum and minimum temperatures, with the greatest increases in the minimums and in winter – exactly what you’d expect from a change in radiative properties. As a result the daily temperature range has shrunk slightly and there are fewer below freezing and below zero days. That last metric is critical, because it’s the severe cold that controls many forest pests. There’s much more on this in a poster.

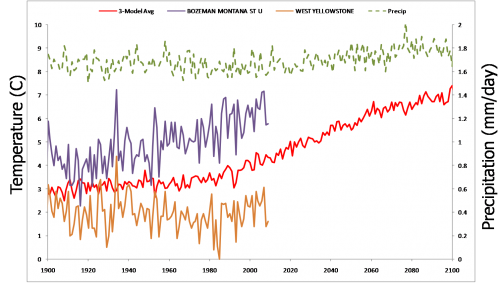
Model Futures

Not every station shows a trend – the figure above contrasts Bozeman (purple, strong trend) with West Yellowstone (orange, flat). The Bozeman trend is probably not an urban heat island effect – surfacestations.org thinks it’s a good site, and White Sulphur (a nice sleepy town up the road a piece) is about the same. The red line is an ensemble of  simulations (GISS, CCSM & ECHAM5) from climexp.knmi.nl, projected into the future with A1B forcings (i.e., a fairly high emissions trajectory). I interpolated the data to latitude 47.6, longitude -110.9 (roughly my house, near Bozeman). Simulated temperature rises about 4C, while precipitation (green) is almost unmoved. If that came true, Montana’s future climate might be a lot like current central Utah.

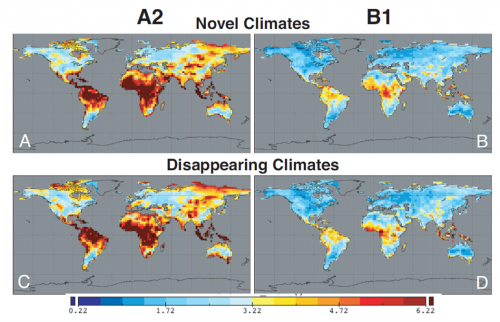
NovelDisappearingClimates

The figure above – from John W. Williams, Stephen T. Jackson, and John E. Kutzbach. Projected distributions of novel and disappearing climates by 2100 AD. PNAS, vol. 104 no. 14 – shows global grid points that have no neighbors within 500km that now have a climate like what the future might bring. In panel C (disappearing climates with the high emissions A2 scenario), there’s a hotspot right over Montana. Presumably that’s loss of today’s high altitude ecosystems. As it warms up, climate zones move uphill, but at the top of mountains there’s nowhere to go. That’s why pikas may be in trouble.

pika

MT Field Guide

Heat Trap

Replicated by: Tom Fiddaman

Citation: Hatlebakk, Magnus, & Moxnes, Erling (1992). Misperceptions and Mismanagement of the Greenhouse Effect? The Simulation Model . Report # CMR-92-A30009, December). Christian Michelsen Research.

Units: no

Format: Vensim

This is a climate-economy model, of about the same scale and vintage as Nordhaus’ original DICE model. It’s more interesting in some respects, because it includes path-dependent reversible and irreversible emissions reductions. As I recall, the original also had some stochastic elements, not active here. This version has no units; hopefully I can get an improved version online at some point.

Heat trap (Vensim .vmf)

Sea Level Rise

Citations: Rahmstorf 2007, “A semi-empirical approach to projecting future sea level rise.” Science 315. Grinsted, Moore & Jevrejeva 2009. “Reconstructing sea level from paleo and projected temperatures 200 to 2100 AD.” Climate Dynamics [1]

Source: Replicated by Tom Fiddaman based on an earlier replication of Rahmstorf provided by John Sterman

Units balance: Yes

Format: Vensim; requires Model Reader or an advanced version

Notes: See discussion at metasd.

Files:

Grinsted_v3b‎ – first model; default calibration replicates Rahmstorf, and optimization is set up to adjust constant terms to fit Rahmstorf slope to data

Grinsted_v3c – second model; updated data and calibration, as in Part III

Grinsted_v3c-k2 – third model; set up for Kalman filtering, as in Part V

Dumb and Dumber

Not to be outdone by Utah, South Dakota has passed its own climate resolution.

They raise the ante – where Utah cherry-picked twelve years of data, South Dakotans are happy with only 8. Even better, their pattern matching heuristic violates bathtub dynamics:

WHEREAS, the earth has been cooling for the last eight years despite small increases in anthropogenic carbon dioxide

They have taken the skeptic claim, that there’s little warming in the tropical troposphere, and bumped it up a notch:

WHEREAS, there is no evidence of atmospheric warming in the troposphere where the majority of warming would be taking place

Nope, no trend here:

Satellite tropospheric temperature, RSS

Satellite tropospheric temperature (RSS, TLT)

Continue reading “Dumb and Dumber”

Legislating Science

The Utah House has declared that CO2 is harmless. The essence of the argument in HJR 12: temperature’s going down, climategate shows that scientists are nefarious twits, whose only interest is in riding the federal funding gravy train, and emissions controls hurt the poor. While it’s reassuring that global poverty is a big concern of Utah Republicans, the scientific observations are egregiously bad:

29 WHEREAS, global temperatures have been level and declining in some areas over the
30 past 12 years;
31 WHEREAS, the “hockey stick” global warming assertion has been discredited and
32 climate alarmists’ carbon dioxide-related global warming hypothesis is unable to account for
33 the current downturn in global temperatures;
34 WHEREAS, there is a statistically more direct correlation between twentieth century
35 temperature rise and Chlorofluorocarbons (CFCs) in the atmosphere than CO2;
36 WHEREAS, outlawed and largely phased out by 1978, in the year 2000 CFC’s began to
37 decline at approximately the same time as global temperatures began to decline;

49 WHEREAS, Earth’s climate is constantly changing with recent warming potentially an
50 indication of a return to more normal temperatures following a prolonged cooling period from
51 1250 to 1860 called the “Little Ice Age”;

The list cherry-picks skeptic arguments that rely on a few papers (if that), nearly all thoroughly discredited. There are so many things wrong here that it’s not worth the electrons to refute them one by one. The quality of their argument calls to mind to the 1897 attempt in Indiana to legislate that pi = 3.2. It’s sad that this resolution’s supporters are too scientifically illiterate to notice, or too dishonest to care. There are real uncertainties about climate; it would be nice to see a legislative body really grapple with the hard questions, rather than chasing red herrings.