Are We Slaves to Open Loop Theories?

The ongoing bailout/stimulus debate is decidedly Keynesian. Yet Keynes was a halfhearted Keynesian:

US Keynesianism, however, came to mean something different. It was applied to a fiscal revolution, licensing deficit finance to pull the economy out of depression. From the US budget of 1938, this challenged the idea of always balancing the budget, by stressing the need to boost effective demand by stimulating consumption.

None of this was close to what Keynes had said in his General Theory. His emphasis was on investment as the motor of the economy; but influential US Keynesians airily dismissed this as a peculiarity of Keynes. Likewise, his efforts to separate capital projects from ordinary budgets, balanced if possible, found few echoes in Washington, despite frequent mention of his name.

Should this surprise us? It does not appear to have disconcerted Keynes. ‘Practical men were often the slaves of some defunct economist,’ he wrote. By the end of the second world war, Lord Keynes of Tilton was no mere academic scribbler but a policymaker, in a debate dominated by second-hand versions of ideas he had put into circulation in a previous life. He was enough of a pragmatist, and opportunist, not to quibble. After dining with a group of Keynesian economists in Washington, in 1944, Keynes commented: ‘I was the only non-Keynesian there.’

FT.com, In the long run we are all dependent on Keynes

This got me wondering about the theoretical underpinnings of the stimulus prescription. Economists are talking in the language of the IS/LM model, marginal propensity to consume, multipliers for taxes vs. spending, and so forth. But these are all equilibrium shorthand for dynamic concepts. Surely the talk is founded on dynamic models that close loops between money, expectations and the real economy, and contain an operational representation of money creation and lending?

The trouble is, after a bit of sniffing around, I’m not seeing those models. On the jacket of Dynamic Macroeconomics, James Tobin wrote in 1997:

“Macrodynamics is a venerable and important tradition, which fifty or sixty years ago engaged the best minds of the economics profession: among them Frisch, Tinbergan, Harrod, Hicks, Samuelson, Goodwin. Recently it has been in danger of being swallowed up by rational expectations, moving equilibrium, and dynamic optimization. We can be grateful to the authors of this book for keeping alive the older tradition, while modernizing it in the light of recent developments in techniques of dynamic modeling.”
’”James Tobin, Sterling Professor of Economics Emeritus, Yale University

Is dynamic macroeconomics still moribund, supplanted by CGE models (irrelevant to the problem at hand) and black box econometric methods? Someone please point me to the stochastic behavioral disequilibrium nonlinear dynamic macroeconomics literature I’ve missed, so I can sleep tonight knowing that policy is informed by something more than comparative statics.

In the meantime, the most relevant models I’m aware of are in system dynamics, not economics. An interesting option (which you can read and run) is Nathan Forrester’s thesis, A Dynamic Synthesis of Basic Macroeconomic Theory (1982).

Forrester’s model combines Samuelson’s multiplier accelerator, Metzler’s inventory-adjustment model, Hicks’ IS/LM, and the aggregate-supply/aggregate-demand model into a 10th order continuous dynamic model. The model generates an endogenous business cycle (4-year period) as well as a longer (24-year) cycle. The business cycle arises from inventory and employment adjustment, while the long cycle involves multiplier-accelerator and capital stock adjustment mechanisms, involving final demand. Forrester used the model to test a variety of countercyclic economic policies, commonly recommended as antidotes for business cycle swings:

Results of the policy tests explain the apparent discrepancy between policy conclusions based on static and dynamic models. The static results are confirmed by the fact that countercyclic demand-management policies do stabilize the demand-driven [long] cycle. The dynamic results are confirmed by the fact that the same countercyclic policies destabilize the business cycle. (pg. 9)

It’s not clear to me what exactly this kind of counterintuitive behavior might imply for our current situation, but it seems like a bad time to inadvertently destabilize the business cycle through misapplication of simpler models.

It’s unclear to what extent the model applies to our current situation, because it doesn’t include budget constraints for agents, and thus doesn’t include explicit money and debt stocks. While there are reasonable justifications for omitting those features for “normal” conditions, I suspect that since the origin of our current troubles is a debt binge, those justifications don’t apply where we are now in the economy’s state space. If so, then the equilibrium conclusions of the IS/LM model and other simple constructs are even more likely to be wrong.

I presume that the feedback structure needed to get your arms around the problem properly is in Jay Forrester’s System Dynamics National Model, but unfortunately it’s not available for experimentation.

John Sterman’s model of The Energy Transition and the Economy (1981) does have money stocks and debt for households and other sectors. It doesn’t have an operational representation of bank reserves, and it monetizes the deficit, but if one were to repurpose the model a bit (by eliminating the depletion issue, among other things) it might provide an interesting compromise between the two Forrester models above.

I still have a hard time believing that macroeconomics hasn’t trodden some of this fertile ground since the 80s, so I hope someone can comment with a more informed perspective. However, until someone disabuses me of the notion, I have the gnawing suspicion that the models are broken and we’re flying blind. Sure hope there aren’t any mountains in this fog.

My Bathtub is Nonlinear

I’m working on raising my kids as systems thinkers. I’ve been meaning to share some of our adventures here for some time, so here’s a first installment, from quite a while back.

I decided to ignore the great online resources for system dynamics education and reinvent the wheel. But where to start? I wanted an exercise that included stocks and flows, accumulation, graph reading, estimation, and data collection, with as much excitement as could be had indoors. (It was 20 below outside, so fire and explosions weren’t an option).

We grabbed a sheet of graph paper, fat pens, a yardstick, and a stopwatch and headed for the bathtub. Step 1 (to sustain interest) was turn on the tap to fill the tub. While it filled, I drew time and depth axes on the graph paper and explained what we were trying to do. That involved explaining what a graph was for, and what locations on the axes meant (they were perhaps 5 and 6 and probably hadn’t seen a graph of behavior over time before).

When the tub was full, we made a few guesses about how long it might take to empty, then started the clock and opened the drain. Every ten or twenty seconds, we’d stop the timer, take a depth reading, and plot the result on our graph. After a few tries, the kids could place the points. About half way, we took a longer pause to discuss the trajectory so far. I proposed a few forecasts of how the second half of the tub might drain – slowing, speeding up, etc. Each of us took a guess about time-to-empty. Naturally my own guess was roughly consistent with exponential decay. Then we reopened the drain and collected data until the tub was dry.

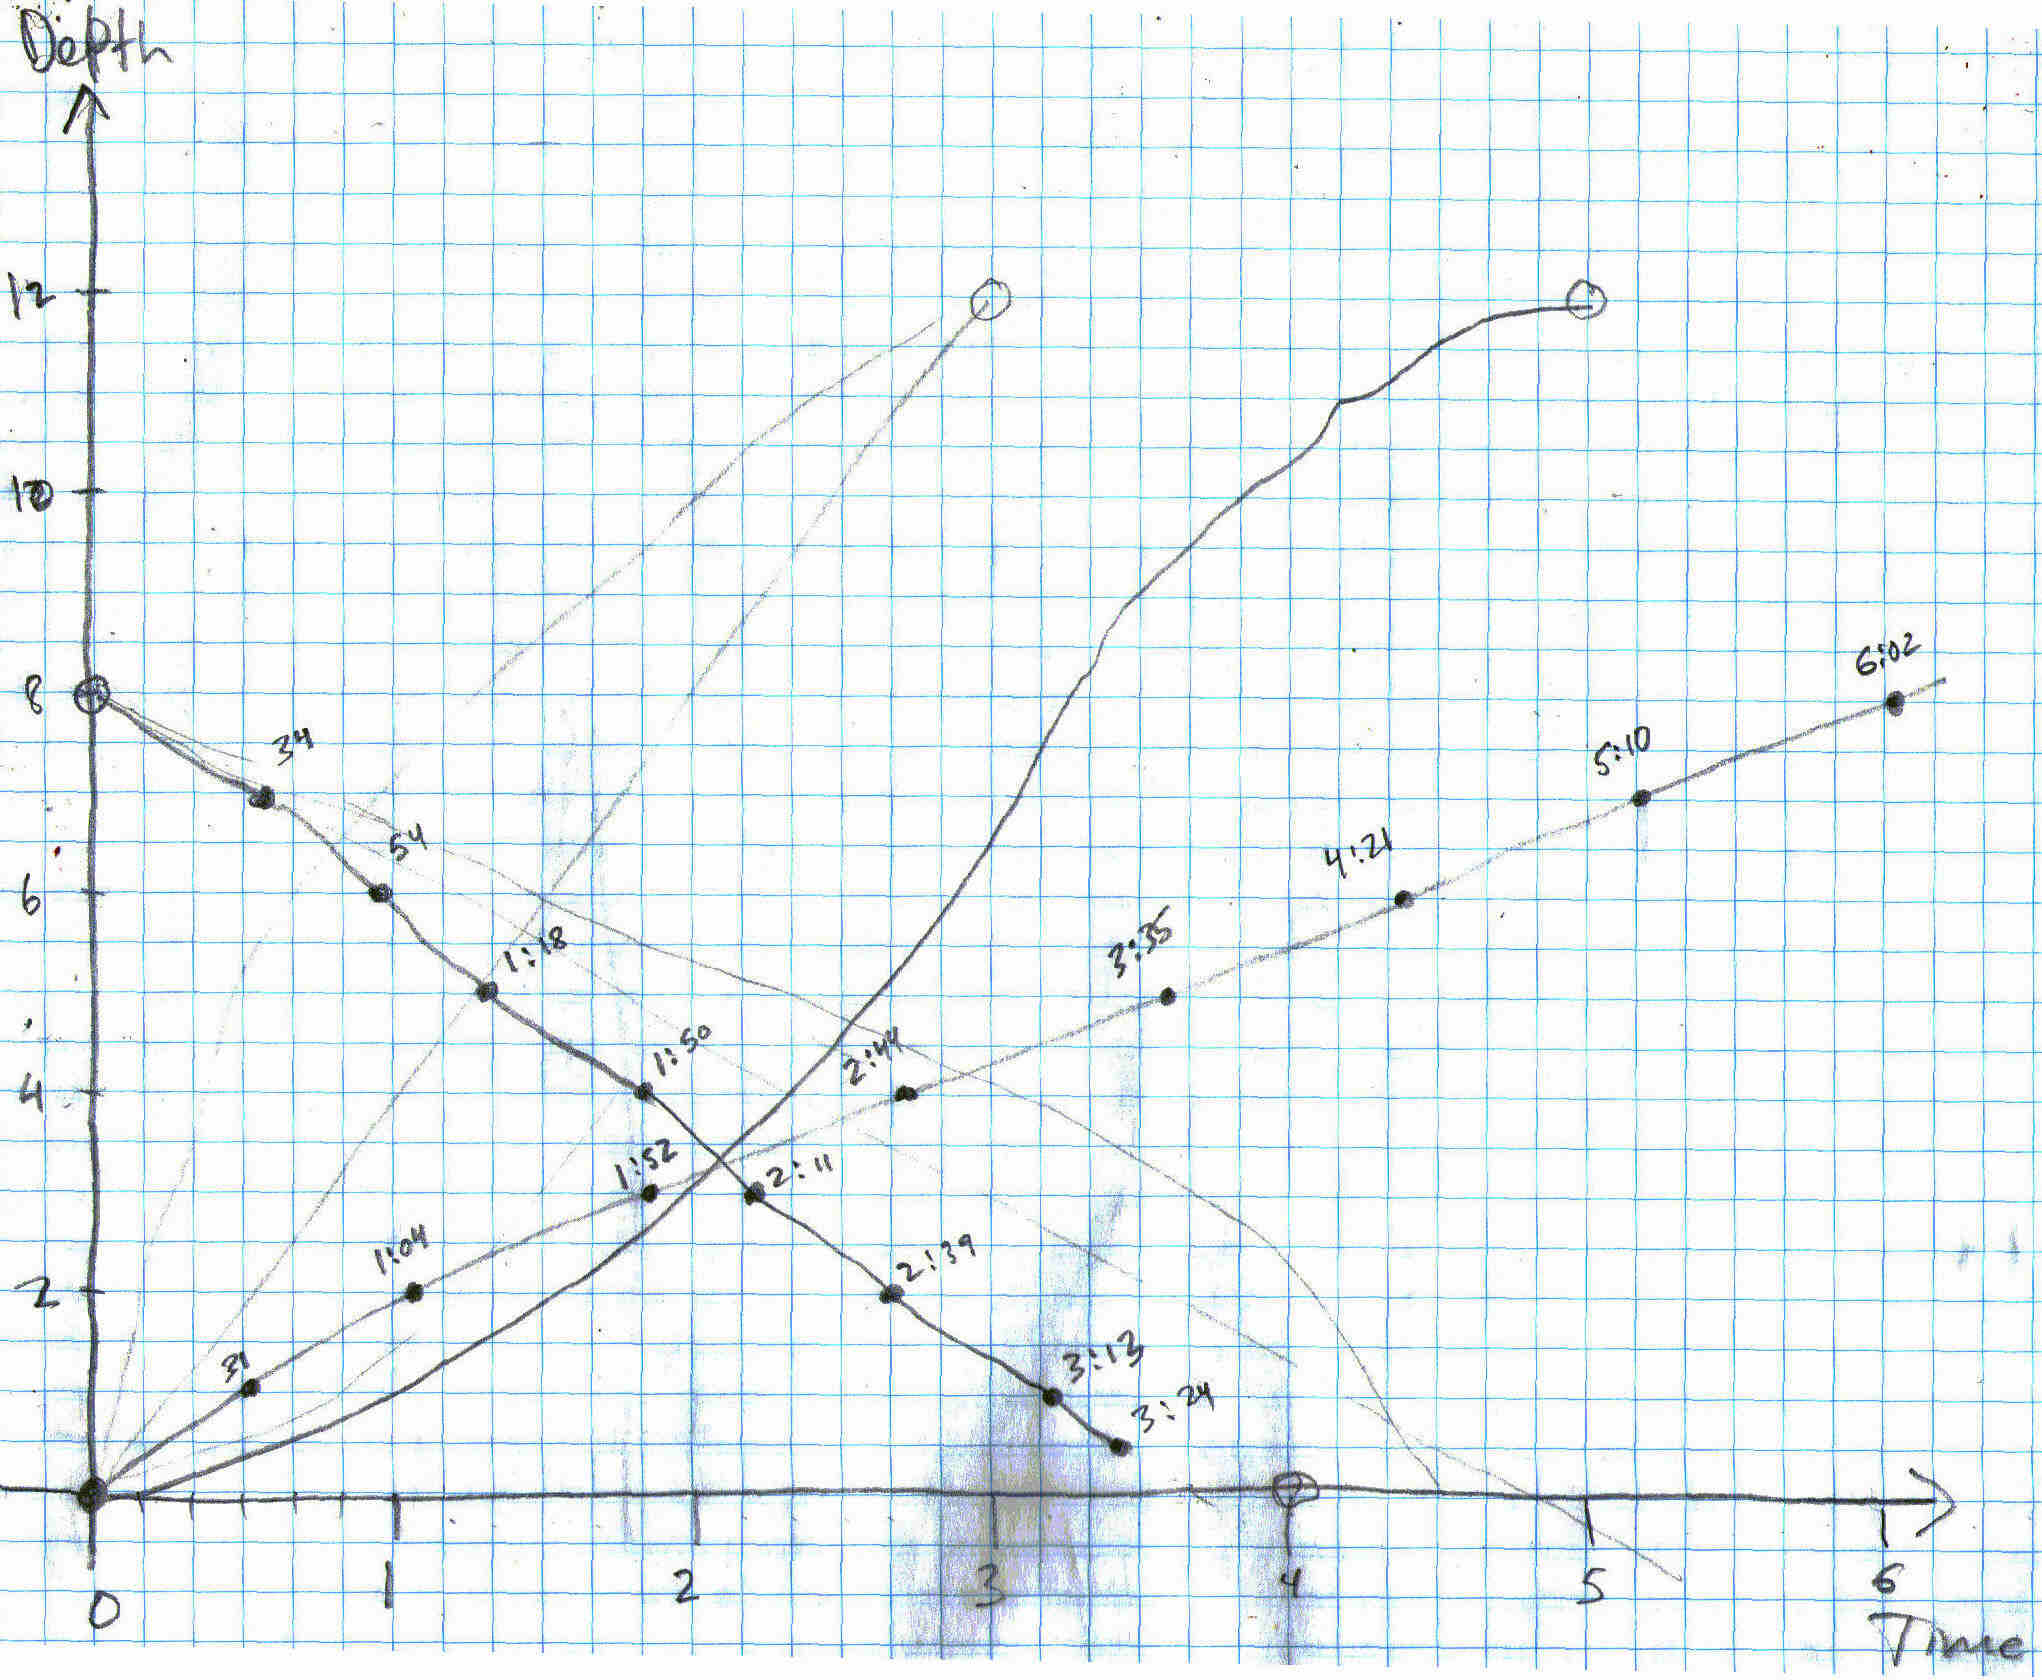
To my astonishment, the resulting plot showed a perfectly linear decline in water depth, all the way to zero (as best we could measure). In hindsight, it’s not all that strange, because the tub tapers at the bottom, so that a constant linear decline in the outflow rate corresponds with the declining volumetric flow rate you’d expect (from decreasing pressure at the outlet as the water gets shallower). Still, I find it rather amazing that the shape of the tub (and perhaps nonlinearity in the drain’s behavior) results in such a perfectly linear trajectory.

We spent a fair amount of time further exploring bathtub dynamics, with much filling and emptying. When the quantity of water on the floor got too alarming, we moved to the sink to explore equilibrium by trying to balance the tap inflow and drain outflow, which is surprisingly difficult.

We lost track of our original results, so we recently repeated the experiment. This time, we measured the filling as well as the draining, shown below on the same axes. The dotted lines are our data; others are our prior guesses. Again, there’s no sign of exponential draining – it’s a linear rush to the finish line. Filling – which you’d expect to be a perfect ramp if the tub had constant volume per depth – is initially fast, then slows slightly as the tapered bottom area is full. However, that effect doesn’t seem to be big enough to explain the outflow behavior.

Bathtub data

I’ve just realized that I have a straight-sided horse trough lying about, so I think we may need to head outside for another test …

Update: the follow-on to this is rather important.

Tangible Models

MIT researchers have developed a cool digital drawing board that simulates the physics of simple systems:

You can play with something like this with Crayon Physics or Magic Pen. Digital physics works because the laws involved are fairly simple, though the math behind one of these simulations might appear daunting. More importantly, they are well understood and universally agreed upon (except perhaps among perpetual motion advocates).

I’d like to have the equivalent of the digital drawing board for the public policy and business strategy space: a fluid, intuitive tool that translates assumptions into realistic consequences. The challenge is that there is no general agreement on the rules by which organizations and societies work. Frequently there is not even a clear problem statement and common definition of important variables.

However, in most domains, it is possible to identify and simulate the “physics” of a social system in a useful way. The task is particularly straightforward in cases where the social system is managing an underlying physical system that obeys predictable laws (e.g., if there’s no soup on the shelf, you can’t sell any soup). Jim Hines and MIT Media Lab researchers translated that opportunity into a digital whiteboard for supply chains, using a TUI (tangible user interface). Here’s a demonstration:

There are actually two innovations here. First, the structure of a supply chain has been reduced to a set of abstractions (inventories, connections via shipment and order flows, etc.) that make it possible to assemble one tinker-toy style using simple objects on the board. These abstractions eliminate some of the grunt work of specifying the structure of a system, enabling what Jim calls “modeling at conversation speed”. Second, assumptions, like the target stock or inventory coverage at a node in the supply chain, are tied to controls (wheels) that allow the user to vary them and see the consequences in real time (as with Vensim’s Synthesim). Getting the simulation off a single computer screen and into a tangible work environment opens up great opportunities for collaborative exploration and design of systems. Cool.

Next step: create tangible, shareable, fast tools for uncertain dynamic tasks like managing the social security trust fund or climate policy.

On Limits to Growth

It’s a good idea to read things you criticize; checking your sources doesn’t hurt either. One of the most frequent targets of uninformed criticism, passed down from teacher to student with nary a reference to the actual text, must be The Limits to Growth. In writing my recent review of Green & Armstrong (2007), I ran across this tidbit:

Complex models (those involving nonlinearities and interactions) harm accuracy because their errors multiply. Ascher (1978), refers to the Club of Rome’s 1972 forecasts where, unaware of the research on forecasting, the developers proudly proclaimed, “in our model about 100,000 relationships are stored in the computer.” (page 999)

Setting aside the erroneous attributions about complexity, I found the statement that the MIT world models contained 100,000 relationships surprising, as both can be diagrammed on a single large page. I looked up electronic copies of World Dynamics and World3, which have 123 and 373 equations respectively. A third or more of those are inconsequential coefficients or switches for policy experiments. So how did Ascher, or Ascher’s source, get to 100,000? Perhaps by multiplying by the number of time steps over the 200 year simulation period – hardly a relevant measure of complexity.

Meadows et al. tried to steer the reader away from focusing on point forecasts. The introduction to the simulation results reads,

Each of these variables is plotted on a different vertical scale. We have deliberately omitted the vertical scales and we have made the horizontal time scale somewhat vague because we want to emphasize the general behavior modes of these computer outputs, not the numerical values, which are only approximately known. (page 123)

Many critics have blithely ignored such admonitions, and other comments to the effect of, “this is a choice, not a forecast” or “more study is needed.” Often, critics don’t even refer to the World3 runs, which are inconvenient in that none reaches overshoot in the 20th century, making it hard to establish that “LTG predicted the end of the world in year XXXX, and it didn’t happen.” Instead, critics choose the year XXXX from a table of resource lifetime indices in the chapter on nonrenewable resources (page 56), which were not forecasts at all. Continue reading “On Limits to Growth”

The blank sheet of paper

I’ve been stymied for some time over how to start this blog. Finally (thanks to my wife) I’ve realized that it’s really the same problem as conceptualizing a model, with the same solution.

Beginning modelers frequently face a blank sheet of paper with trepidation … where to begin? There’s lots of good advice that I should probably link here. Instead I’ll just observe that there’s really no good answer … you just have to start. The key is to remember that modeling is highly iterative. It’s OK if the first 10 attempts are bad; their purpose is not to achieve perfection. Colleagues and I are currently working on a model that is in version 99, and still full of challenges. The purpose of those first few rounds is to explore the problem space and capture as much of the “mess” as possible. As long as the modeling process exposes the work-in-progress to lots of user feedback and reality checks, and captures insight along the way, there’s nothing to worry about.