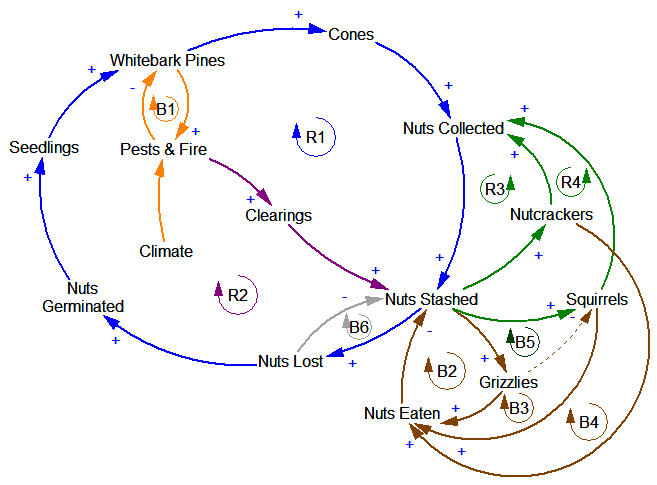
I spent a little time working out what Clark’s Causal Calamity might look like as a well-formed causal loop diagram. Here’s an attempt, based on little more than spending a lot of time wandering around the Greater Yellowstone ecosystem:
The basic challenge is that there isn’t a single cycle that encompasses the whole system. Grizzlies, for example, are not involved in the central loop of pine-cone-seedling dispersal and growth (R1). They are to some extent free riders on the system – they raid squirrel middens and eat a lot of nuts, which can’t be good for the squirrels (dashed line, loop B5).
There are also a lot of “nuisance” loops that are essential for robustness of the real system, but aren’t really central to the basic point about ecosystem interconnectedness. B6 is one example – you get such a negative loop every time you have an outflow from a stock (more stuff in the stock -> faster outflow -> less stuff in the stock). R2 is another – the development of clearings from pines via fire and pests is offset by the destruction of pines via the same process.
I suspect that this CLD is still dramatically underspecified and erroneous, compared to the simplest stock-flow model that could encompass these concepts. It would also make a lousy poster for grocery store consumption.

