Complexity should be the default assumption

Whether or not we can prove that a system experiences trophic cascades and other nonlinear side-effects, we should manage as if it does, because we know that these dynamics are common.

There’s been a long-running debate over whether wolf reintroduction led to a trophic cascade in Yellowstone. There’s a nice summary here:

Do Wolves Change Rivers?

Yesterday, June initiated an in depth discussion on the benefit of wolves in Yellowstone, in the form of trophic cascade with the video: How Wolves Change the River:

This was predicted by some, and has been studied by William Ripple, Robert Beschta Trophic Cascades in Yellowstone: The first fifteen years after wolf reintroduction http://www.cof.orst.edu/leopold/papers/RippleBeschtaYellowstone_BioConserv.pdf

Shannon, Roger, and Mike, voiced caution that the verdict was still out.

I would like to caution that many of the reported “positive” impacts wolves have had on the environment after coming back to Yellowstone remain unproven or are at least controversial. This is still a hotly debated topic in science but in the popular media the idea that wolves can create a Utopian environment all too often appears to be readily accepted. If anyone is interested, I think Dave Mech wrote a very interesting article about this (attached). As he puts it “the wolf is neither a saint nor a sinner except to those who want to make it so”.

Mech: Is Science in Danger of Sanctifying Wolves

Roger added

I see 2 points of caution regarding reports of wolves having “positive” impacts in Yellowstone. One is that understanding cause and effect is always hard, nigh onto impossible, when faced with changes that occur in one place at one time. We know that conditions along rivers and streams have changed in Yellowstone but how much “cause” can be attributed to wolves is impossible to determine.

Perhaps even more important is that evaluations of whether changes are “positive” or “negative” are completely human value judgements and have no basis in science, in this case in the science of ecology.

-Ely Field Naturalists

Of course, in a forum discussion, this becomes:

Wolves changed rivers.

Not they didn’t.

Yes they did.

(iterate ad nauseam)

Prove it.

… with “prove it” roughly understood to mean establishing that river = a + b*wolves, rejecting the null hypothesis that b=0 at some level of statistical significance.

I would submit that this is a poor framing of the problem. Given what we know about nonlinear dynamics in  networks like an ecosystem, it’s almost inconceivable that there would not be trophic cascades. Moreover, it’s well known that simple correlation would not be able to detect such cascades in many cases anyway.

A “no effect” default in other situations seems equally naive. Is it really plausible that a disturbance to a project would not have any knock-on effects? That stressing a person’s endocrine system would not cause a path-dependent response? I don’t think so. Somehow we need ordinary conversations to employ more sophisticated notions about models and evidence in complex systems. I think at least two ideas are useful:

  • The idea that macro behavior emerges from micro structure. The appropriate level of description of an ecosystem, or a project, is not a few time series for key populations, but an operational, physical description of how species reproduce and interact with one another, or how tasks get done.
  • A Bayesian approach to model selection, in which our belief in a particular representation of a system is proportional to the degree to which it explains the evidence, relative to various alternative formulations, not just a naive null hypothesis.

In both cases, it’s important to recognize that the formal, numerical data is not the only data applicable to the system. It’s also crucial to respect conservation laws, units of measure, extreme conditions tests and other Reality Checks that essentially constitute free data points in parts of the parameter space that are otherwise unexplored.

The way we think and talk about these systems guides the way we act. Whether or not we can prove in specific instances that Yellowstone had a trophic cascade, or the Chunnel project had unintended consequences, we need to manage these systems as if they could. Complexity needs to be the default assumption.

Coupled Catastrophes

I ran across this cool article on network dynamics, and thought the model would be an interesting application for Ventity:

Coupled catastrophes: sudden shifts cascade and hop among interdependent systems

Charles D. Brummitt, George Barnett and Raissa M. D’Souza

Abstract

An important challenge in several disciplines is to understand how sudden changes can propagate among coupled systems. Examples include the synchronization of business cycles, population collapse in patchy ecosystems, markets shifting to a new technology platform, collapses in prices and in confidence in financial markets, and protests erupting in multiple countries. A number of mathematical models of these phenomena have multiple equilibria separated by saddle-node bifurcations. We study this behaviour in its normal form as fast–slow ordinary differential equations. In our model, a system consists of multiple subsystems, such as countries in the global economy or patches of an ecosystem. Each subsystem is described by a scalar quantity, such as economic output or population, that undergoes sudden changes via saddle-node bifurcations. The subsystems are coupled via their scalar quantity (e.g. trade couples economic output; diffusion couples populations); that coupling moves the locations of their bifurcations. The model demonstrates two ways in which sudden changes can propagate: they can cascade (one causing the next), or they can hop over subsystems. The latter is absent from classic models of cascades. For an application, we study the Arab Spring protests. After connecting the model to sociological theories that have bistability, we use socioeconomic data to estimate relative proximities to tipping points and Facebook data to estimate couplings among countries. We find that although protests tend to spread locally, they also seem to ‘hop’ over countries, like in the stylized model; this result highlights a new class of temporal motifs in longitudinal network datasets.

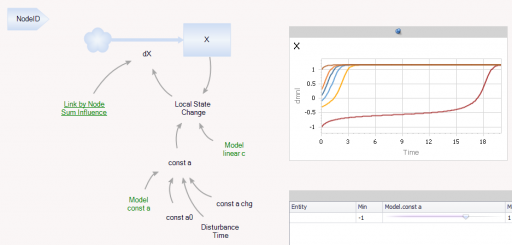
Ventity makes sense here because the system consists of a network of coupled states. Ventity makes it easy to represent a wide variety of network architectures. This means there are two types of entities in the system: “Nodes” and “Couplings.”

The Node entitytype contains a single state (X), with local feedback, as well as a remote influence from Coupling and a few global parameters referenced from the Model entity:

Continue reading “Coupled Catastrophes”

Is social networking making us dumber?

Another great conversation at the Edge weaves together a number of themes I’ve been thinking about lately, like scientific revolutions, big data, learning from models, filter bubbles and the balance between content creation and consumption. I can’t embed, or do it full justice, so go watch the video or read the transcript (the latter is a nice rarity these days).

Pagel’s fundamental hypothesis is humans as social animals are wired for imitation more than innovation, for the very good reason that imitation is easy, while innovation is hard, error-prone and sometimes dangerous. Better communication intensifies the advantage to imitators, as it has become incredibly cheap to observe our fellows in large networks like Facebook. There are a variety of implications of this, including the possibility that, more than ever, large companies have strong incentives to imitate through acquisition of small innovators rather than to risk innovating themselves. This resonates very much with Ventana colleague David Peterson’s work on evolutionary simulation of the origins of economic growth and creativity.

Continue reading “Is social networking making us dumber?”

Time to short some social network stocks?

I don’t want to wallow too long in metaphors, so here’s something with a few equations.

A recent arXiv paper by Peter Cauwels and Didier Sornette examines market projections for Facebook and Groupon, and concludes that they’re wildly overvalued.

We present a novel methodology to determine the fundamental value of firms in the social-networking sector based on two ingredients: (i) revenues and profits are inherently linked to its user basis through a direct channel that has no equivalent in other sectors; (ii) the growth of the number of users can be calibrated with standard logistic growth models and allows for reliable extrapolations of the size of the business at long time horizons. We illustrate the methodology with a detailed analysis of facebook, one of the biggest of the social-media giants. There is a clear signature of a change of regime that occurred in 2010 on the growth of the number of users, from a pure exponential behavior (a paradigm for unlimited growth) to a logistic function with asymptotic plateau (a paradigm for growth in competition). […] According to our methodology, this would imply that facebook would need to increase its profit per user before the IPO by a factor of 3 to 6 in the base case scenario, 2.5 to 5 in the high growth scenario and 1.5 to 3 in the extreme growth scenario in order to meet the current, widespread, high expectations. […]

I’d argue that the basic approach, fitting a logistic to the customer base growth trajectory and multiplying by expected revenue per customer, is actually pretty ancient by modeling standards. (Most system dynamicists will be familiar with corporate growth models based on the mathematically-equivalent Bass diffusion model, for example.) So the surprise for me here is not the method, but that forecasters aren’t using it.

Looking around at some forecasts, it’s hard to say what forecasters are actually doing. There’s lots of handwaving and blather about multipliers, and little revelation of actual assumptions (unlike the paper). It appears to me that a lot of forecasters are counting on big growth in revenue per user, and not really thinking deeply about the user population at all.

To satisfy my curiosity, I grabbed the data out of Cauwels & Sornette, updated it with the latest user count and revenue projection, and repeated the logistic model analysis. A few observations:

I used a generalized logistic, which has one more parameter, capturing possible nonlinearity in the decline of the growth rate of users with increasing saturation of the market. Here’s the core model:

Continue reading “Time to short some social network stocks?”

Social network valuation with logistic models

This is a logistic growth model for Facebook’s user base, with a very simple financial projection attached. It’s inspired by:

Quis pendit ipsa pretia: facebook valuation and diagnostic of a bubble based on nonlinear demographic dynamics

Peter Cauwels, Didier Sornette

We present a novel methodology to determine the fundamental value of firms in the social-networking sector based on two ingredients: (i) revenues and profits are inherently linked to its user basis through a direct channel that has no equivalent in other sectors; (ii) the growth of the number of users can be calibrated with standard logistic growth models and allows for reliable extrapolations of the size of the business at long time horizons. We illustrate the methodology with a detailed analysis of facebook, one of the biggest of the social-media giants. There is a clear signature of a change of regime that occurred in 2010 on the growth of the number of users, from a pure exponential behavior (a paradigm for unlimited growth) to a logistic function with asymptotic plateau (a paradigm for growth in competition). We consider three different scenarios, a base case, a high growth and an extreme growth scenario. Using a discount factor of 5%, a profit margin of 29% and 3.5 USD of revenues per user per year yields a value of facebook of 15.3 billion USD in the base case scenario, 20.2 billion USD in the high growth scenario and 32.9 billion USD in the extreme growth scenario. According to our methodology, this would imply that facebook would need to increase its profit per user before the IPO by a factor of 3 to 6 in the base case scenario, 2.5 to 5 in the high growth scenario and 1.5 to 3 in the extreme growth scenario in order to meet the current, widespread, high expectations. …

(via the arXiv blog)

This is not an exact replication of the model (though you can plug in the parameters from C&S’ paper to replicate their results). I used slightly different estimation methods, a generalization of the logistic (for saturation exponent <> 1), and variable revenues and interest rates in the projections (also optional).

This is a good illustration of how calibration payoffs work. The payoff in this model is actually a policy payoff, because the weighted sum-squared-error is calculated explicitly in the model. That makes it possible to generate Monte Carlo samples and filter them by SSE, and also makes it easier to estimate the scale and variation in the standard error of user base reports.

The model is connected to input data in a spreadsheet. Most is drawn from the paper, but I updated users and revenues with the latest estimates I could find.

A command script replicates optimization runs that fit the model to data for various values of the user carrying capacity K.

Note that there are two views, one for users, and one for financial projections.

See my accompanying blog post for some reflections on the outcome.

This model requires Vensim DSS, Pro, or the Model Reader. facebook 3.vpm or facebook3.zip (The .zip is probably easier if you have DSS or Pro and want to work with the supplementary control files.)

Update: I’ve added another set of models for Groupon: groupon 1.vpmgroupon 2.vpm and groupon.zip groupon3.zip

See my latest blog post for details.


Is London a big whale?

Why do cities survive atom bombs, while companies routinely go belly up?

Geoffrey West on The Surprising Math of Cities and Corporations:

There’s another interesting video with West in the conversations at Edge.

West looks at the metabolism of cities, and observes scale-free behavior of good stuff (income, innovation, input efficiency) as well as bad stuff (crime, disease – products of entropy). The destiny of cities, like companies, is collapse, except to the extent that they can innovate at an accelerating rate. Better hope the Singularity is on schedule.

Thanks to whoever it was at the SD conference who pointed this out!

There's more than one way to aggregate cats

After getting past the provocative title, Robert Axtell’s presentation on the pitfalls of aggregation proved to be very interesting. The slides are posted here:

http://winforms.chapter.informs.org/presentation/Pathologies_of_System_Dynamics_Models-Axtell-20101021.pdf

A comment on my last post on this summed things up pretty well:

… the presentation really focused on the challenges that aggregation brings to the modeling disciplines. Axtell presents some interesting mathematical constructs that could and should form the basis for conversations, thinking, and research in the SD and other aggregate modeling arenas.

It’s worth a look.

Also, as I linked before, check out Hazhir Rahmandad’s work on agent vs. aggregate models of an infection process. His models and articles with John Sterman are here. His thesis is here.

Hazhir’s work explores two extremes – an aggregate model of infection (which is the analog of typical Bass diffusion models in marketing science) compared to agent based versions of the same process. The key difference is that the aggregate model assumes well-mixed victims, while the agent versions explicitly model contacts across various network topologies. The well-mixed assumption is often unrealistic, because it matters who is infected, not just how many. In the real world, the gain of an infection process can vary with the depth of penetration of the social network, and only the agent model can capture this in all circumstances.

However, in modeling there’s often a middle road: an aggregation approach that captures the essence of a granular process at a higher level. That’s fortunate, because otherwise we’d always be building model-maps as big as the territory. I just ran across an interesting example.

A new article in PLoS Computational Biology models obesity as a social process:

Many behavioral phenomena have been found to spread interpersonally through social networks, in a manner similar to infectious diseases. An important difference between social contagion and traditional infectious diseases, however, is that behavioral phenomena can be acquired by non-social mechanisms as well as through social transmission. We introduce a novel theoretical framework for studying these phenomena (the SISa model) by adapting a classic disease model to include the possibility for ‘automatic’ (or ‘spontaneous’) non-social infection. We provide an example of the use of this framework by examining the spread of obesity in the Framingham Heart Study Network. … We find that since the 1970s, the rate of recovery from obesity has remained relatively constant, while the rates of both spontaneous infection and transmission have steadily increased over time. This suggests that the obesity epidemic may be driven by increasing rates of becoming obese, both spontaneously and transmissively, rather than by decreasing rates of losing weight. A key feature of the SISa model is its ability to characterize the relative importance of social transmission by quantitatively comparing rates of spontaneous versus contagious infection. It provides a theoretical framework for studying the interpersonal spread of any state that may also arise spontaneously, such as emotions, behaviors, health states, ideas or diseases with reservoirs.

The very idea of modeling obesity as an infectious social process is interesting in itself. But from a technical standpoint, the interesting innovation is that they capture some of the flavor of a disaggregate representation of the population by introducing an approximation, Continue reading “There's more than one way to aggregate cats”