
I’ve been doing a lot of screencasts of demo models and how-tos. They’re in the Vensim and Ventity libraries. Here are the latest:
Author: Tom
Kenneth Arrow
The NY Times has a terrific obituary of economist Kenneth Arrow, who died yesterday at age 95. It’s a great read, from the discussion of the Impossibility Theorem and General Equilibrium to the personal anecdote at the end.
Job tenure dynamics
This is a simple model of the dynamics of employment in a sector. I built it for a LinkedIn article that describes the situation and the data.
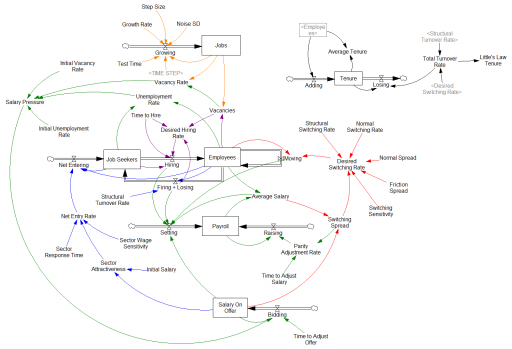
The model is interesting and reasonably robust, but it has (at least) three issues you should know about:
- The initialization in equilibrium isn’t quite perfect.
- The sector-entry decision (Net Entering) is not robust to low unemployment. In some situations, a negative net entering flow could cause negative Job Seekers.
- The sector-entry decision also formulates attractiveness exclusively as a function of salaries; in fact, it should also account for job availability (perceived vacancy and unemployment rates).
Correcting these shortcomings shouldn’t be too hard, and it should make the model’s oscillatory tendencies more realistic. I leave this as an exercise for you. Drop me a note if you have an improved version.
The model requires Vensim (any version, including free PLE).
Download employees1.mdl
Snow is Normal in Montana
In this case, I think it’s quite literally Normal a.k.a. Gaussian:

Here’s what I think is happening. On windless days with powder, the snow dribbles off the edge of the roof (just above the center of the hump). Flakes drift down in a random walk. The railing terminates the walk after about four feet, by which time the distribution of flake positions has already reached the Normal you’d expect from the Central Limit Theorem.
Enough of the geek stuff; I think I’ll go ski the field.
Forrester on Continuous Flows
I just published three short videos with sample models, illustrating representation of discrete and random events in Vensim.
Jay Forrester‘s advice from Industrial Dynamics is still highly relevant. Here’s an excerpt:
Chapter 5, Principles for Formulating Models
5.5 Continuous Flows
In formulating a model of an industrial operation, we suggest that the system be treated, at least initially, on the basis of continuous flows and interactions of the variables. Discreteness of events is entirely compatible with the concept of information-feedback systems, but we must be on guard against unnecessarily cluttering our formulation with the detail of discrete events that only obscure the momentum and continuity exhibited by our industrial systems.
In beginning, decisions should be formulated in the model as if they were continuously (but not implying instantaneously) responsive to the factors on which they are based. This means that decisions will not be formulated for intermittent reconsideration each week, month or year. For example, factory production capacity would vary continuously, not by discrete additions. Ordering would go on continuously, not monthly when the stock records are reviewed.
There are several reasons for recommending the initial formulation of a continuous model:
- Real systems are more nearly continuous than is commonly supposed …
- There will usually be considerable “aggregation” …
- A continuous-flow system is usually an effective first approximation …
- There is a natural tendency of model builders and executives to overstress the discontinuities of real situations. …
- A continuous-flow model helps to concentrate attention on the central framework of the system. …
- As a starting point, the dynamics of the continuous-flow model are usually easier to understand …
- A discontinuous model, which is evaluated at infrequent intervals, such as an economic model solved for a new set of values annually, should never be justified by the fact that data in the real system have been collected at such infrequent intervals. …
These comments should never be construed as suggesting that the model builder should lack interest in the microscopic separate events that occur in a continuous-flow channel. The course of the continuous flow is the course of the separate events in it. By studying individual events we get a picture of how decisions are made and how the flows are delayed. The study of individual events is on of our richest sources of information about the way the flow channels of the model should be constructed. When a decision is actually being made regularly on a periodic basis, like once a month, the continuous-flow equivalent channel should contain a delay of half the interval; this represents the average delay encountered by information in the channel.
The preceding comments do not imply that discreteness is difficult to represent, nor that it should forever be excluded from a model. At times it will become significant. For example, it may create a disturbance that will cause system fluctuations that can be mistakenly interreted as externally generated cycles (…). When a model has progressed to the point where such refinements are justified, and there is reason to believe that discreteness has a significant influence on system behavior, discontinuous variables should then be explored to determine their effect on the model.
[Ellipses added – see the original for elaboration.]
A conversation about infrastructure
A conversation about infrastructure, with Carter Williams of iSelect and me:
The $3 Trillion Problem: Solving America’s Infrastructure Crisis
I can’t believe I forgot to mention one of the most obvious System Dynamics insights about infrastructure:
There are two ways to fill a leaky bucket – increase the inflow, or plug the outflows. There’s always lots of enthusiasm for increasing the inflow by building new stuff. But there’s little sense in adding to the infrastructure stock if you can’t maintain what you have. So, plug the leaks first, and get into a proactive maintenance mode. Then you can have fun building new things – if you can afford it.
Rats leaving a sinking Sears
Sears Roebuck & Co. was a big part of my extended family at one time. My wife’s grandfather started in the mail room and worked his way up to executive, through the introduction of computers and the firebombing in Caracas. Sadly, its demise appears imminent.
Business Insider has an interesting article on the dynamics of Sears’ decline. Here’s a quick causal loop diagram summarizing some of the many positive feedbacks that once drove growth, but now are vicious cycles:
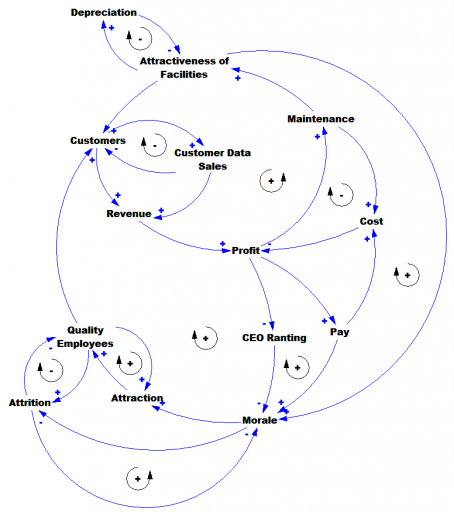
h/t @johnrodat
CLD corrected, 1/9/17.
Privatizing Public Lands – Claim your 0.3 acres now!
BLM Public Lands Statistics show that the federal government holds about 643 million acres – about 2 acres for each person.
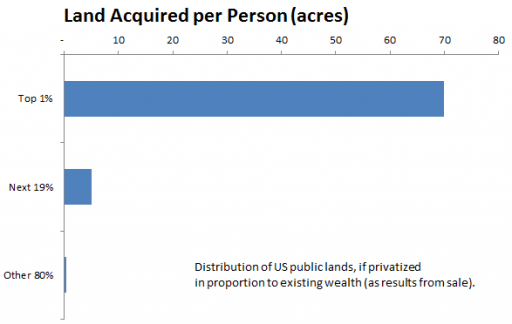
But what would you really get if these lands were transferred to the states and privatized by sale? Asset sales would distribute land roughly according to the existing distribution of wealth. Here’s how that would look:
The Forbes 400 has a net worth of $2.4 trillion, not quite 3% of US household net worth. If you’re one of those lucky few, your cut would be about 44,000 acres, or 69 square miles.
Bill Gates, Jeff Bezos, Warren Buffet, Mark Zuckerberg and Larry Ellison alone could split Yellowstone National Park (over 2 million acres).
The top 1% wealthiest Americans (35% of net worth) would average 70 acres each, and the next 19% (51% of net worth) would get a little over 5 acres.
The other 80% of America would split the remaining 14% of the land. That’s about a third of an acre each, which would be a good-sized suburban lot, if it weren’t in the middle of Nevada or Alaska.
You can’t even see the average person’s share on a graph, unless you use a logarithmic scale:

Otherwise, the result just looks ridiculous, even if you ignore the outliers:
Remembering Jay Forrester
I’m sad to report that Jay Forrester, pioneer in servo control, digital computing, System Dynamics, global modeling, and education has passed away at the age of 98.

I’ve only begun to think about the ways Jay influenced my life, but digging through the archives here I ran across a nice short video clip on Jay’s hope for the future. Jay sounds as prescient as ever, given recent events:
“The coming century, I think, will be dominated by major social, political turmoil. And it will result primarily because people are doing what they think they should do, but do not realize that what they’re doing are causing these problems. So, I think the hope for this coming century is to develop a sufficiently large percentage of the population that have true insight into the nature of the complex systems within which they live.”
I delve into the roots of this thought in Election Reflection (2010).
Here’s a sampling of other Forrester ideas from these pages:
Models
Dynamics of Term Limits
I am a little encouraged to see that the very top item on Trump’s first 100 day todo list is term limits:
* FIRST, propose a Constitutional Amendment to impose term limits on all members of Congress;
Certainly the defects in our electoral and campaign finance system are among the most urgent issues we face.
Assuming other Republicans could be brought on board (which sounds unlikely), would term limits help? I didn’t have a good feel for the implications, so I built a model to clarify my thinking.
I used our new tool, Ventity, because I thought I might want to extend this to multiple voting districts, and because it makes it easy to run several scenarios with one click.
Here’s the setup:
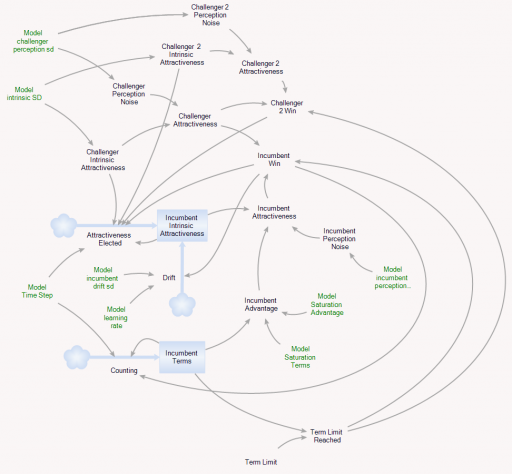
The model runs over a long series of 4000 election cycles. I could just as easily run 40 experiments of 100 cycles or some other combination that yielded a similar sample size, because the behavior is ergodic on any time scale that’s substantially longer than the maximum number of terms typically served.
Each election pits two politicians against one another. Normally, an incumbent faces a challenger. But if the incumbent is term-limited, two challengers face each other.
The electorate assesses the opponents and picks a winner. For challengers, there are two components to voters’ assessment of attractiveness:
- Intrinsic performance: how well the politician will actually represent voter interests. (This is a tricky concept, because voters may want things that aren’t really in their own best interest.) The model generates challengers with random intrinsic attractiveness, with a standard deviation of 10%.
- Noise: random disturbances that confuse voter perceptions of true performance, also with a standard deviation of 10% (i.e. it’s hard to tell who’s really good).
Once elected, incumbents have some additional features:
- The assessment of attractiveness is influenced by an additional term, representing incumbents’ advantages in electability that arise from things that have no intrinsic benefit to voters. For example, incumbents can more easily attract funding and press.
- Incumbent intrinsic attractiveness can drift. The drift has a random component (i.e. a random walk), with a standard deviation of 5% per term, reflecting changing demographics, technology, etc. There’s also a deterministic drift, which can either be positive (politicians learn to perform better with experience) or negative (power corrupts, or politicians lose touch with voters), defaulting to zero.
- The random variation influencing voter perceptions is smaller (5%) because it’s easier to observe what incumbents actually do.
There’s always a term limit of some duration active, reflecting life expectancy, but the term limit can be made much shorter.
Here’s how it behaves with a 5-term limit:
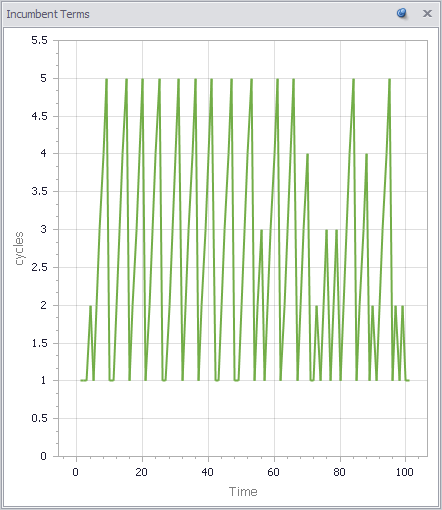
Politicians frequently serve out their 5-term limit, but occasionally are ousted early. Over that period, their intrinsic performance varies a lot:
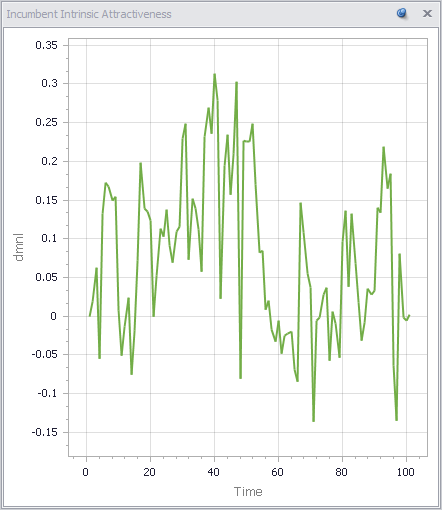
Since the mean challenger has 0 intrinsic attractiveness, politicians outperform the average frequently, but far from universally. Underperforming politicians are often reelected.
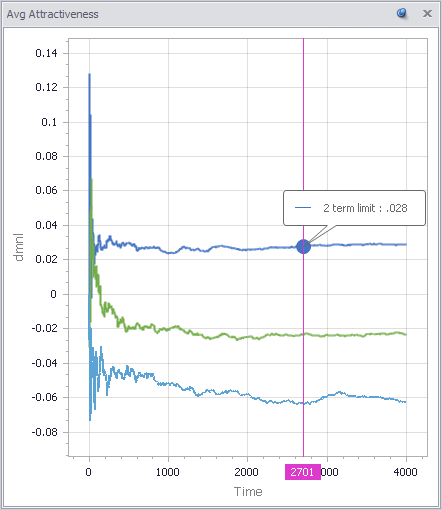
Over a long time horizon (or similarly, many districts), you can see how average performance varies with term limits:
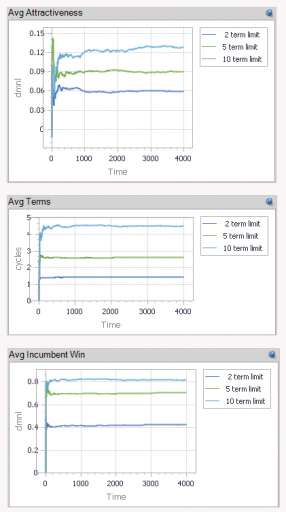
With no learning, as above, term limits degrade performance a lot (top panel). With a 2-term limit, the margin above random selection is about 6%, whereas it’s twice as great (>12%) with a 10-term limit. This is interesting, because it means that the retention of high-performing politicians improves performance a lot, even if politicians learn nothing from experience.
This advantage holds (but shrinks) even if you double the perception noise in the selection process. So, what does it take to justify term limits? In my experiments so far, politician performance has to degrade with experience (negative learning, corruption or losing touch). Breakeven (2-term limits perform the same as 10-term limits) occurs at -3% to -4% performance change per term.
But in such cases, it’s not really the term limits that are doing the work. When politician performance degrades rapidly with time, voters throw them out. Noise may delay the inevitable, but in my scenario, the average politician serves only 3 terms out of a limit of 10. Reducing the term limit to 1 or 2 does relatively little to change performance.
Upon reflection, I think the model is missing a key feature: winner-takes-all, redistricting and party rules that create safe havens for incompetent incumbents. In a district that’s split 50-50 between brown and yellow, an incompetent brown is easily displaced by a yellow challenger (or vice versa). But if the split is lopsided, it would be rare for a competent yellow challenger to emerge to replace the incompetent yellow incumbent. In such cases, term limits would help somewhat.
I can simulate this by making the advantage of incumbency bigger (raising the saturation advantage parameter):
However, long terms are a symptom of the problem, not the root cause. Therefore it probably necessary in addition to address redistricting, campaign finance, voter participation and education, and other aspects of the electoral process that give rise to the problem in the first place. I’d argue that this is the single greatest contribution Trump could make.
You can play with the model yourself using the Ventity beta/trial and this model archive: