Boiling Water Reactor Dynamics

Replicated from “Hybrid Simulation of Boiling Water Reactor Dynamics Using A University Research Reactor” by James A. Turso, Robert M. Edwards, Jose March-Leuba, Nuclear Technology vol. 110, Apr. 1995.

This is a simple 5th-order representation of the operation of a boiling water reactor around its normal operating point, which is subject to interesting limit cycle dynamics.

The original article documents the model well, with the exception of the bifurcation parameter K and a nonlinear term, for which I’ve identified plausible values by experiment.

TursoNuke1.mdl

The myth of optimal depletion

Fifteen years ago, when I was working on my dissertation, I read a lot of the economic literature on resource management. I was looking for a behavioral model of the management of depletable resources like oil and gas. I never did find one (and still haven’t, though I haven’t been looking as hard in the last few years).

Instead, the literature focused on optimal depletion models. Essentially these characterize the extraction of resources that would occur in an idealized market – a single, infinitely-lived resource manager, perfect information about the resource base and about the future (!), no externalities, no lock-in effects.

It’s always useful to know the optimal trajectory for a managed resource – it identifies the upper bound for improvement and suggests strategic or policy changes to achieve the ideal. But many authors have transplanted these optimal depletion models into real-world policy frameworks directly, without determining whether the idealized assumptions hold in reality.

The problem is that they don’t. There are some obvious failings – for example, I’m pretty certain a priori that no resource manager actually knows the future. Unreal assumptions are reflected in unreal model behavior – I’ve seen dozens of papers that discuss results matching the classic Hotelling framework – prices rising smoothly at the interest rate, with the extraction rate falling to match, as if it had something to do with what we observe.

The fundamental failure is valuing the normative knowledge about small, analytically tractable problems above the insight that arises from experiments with a model that describes actual decision making – complete with cognitive limitations, agency problems, and other foibles.

In typical optimal depletion models, an agent controls a resource, and extracts it to maximize discounted utility. Firms succeed in managing other assets reasonably well, so why not? Well, there’s a very fundamental problem: in most places, firms don’t control resources. They control reserves. Governments control resources. As a result, firms’ ownership of the long term depletion challenge extends only as far as their asset exposure – a few decades at most. If there are principal-agent problems within firms, their effective horizon is even shorter – only as long as the tenure of a manager (worse things can happen, too).

Governments are no better; politicians and despots both have incentives to deplete resources to raise money to pacify the populace. This encourages a “sell low” strategy – when oil prices are low, governments have to sell more to meet fixed obligations (the other end of the backward-bending supply curve). And, of course, a government that wisely shepherds its resources can always lose them to a neighbor that extracts its resources quickly and invests the proceeds in military hardware.

The US is unusual in that many mineral rights are privately held, but still the government’s management of its share is instructive. I’ll just skip over the circus at the MMS and go to Montana’s trust lands. The mission of the trust is to provide a permanent endowment for public schools. But the way the trust is run could hardly be less likely to maximize or even sustain school revenue.

Fundamentally, the whole process is unmanaged – the trust makes no attempt to control the rate at which parcels are leased for extraction. Instead, trust procedures put the leasing of tracts in the hands of developers – parcels are auctioned whenever a prospective bidder requests.  Once anyone gets a whiff of information about the prospects of a tract, they must act to bid – if they’re early enough, they may get lucky and face little or no competition in the auction (easier than you’d think, because the trust doesn’t provide much notice of sales). Once buyers obtain a lease, they must drill within five years, or the lease expires. This land rush mentality leaves the trust with no control over price or the rate of extraction – they just take their paltry 16% cut (plus or minus), whenever developers choose to give it to them. When you read statements from the government resource managers, they’re unapologetically happy about it: they talk about the trust as if it were a jobs program, not an endowment.

This sort of structure is the norm, not the exception. It would be a strange world in which all of the competing biases in the process cancelled each other out, and yielded a globally optimal outcome in spite of local irrationality. The result, I think, is that policies in climate and energy models are biased, possibly in an unknown direction. On one hand, it seems likely that there’s a negative externality from extraction of public resources above the optimal rate, as in Montana. On the other hand, there might be harmful spillovers from climate or energy policies that increase the use of natural gas, if they exacerbate problems with a suboptimal extraction trajectory.

I’ve done a little sniffing around lately, and it seems that the state of the art in integrated assessment models isn’t too different from what it was in 1995 – most models still use exogenous depletion trajectories or some kind of optimization or equilibrium approach. The only real innovation I’ve seen is a stochastic model-within-a-model approach – essentially, agents know the structure of the system they’re in, but are uncertain about it’s state, so they make stochastically optimal decisions at each point in time. This is a step in the right direction, but still implies a very high cognitive load and degree of intended rationality that doesn’t square with real institutions. I’d be very interested to hear about anything new that moves toward a true behavioral model of resource management.

The rebound delusion

Lately it’s become fashionable to claim that energy efficiency is useless, because the rebound effect will always eat it up. This is actually hogwash, especially in the short term. James Barrett has a nice critique of the super-rebound position at RCE. Some excerpts:

To be clear, the rebound effect is real. The theory behind it is sound: Lower the cost of anything and people will use more of it, including the cost of running energy consuming equipment. But as with many economic ideas that are sound theory (like the idea that you can raise government revenues by cutting tax rates), the trick is in knowing how far to take them in reality. (Cutting tax rates from 100% to 50% would certainly raise revenues. Cutting them from 50% to 0% would just as surely lower them.)

The problem with knowing how far to take things like this is that unlike real scientists who can run experiments in a controlled laboratory environment, economists usually have to rely on what we can observe in the real world. Unfortunately, the real world is complicated and trying to disentangle everything that’s going on is very difficult.

Owen cleverly avoids this problem by not trying to disentangle anything.

One supposed example of the Jevons paradox that he points to in the article is air conditioning. Citing a conversation with Stan Cox, author of Losing Our Cool, Owen notes that between 1993 and 2005, air conditioners in the U.S. increased in efficiency by 28%, but by 2005, homes with air conditioning increased their consumption of energy for their air conditioners by 37%.

Accounting only for the increased income over the timeframe and fixing Owen’s mistake of assuming that every air conditioner in service is new, a few rough calculations point to an increase in energy use for air conditioning of about 30% from 1993 to 2005, despite the gains in efficiency. Taking into account the larger size of new homes and the shift from room to central air units could easily account for the rest.

All of the increase in energy consumption for air conditioning is easily explained by factors completely unrelated to increases in energy efficiency. All of these things would have happened anyway. Without the increases in efficiency, energy consumption would have been much higher.

It’s easy to be sucked in by stories like the ones Owen tells. The rebound effect is real and it makes sense. Owen’s anecdotes reinforce that common sense. But it’s not enough to observe that energy use has gone up despite efficiency gains and conclude that the rebound effect makes efficiency efforts a waste of time, as Owen implies. As our per capita income increases, we’ll end up buying more of lots of things, maybe even energy. The question is how much higher would it have been otherwise.

Why is the rebound effect suddenly popular? Because an overwhelming rebound effect is needed to make sense of proposals to give up on near-term emissions prices and invest in technology, praying for a clean-energy-supply miracle in a few decades.

As Barrett points out, the notion that energy efficiency increases energy use is an exaggeration of the rebound effect. For efficiency to increase use, energy consumption has to be elastic (e<-1). I don’t remember ever seeing an economic study that came to that conclusion. In a production function, such values aren’t physically plausible, because they imply zero energy consumption at a finite energy price.

Therefore, the notion that pursuing energy efficiency makes the climate situation worse is a fabrication. Doubly so, because of an accounting sleight-of-hand. Consider two extremes:

  1. no rebound effects (elasticity ~ 0): efficiency policies work, because they reduce energy use and its associated negative social externalities.
  2. big rebound effects (elasticity < -1): efficiency policies increase energy use, but they do so because there’s a huge private benefit from the increase in mobility or illumination or whatever private purpose the energy is put to.

The super-rebound crowd pooh-poohs #1 and conveniently ignores the welfare outcome of #2, accounting only for the negative side effects.

If rebound effects are modest, as they surely are, it makes much more sense to guide R&D and deployment for both energy supply and demand with a current price signal on emissions. That way, firms make distributed decisions about where to invest, rather than the government picking winners, and appropriate tradeoffs between conservation and clean supply are possible. The price signal can be adapted to meet environmental constraints in the face of rising income. Progress starts now, rather than after decades of waiting for the discover->apply->deploy->embody pipeline.

If the public isn’t ready for it, that doesn’t mean analysts should bargain against their own good sense by recommending things that might be popular, but are unlikely to work. That’s like a doctor advising a smoker to give to cancer research, without mentioning that he really ought to quit.

Update: there’s an excellent followup at RCE.

Fuel economy makeover

The EPA is working on new fuel economy window stickers for cars (you can vote on alternatives). I like this one:

New Fuel Econ Sticker
hoisted from the comments at jalopnik

There are some things to like about the possible new version. For example, it indicates fuel economy on an absolute scale, so that there’s no implicit allocation of pollution rights to bigger vehicles (unlike Energy Star and the CAFE standard):

New Fuel Econ ScaleSince the new stickers will indicate fueling costs, emissions taxes on fuels will be a nice complementary policy, as they’ll be more evident on the dealer lot.

R&D – crack for techno-optimists

I like R&D. Heck, I basically do R&D. But the common argument, that people won’t do anything hard to mitigate emissions or reduce energy use, so we need lots of R&D to find solutions, strikes me as delusional.

The latest example to cross my desk (via the NYT) is the new American Energy Innovation Council’s recommendations,

Create an independent national energy strategy board.
Invest $16 billion per year in clean energy innovation.
Create Centers of Excellence with strong domain expertise.
Fund ARPA-E at $1 billion per year.
Establish and fund a New Energy Challenge Program to build large-scale pilot projects.

Let’s look at the meat of this – $16 billion per year in energy innovation funding. Historic funding looks like this:
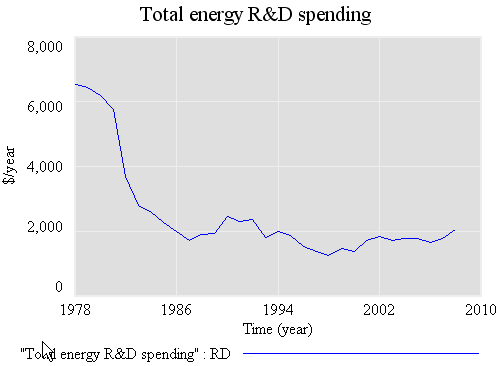
R&D funding

Total public energy R&D, compiled from Gallagher, K.S., Sagar, A, Segal, D, de Sa, P, and John P. Holdren, “DOE Budget Authority for Energy Research, Development, and Demonstration Database,” Energy Technology Innovation Project, John F. Kennedy School of Government, Harvard University, 2007. I have a longer series somewhere, but no time to dig it up. Basically, spending was negligible (or not separately accounted for) before WWII, and ramped up rapidly after 1973.

The data above reflects public R&D; when you consider private spending, the jump to $16 billion represents maybe a factor of 3 or 4 increase. What does that do for you?

Consider a typical model of technical progress, the two-factor learning curve:

cost = (cumulative R&D)^A*(cumulative experience)^B

The A factor represents improvement from deliberate R&D, while the B factor reflects improvement from production experience like construction and installation of wind turbines. A and B are often expressed as learning rates, the multiple on cost that occurs per doubling of the relevant cumulative input. In other words, A,B = ln(learning rate)/ln(2). Typical learning rates reported are .6 to .95, or cost reductions of 40% to 5% per doubling, corresponding with A/B values of -.7 to -.15, respectively. Most learning rate estimates are on the high end (smaller reductions per doubling), particularly when the two-factor function is used (as opposed to just one component).

Let’s simplify so that

cost = (cumulative R&D)^A

and use an aggressive R&D learning rate (.7), for A=-0.5. In steady state, with R&D growing at the growth rate of the economy (call it g), cost falls at the rate A*g (because the integral of exponentially growing spending grows at the same rate, and exp(g*t)^A = exp(A*g*t)).

That’s insight number one: a change in R&D allocation has no effect on the steady-state rate of progress in cost. Obviously one could formulate alternative models of technology where that is not true, but compelling argument for this sort of relationship is that the per capita growth rate of GDP has been steady for over 250 years. A technology model with a stronger steady-state spending->cost relationship would grow super-exponentially.

Insight number two is what the multiple in spending (call it M) does get you: a shift in the steady-state growth trajectory to a new, lower-cost path, by M^A. So, for our aggressive parameter, a multiple of 4 as proposed reduces steady-state costs by a factor of about 2. That’s good, but not good enough to make solar compatible with baseload coal electric power soon.

Given historic cumulative public R&D, 3%/year baseline growth in spending, a 0.8 learning rate (a little less aggressive), a quadrupling of R&D spending today produces cost improvements like this:
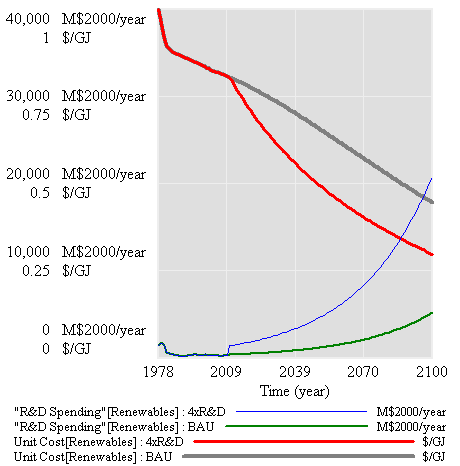
R&D future 4x

Those are helpful, but not radical. In addition, even if R&D produces something more miraculous than it has historically, there are still big nontechnical lock-in humps to overcome (infrastructure, habits, …). Overcoming those humps is a matter of deployment more than research. The Energy Innovation Council is definitely enthusiastic about deployment, but without internalizing the externalities associated with energy production and use, how is that going to work? You’d either need someone to pick winners and implement them with a mishmash of credits and subsidies, or you’d have to hope for/wait for cleantech solutions to exceed the performance of conventional alternatives.

The latter approach is the “stone age didn’t end because we ran out of stones” argument. It says that cleantech (iron) will only beat conventional (stone) when it’s unequivocally better, not just for the environment, but also convenience, cost, etc. What does that say about the prospects for CCS, which is inherently (thermodynamically) inferior to combustion without capture? The reality is that cleantech is already better, if you account for the social costs associated with energy. If people aren’t willing to internalize those social costs, so be it, but let’s not pretend we’re sure that there’s a magic technical bullet that will yield a good outcome in spite of the resulting perverse incentives.

Gallagher, K.S., Sagar, A, Segal, D, de Sa, P, and John P. Holdren, “DOE Budget Authority for Energy Research, Development, and Demonstration Database,” Energy Technology Innovation Project, John F. Kennedy School of Government, Harvard University, 2007.
EIA projections – peak oil or snake oil?

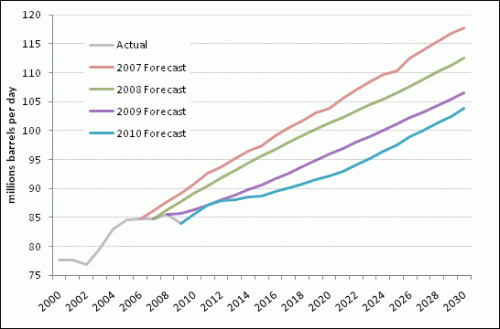
Econbrowser has a nice post from Steven Kopits, documenting big changes in EIA oil forecasts. This graphic summarizes what’s happened:

kopits_eia_forecasts_jun_10
Click through for the original article.

As recently as 2007, the EIA saw a rosy future of oil supplies increasing with demand. It predicted oil consumption would rise by 15 mbpd to 2020, an ample amount to cover most eventualities. By 2030, the oil supply would reach nearly 118 mbpd, or 23 mbpd more than in 2006. But over time, this optimism has faded, with each succeeding year forecast lower than the year before. For 2030, the oil supply forecast has declined by 14 mbpd in only the last three years. This drop is as much as the combined output of Saudi Arabia and China.

In its forecast, the EIA, normally the cheerleader for production growth, has become amongst the most pessimistic forecasters around. For example, its forecasts to 2020 are 2-3 mbpd lower than that of traditionally dour Total, the French oil major. And they are below our own forecasts at Douglas-Westwood through 2020. As we are normally considered to be in the peak oil camp, the EIA’s forecast is nothing short of remarkable, and grim.

Is it right? In the last decade or so, the EIA’s forecast has inevitably proved too rosy by a margin. While SEC-approved prospectuses still routinely cite the EIA, those who deal with oil forecasts on a daily basis have come to discount the EIA as simply unreliable and inappropriate as a basis for investments or decision-making. But the EIA appears to have drawn a line in the sand with its new IEO and placed its fortunes firmly with the peak oil crowd. At least to 2020.

Since production is still rising, I think you’d have to call this “inflection point oil,” but as a commenter points out, it does imply peak conventional oil:

It’s also worth note that most of the liquids production increase from now to 2020 is projected to be unconventional in the IEO. Most of this is biofuels and oil sands. They REALLY ARE projecting flat oil production.

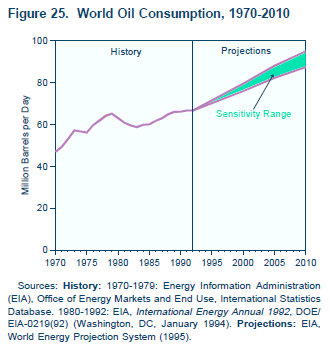
Since I’d looked at earlier AEO projections in the past, I wondered what early IEO projections looked like. Unfortunately I don’t have time to replicate the chart above and overlay the earlier projections, but here’s the 1995 projection:

Oil - IEO 1995

The 1995 projections put 2010 oil consumption at 87 to 95 million barrels per day. That’s a bit high, but not terribly inconsistent with reality and the new predictions (especially if the financial bubble hadn’t burst). Consumption growth is 1.5%/year.

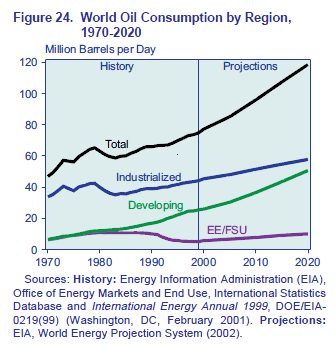
And here’s 2002:

Oil - IEO 2002

In the 2002 projection, consumption is at 96 million barrels in 2010 and 119 million barrels in 2020 (waaay above reality and the 2007-2010 projections), a 2.2%/year growth rate.

I haven’t looked at all the interim versions, but somewhere along the way a lot of optimism crept in (and recently, crept out). In 2002 the IEO oil trajectory was generated by a model called WEPS, so I downloaded WEPS2002 to take a look. Unfortunately, it’s a typical open-loop spreadsheet horror show. My enthusiasm for a detailed audit is low, but it looks like oil demand is purely a function of GDP extrapolation and GDP-energy relationships, with no hint of supply-side dynamics (not even prices, unless they emerge from other models in a sneakernet portfolio approach). There’s no evidence of resources, not even synchronized drilling. No wonder users came to “discount the EIA as simply unreliable and inappropriate as a basis for investments or decision-making.”

Newer projections come from a new version, WEPS+. Hopefully it’s more internally consistent than the 2002 spreadsheet, and it does capture stock/flow dynamics and even includes resources. EIA appears to be getting better. But it appears that there’s still a fundamental problem with the paradigm: too much detail. There just isn’t any point in producing projections for dozens of countries, sectors and commodities two decades out, when uncertainty about basic dynamics renders the detail meaningless. It would be far better to work with simple models, capable of exploring the implications of structural uncertainty, in particular relaxing assumptions of equilibrium and idealized behavior.

Update: Michael Levi at the CFR blog points out that much of the difference in recent forecasts can be attributed to changes in GDP projections. Perhaps so. But I think this reinforces my point about detail, uncertainty, and transparency. If the model structure is basically consumption = f(GDP, price, elasticity) and those inputs have high variance, what’s the point of all that detail? It seems to me that the detail merely obscures the fundamentals of what’s going on, which is why there’s no simple discussion of reasons for the change in forecast.

Greenwash labeling

I like green labeling, but I’m not convinced that, by itself,  it’s theoretically a viable way to get the economy to a good environmental endpoint. In practice, it’s probably even worse. Consider Energy Star. It’s supposed to be “helping us all save money and protect the environment through energy efficient products and practices.” The reality is that it gives low-quality information a veneer of authenticity, misleading consumers. I have no doubt that it has some benefits, especially through technology forcing, but it’s soooo much less than it could be.

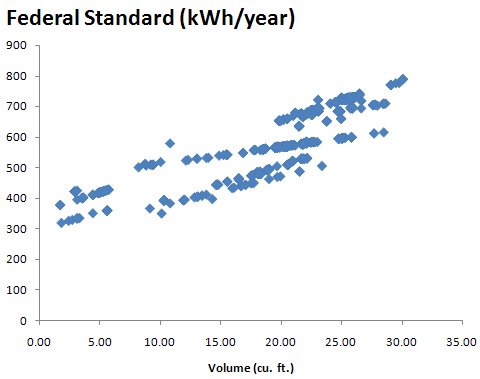
The fundamental signal Energy Star sends is flawed. Because it categorizes appliances by size and type, a hog gets a star as long as it’s also big and of less-efficient design (like a side-by-side refrigerator/freezer). Here’s the size-energy relationship of the federal energy performance standard (which Energy Star fridges must exceed by 20%):

standard

Notice that the standard for a 20 cubic foot fridge is anywhere from 470 to 660 kWh/year.

Continue reading “Greenwash labeling”

When rebates go bad

rebate

There’s a long-standing argument over the extent to which rebound effects eat up the gains of energy-conserving technologies, and whether energy conservation programs are efficient. I don’t generally side with the hardline economists who argue that conservation programs fail a cost benefit test, because I think there really are some $20 bills scattered about, waiting to be harvested by an intelligent mix of information and incentives. At the same time, some rebate and credit programs look pretty fishy to me.

On the plus side, I just bought a new refrigerator, using Montana’s $100 stimulus credit. There’s no rebound, because I have to hand over the old one for recycling. There is some rebound potential in general, because I could have used the $100 to upgrade to a larger model. Energy Star segments the market, so a big side-by-side fridge can pass while consuming more energy than a little top-freezer. That’s just stupid. Fortunately, most people have space constraints, so the short run price elasticity of fridge size is low.

On the minus side, consider tax credits for hybrid vehicles. For a super-efficient Prius or Insight, I can sort of see the point. But a $2600 credit for a Toyota Highlander getting 26mpg? What a joke! Mercifully that foolishness has been phased out. But there’s plenty more where that came from.

Consider this Bad Boy:

credit

The Zero-Emission Agricultural Utility Terrain Vehicle (Agricultural UTV) Rebate Program will credit $1950 in the hope of fostering greener farms. But this firm knows who it’s really marketing to:

turkey

Is there really good control over the use of the $, or is public funding just mechanizing outdoor activities where people ought to use the original low-emissions vehicle, their feet? When will I get a rebate for my horse?

Other bathtubs – capital

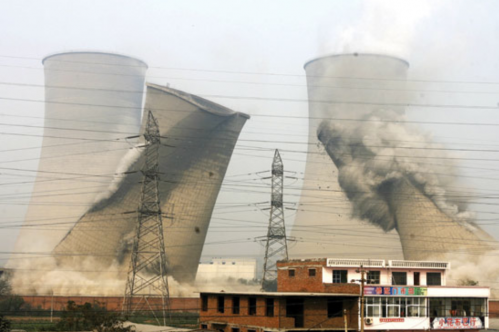
China is rapidly eliminating old coal generating capacity, according to Technology Review.

Draining Bathtub

Coal still meets 70 percent of China’s energy needs, but the country claims to have shut down 60 gigawatts’ worth of inefficient coal-fired plants since 2005. Among them is the one shown above, which was demolished in Henan province last year. China is also poised to take the lead in deploying carbon capture and storage (CCS) technology on a large scale. The gasifiers that China uses to turn coal into chemicals and fuel emit a pure stream of carbon dioxide that is cheap to capture, providing “an excellent opportunity to move CCS forward globally,” says Sarah Forbes of the World Resources Institute in Washington, DC.

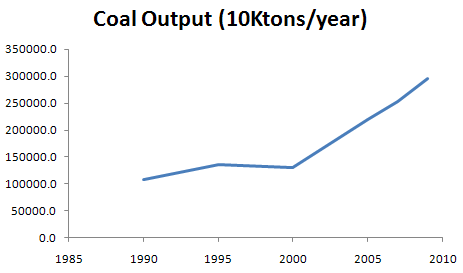
That’s laudable. However, the inflow of new coal capacity must be even greater. Here’s the latest on China’s coal output:

ChinaCoalOutput

China Statistical Yearbook 2009 & 2009 main statistical data update

That’s just a hair short of 3 billion tons in 2009, with 8%/yr growth from ’07-’09, in spite of the recession. On a per capita basis, US output and consumption is still higher, but at those staggering growth rates, it won’t take China long to catch up.

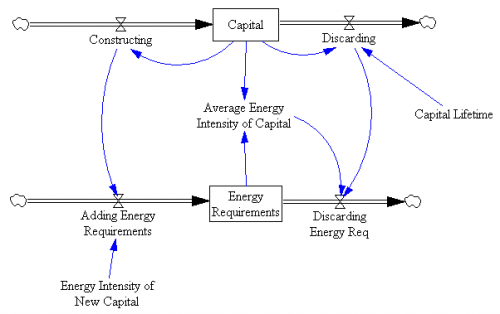
A simple model of capital turnover involves two parallel bathtubs, a “coflow” in SD lingo:

CapitalTurnover

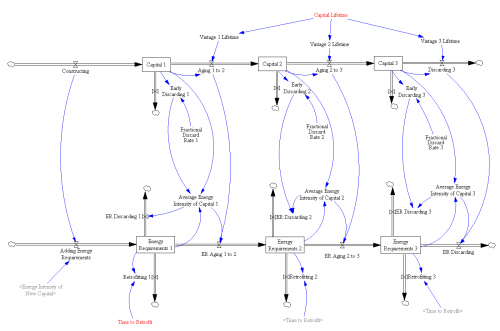
Every time you build some capital, you also commit to the energy needed to run it (unless you don’t run it, in which case why build it?). If you get fancy, you can consider 3rd order vintaging and retrofits, as here:

Capital Turnover 3o

To get fancier still, see the structure in John Sterman’s thesis, which provides for limited retrofit potential (that Gremlin just isn’t going to be a Prius, no matter what you do to the carburetor).

The basic challenge is that, while it helps to retire old dirty capital quickly (increasing the outflow from the energy requirements bathtub), energy requirements will go up as long as the inflow of new requirements is larger, which is likely when capital itself is growing and the energy intensity of new capital is well above zero. In addition, when capital is growing rapidly, there just isn’t much old stuff around (proportionally) to throw away, because the age structure of capital will be biased toward new vintages.

Hat tip: Travis Franck

Oily balls

The device designed to cut the oil flow after BP’s oil rig exploded was faulty, the head of a congressional committee said on Wednesday … the rig’s underwater blowout preventer had a leak in its hydraulic system and the device was not powerful enough to cut through joints to seal the drill pipe. …

Markey joked about BP’s proposal to stuff the blowout preventer with golf balls, oil tires “and other junk” to block the spewing oil.

“When we heard the best minds were on the case, we expected MIT, not the PGA,” said Markey, referring to the professional golfing group. “We already have one hole in the ground and now their solution is to shoot a hole in one?”

Via Reuters