Stop talking, start studying?

Roger Pielke Jr. poses a carbon price paradox:

The carbon price paradox is that any politically conceivable price on carbon can do little more than have a marginal effect on the modern energy economy. A price that would be high enough to induce transformational change is just not in the cards. Thus, carbon pricing alone cannot lead to a transformation of the energy economy.

Put another way:

Advocates for a response to climate change based on increasing the costs of carbon-based energy skate around the fact that people react very negatively to higher prices by promising that action won’t really cost that much. … If action on climate change is indeed “not costly” then it would logically follow the only reasons for anyone to question a strategy based on increasing the costs of energy are complete ignorance and/or a crass willingness to destroy the planet for private gain. … There is another view. Specifically that the current ranges of actions at the forefront of the climate debate focused on putting a price on carbon in order to motivate action are misguided and cannot succeed. This argument goes as follows: In order for action to occur costs must be significant enough to change incentives and thus behavior. Without the sugarcoating, pricing carbon (whether via cap-and-trade or a direct tax) is designed to be costly. In this basic principle lies the seed of failure. Policy makers will do (and have done) everything they can to avoid imposing higher costs of energy on their constituents via dodgy offsets, overly generous allowances, safety valves, hot air, and whatever other gimmick they can come up with.

His prescription (and that of the Breakthrough Institute)  is low carbon taxes, reinvested in R&D:

We believe that soon-to-be-president Obama’s proposal to spend $150 billion over the next 10 years on developing carbon-free energy technologies and infrastructure is the right first step. … a $5 charge on each ton of carbon dioxide produced in the use of fossil fuel energy would raise $30 billion a year. This is more than enough to finance the Obama plan twice over.

… We would like to create the conditions for a virtuous cycle, whereby a small, politically acceptable charge for the use of carbon emitting energy, is used to invest immediately in the development and subsequent deployment of technologies that will accelerate the decarbonization of the U.S. economy.

Stop talking, start solving

As the nation begins to rely less and less on fossil fuels, the political atmosphere will be more favorable to gradually raising the charge on carbon, as it will have less of an impact on businesses and consumers, this in turn will ensure that there is a steady, perhaps even growing source of funds to support a process of continuous technological innovation.

This approach reminds me of an old joke:

Lenin, Stalin, Khrushchev and Brezhnev are travelling together on a train. Unexpectedly the train stops. Lenin suggests: “Perhaps, we should call a subbotnik, so that workers and peasants fix the problem.” Kruschev suggests rehabilitating the engineers, and leaves for a while, but nothing happens. Stalin, fed up, steps out to intervene. Rifle shots are heard, but when he returns there is still no motion. Brezhnev reaches over, pulls the curtain, and says, “Comrades, let’s pretend we’re moving.”

I translate the structure of Pielke’s argument like this:
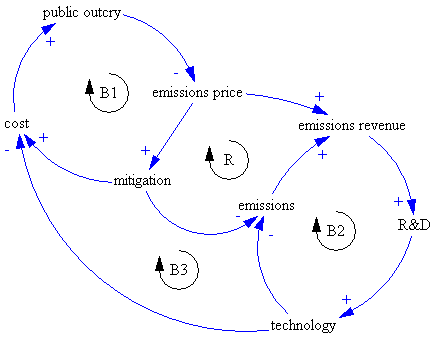
Pielke Loops

Implementation of a high emissions price now would be undone politically (B1). A low emissions price triggers a virtuous cycle (R), as revenue reinvested in technology lowers the cost of future mitigation, minimizing public outcry and enabling the emissions price to go up. Note that this structure implies two other balancing loops (B2 & B3) that serve to weaken the R&D effect, because revenues fall as emissions fall.

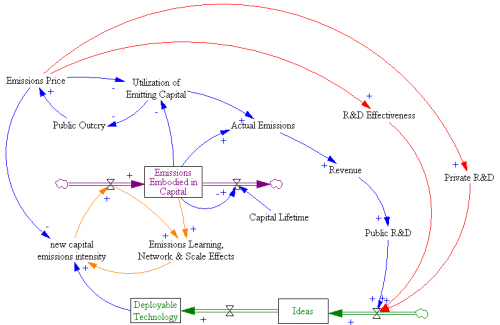
If you elaborate on the diagram a bit, you can see why the technology-led strategy is unlikely to work:

PielkeLoopsSF

First, there’s a huge delay between R&D investment and emergence of deployable technology (green stock-flow chain). R&D funded now by an emissions price could take decades to emerge. Second, there’s another huge delay from the slow turnover of the existing capital stock (purple) – even if we had cars that ran on water tomorrow, it would take 15 years or more to turn over the fleet. Buildings and infrastructure last much longer. Together, those delays greatly weaken the near-term effect of R&D on emissions, and therefore also prevent the virtuous cycle of reduced public outcry due to greater opportunities from getting going. As long as emissions prices remain low, the accumulation of commitments to high-emissions capital grows, increasing public resistance to a later change in direction. Continue reading “Stop talking, start studying?”

Painting ourselves into a green corner

At the Green California Summit & Expo this week, I saw a strange sight: a group of greentech manufacturers hanging out in the halls, griping about environmental regulations. Their point? That a surfeit of command-and-control measures makes compliance such a lengthy and costly process that it’s hard to bring innovations to market. That’s a nice self-defeating outcome!

Consider this situation:

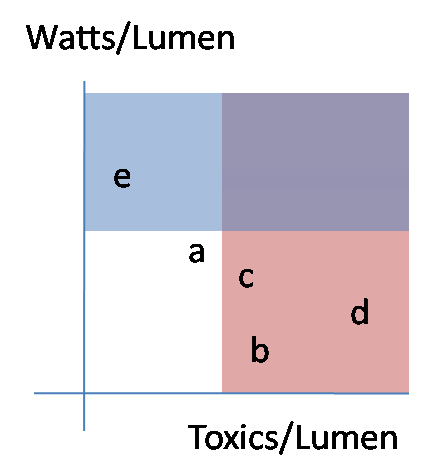
greenCorner
I was thinking of lighting, but it could be anything. Letters a-e represent technologies with different properties. The red area is banned as too toxic. The blue area is banned as too inefficient. That leaves only technology a. Maybe that’s OK, but what if a is made in Cuba, or emits harmful radiation, or doesn’t work in cold weather? That’s how regulations get really complicated and laden with exceptions. Also, if we revise our understanding of toxics, how should we update this to reflect the tradeoffs between toxics in the bulb and toxics from power generation, or using less toxic material per bulb vs. using fewer bulbs? Notice that the only feasible option here – a – is not even on the efficient frontier; a mix of e and b could provide the same light with slightly less power and toxics.

Proliferation of standards creates a situation with high compliance costs, both for manufacturers and the bureaucracy that has to administer them. That discourages small startups, leaving the market for large firms, which in turn creates the temptation for the incumbents to influence the regulations in self-serving ways. There are also big coverage issues: standards have to be defined clearly, which usually means that there are fringe applications that escape regulation. Refrigerators get covered by Energy Star, but undercounter icemakers and other cold energy hogs don’t. Even when the standards work, lack of a price signal means that some of their gains get eaten up by rebound effects. When technology moves on, today’s seemingly sensible standard becomes part of tomorrow’s “dumb laws” chain email.

The solution is obviously not total laissez faire; then the environmental goals just don’t get met. There probably are some things that are most efficient to ban outright (but not the bulb), but for most things it would be better to impose upstream prices on the problems – mercury, bisphenol A, carbon, or whatever – and let the market sort it out. Then providers can make tradeoffs the way they usually do – which package of options makes the cheapest product? -without a bunch of compliance risk involved in bringing their product to market.

Here’s the alternative scheme:

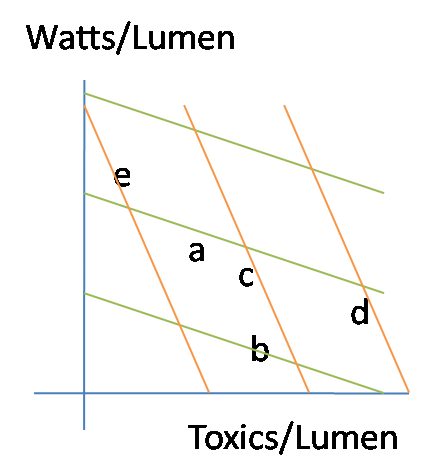
greenTradeoffs

The green and orange lines represent isocost curves for two different sets of energy and toxic prices. If the unit prices of a-e were otherwise the same, you’d choose b with the green pricing scheme (cheap toxics, expensive energy) and e in the opposite circumstance (orange). If some of the technologies are uniquely valuable in some situations, pricing also permits that tradeoff – perhaps c is not especially efficient or clean, but has important medical applications.

With a system driven by prices and values, we could have very simple conversations about adaptive environmental control. Are NOx levels acceptable? If not, raise the price of emitting NOx until it is. End of discussion.

Two related tidbits:

Fed green buildings guru Kevin Kampschroer gave an interesting talk on the GSA’s greening efforts. He expressed hope that we could move from LEED (checklists) to LEEP (performance-based ratings).

I heard from a lighting manufacturer that the cost of making a CFL is under a buck, but running a recycling program (for mercury recapture) costs $1.50/bulb. There must be a lot of markup in the distribution channels to get them up to retail prices.

Idle wind in China?

Via ClimateProgress:

China finds itself awash in wind turbine factories

China’s massive investment in wind turbines, fueled by its government’s renewable energy goals, has caused the value of the turbines to tumble more than 30 percent from 2004 levels, the vice president of Shanghai Electric Group Corp. said yesterday.

There are now “too many plants,” Lu Yachen said, noting that China is idling as much as 40 percent of its turbine factories.

The surge in turbine investments came in response to China’s goal to increase its power production capacity from wind fivefold in 2020.

The problem is that there are power grid constraints, said Dave Dai, an analyst with CLSA Asia-Pacific Markets, noting that construction is slowed because of that obstacle. Currently, only part of China’s power grid is able to accept delivery of electricity produced by renewable energy. “The issues with the grid aren’t expected to ease in the near term,” he said. Still, they “should improve with the development of smart-grid investment over time.”

The constraints may leave as much as 4 gigawatts of windpower generation capacity lying idle, Sunil Gupta, managing director for Asia and head of clean energy at Morgan Stanley, concluded in November.

China has the third-largest windpower market by generating capacity, Shanghai Electric’s Yachen said.

It’s tempting to say that the grid capacity is a typical coordination failure of centrally planned economies. Maybe so, but there are certainly similar failures in market economies – Montana gas producers are currently pipeline-constrained, and the rush to gas in California in the deregulation/Enron days was hardly a model of coordination. (Then again, electric power is hardly a free market.)

The real problem, of course, is that coal gets a free ride in China – as in most of the world – so that the incentives to solve the transmission problem for wind just aren’t there.

Fuzzy VISION

Like spreadsheets, open-loop models are popular but flawed tools. An open loop model is essentially a scenario-specification tool. It translates user input into outcomes, without any intervening dynamics. These are common in public discourse. An example turned up in the very first link when I googled “regional growth forecast”:

The growth forecast is completed in two stages. During the first stage SANDAG staff produces a forecast for the entire San Diego region, called the regionwide forecast. This regionwide forecast does not include any land use constraints, but simply projects growth based on existing demographic and economic trends such as fertility rates, mortality rates, domestic migration, international migration, and economic prosperity.

In other words, there’s unidirectional causality from inputs  to outputs, ignoring the possible effects of the outputs (like prosperity) on the inputs (like migration). Sometimes such scenarios are useful as a starting point for thinking about a problem. However, with no estimate of the likelihood of realization of such a scenario, no understanding of the feedback that would determine the outcome, and no guidance about policy levers that could be used to shape the future, such forecasts won’t get you very far (but they might get you pretty deep – in trouble).

The key question for any policy, is “how do you get there from here?” Models can help answer such questions. In California, one key part of the low-carbon fuel standard (LCFS) analysis was VISION-CA. I wondered what was in it, so I took it apart to see. The short answer is that it’s an open-loop model that demonstrates a physically-feasible path to compliance, but leaves the user wondering what combination of vehicle and fuel prices and other incentives would actually get consumers and producers to take that path.

First, it’s laudable that the model is publicly available for critique, and includes macros that permit replication of key results. That puts it ahead of most analyses right away. Unfortunately, it’s a spreadsheet, which makes it tough to know what’s going on inside.

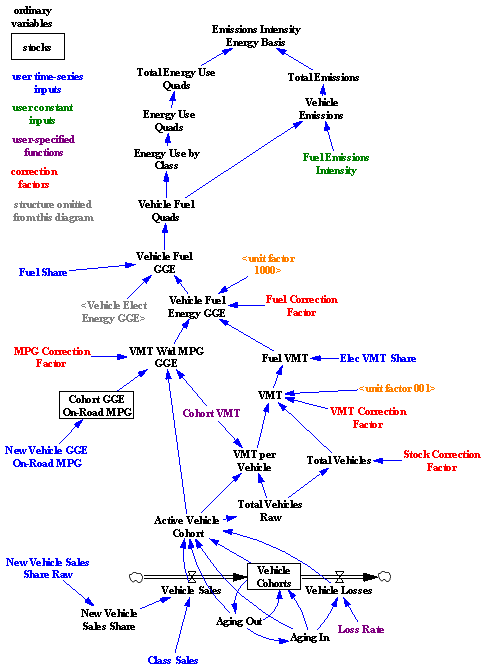
I translated some of the model core to Vensim for clarity. Here’s the structure:

VISION-CA

Bringing the structure into the light reveals that it’s basically a causal tree – from vehicle sales, fuel efficiency, fuel shares, and fuel intensity to emissions. There is one pair of minor feedback loops, concerning the aging of the fleet and vehicle losses. So, this is a vehicle accounting tool that can tell you the consequences of a particular pattern of new vehicle and fuel sales. That’s already a lot of useful information. In particular, it enforces some reality on scenarios, because it imposes the fleet turnover constraint, which imposes a delay in implementation from the time it takes for the vehicle capital stock to adjust. No overnight miracles allowed.

What it doesn’t tell you is whether a particular measure, like an LCFS, can achieve the desired fleet and fuel trajectory with plausible prices and other conditions. It also can’t help you to decide whether an LCFS, emissions tax, or performance mandate is the better policy. That’s because there’s no consumer choice linking vehicle and fuel cost and performance, consumer knowledge, supplier portfolios, and technology to fuel and vehicle sales. Since equilibrium analysis suggests that there could be problems for the LCFS, and disequilibrium generally makes things harder rather than easier, those omissions are problematic.

Continue reading “Fuzzy VISION”

LCFS in Equilibrium II

My last post introduced some observations from simulation of an equilibrium fuel portfolio standard model:

  • knife-edge behavior of market volume of alternative fuels as you approach compliance limits (discussed last year): as the required portfolio performance approaches the performance of the best component options, demand for those approaches 100% of volume rapidly.
  • differences in the competitive landscape for technology providers, when compared to alternatives like a carbon tax.
  • differences in behavior under uncertainty.
  • perverse behavior when the elasticity of substitution among fuels is low

Here are some of the details. First, the model:

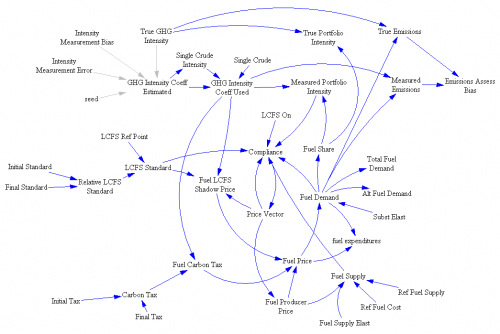
structure

Notice that this is not a normal SD model – there are loops but no stocks. That’s because this is a system of simultaneous equations solved in equilibrium. The Vensim FIND ZERO function is used to find a vector of prices (one for each fuel, plus the shadow price of emissions intensity) that matches supply and demand, subject to the intensity constraint.

Continue reading “LCFS in Equilibrium II”

The Energy Transition and the Economy

Model Name: The Energy Transition and the Economy: A System Dynamics Approach

Citation: John D. Sterman, 1981. PhD Dissertation, MIT Sloan School of Management

Source: Replicated by Miguel Vukelic (a heroic effort)

Units balance: Yes

Format: Vensim (Contains data variables and thus requires an advanced version or the free Model Reader)

The Energy Transition and the Economy (Vensim .vpm)

A Tale of Three Models – LCFS in Equilibrium

This is the first of several posts on models of the transition to alternative fuel vehicles. The first looks at a static equilibrium model of the California Low Carbon Fuel Standard (LCFS). Another will look at another model of the LCFS, called VISION-CA, which generates fuel carbon intensity scenarios. Finally, I’ll discuss Jeroen Struben’s thesis, which is a full dynamic model that closes crucial loops among vehicle fleets, consumer behavior, fueling infrastructure, and manufacturers’ learning. At some point I will try to put the pieces together into a general reflection on alt fuel policy.

Those who know me might be surprised to see me heaping praise on a static model, but I’m about to do so. Not every problem is dynamic, and sometimes a comparative statics exercise yields a lot of insight.

In a no-longer-so-new paper, Holland, Hughes, and Knittel work out the implications of the LCFS and some variants. In a nutshell, a low carbon fuel standard is one of a class of standards that requires providers of a fuel (or managers of some kind of portfolio) to meet some criteria on average – X grams of carbon per MJ of fuel energy, or Y% renewable content, for example. If trading is allowed (fun, no?), then the constraint effectively applies to the market portfolio as a whole, rather than to individual providers, which should be more efficient. The constraint in effect requires the providers to set up an internal tax and subsidy system – taxing products that don’t meet the standard, and subsidizing those that do. The LCFS sounds good on paper, but when you do the math, some problems emerge:

We show this decreases high-carbon fuel production but increases low-carbon fuel production, possibly increasing net carbon emissions. The LCFS cannot be efficient, and the best LCFS may be nonbinding. We simulate a national LCFS on gasoline and ethanol. For a broad parameter range, emissions decrease; energy prices increase; abatement costs are large ($80-$760 billion annually); and average abatement costs are large ($307-$2,272 per CO tonne). A cost effective policy has much lower average abatement costs ($60-$868).

Continue reading “A Tale of Three Models – LCFS in Equilibrium”

California EPA's LEED platinum HQ

I’m usually quick to point out the limitations of technology for reducing environmental and other problems. But that doesn’t mean it’s not important. Yesterday I took a tour that hilighted how big the opportunities can be when technology and slight lifestyle changes team up. The tour was of CalEPA’s LEED platinum skyscraper – evidently the first of its kind, but now a few years old. Interestingly, it was initially designed as an ordinary building, and design changes were introduced late in the game, which gives hope that most of the same innovations could be implemented as retrofits on older buildings.

When you walk up to the building, there’s no indication that there’s anything unusual about it. If anything, it’s massive (salvaged) stone decorative features lead one to think it could easily be an extravagant energy hog. That impression continues on the inside, with elegant and tasteful lighting and finishes. No hairy unwashed treehuggers freezing in the dark here.

Yet, the building uses a third the energy (per sq ft) of its peers nearby, even with a big datacenter on one floor that consumes a third of the energy in the 25-story structure. The big heroes are an efficient skin, with low-e windows and detailing to reduce solar gain on the south and west sides, coupled with an advanced HVAC system. Climate control combines 10,000 sensors with three different sizes of chiller unit and variable-speed motor controls. That way, equipment always operates near its optimum load. Soon, a retrofit will use groundwater (which has to be pumped out anyway) to aid cooling. Heating and cooling costs are lower, yet comfort is improved by the advanced controls.

The occupants certainly contribute a lot to efficiency. Over 80% use bikes or transit to commute, aided by a beautiful bicycle parking garage in the basement (complete with air compressor and lockers). Most prefer motion-sensitive task lights, so area lighting stays off. They adopted double-side network printers to reduce paper waste, and recycle assiduously. Worm-bin composting is a popular office activity. As a result the building managers have to haul trash only twice a month instead of the typical twice a week. Because staff don’t have to spend as much time with regular garbage, they have more energy to figure out how to recycle used computers and other unusual materials.

Sometimes the benefits are unexpected. To reduce nighttime lighting loads, most of the leaning in the building happens during the day. Side effects include greatly reduced reports of theft and workers’ comp claims, better cooperation on cleaning and recycling (aided by the low waste flow), and greater occupant satisfaction. It turns out that it’s easier to like someone you see on a daily basis. Materials have side benefits too. Zero-VOC paints mean that occasional repairs don’t stink up the place and needn’t be confined to weekends. Low-volatile, recyclable carpet tiles turn out to be extremely durable and repairable, and permit creative design.

The amazing thing is that most of the features paid for themselves in under two years, with correspondingly huge ROIs. None takes a radical change in workstyle, but there’s lots of synergy among them. It wasn’t easy to pull this off, in the sense that it took a lot of thinking, but if you think thinking is fun, then you wouldn’t call it hard either.

The 2009 World Energy Outlook

Following up on Carlos Ferreira’s comment, I looked up the new IEA WEO, unveiled today.  A few excerpts from the executive summary:

  • The financial crisis has cast a shadow over whether all the energy investment needed to meet growing energy needs can be mobilised.
  • Continuing on today’s energy path, without any change in government policy, would mean rapidly increasing dependence on fossil fuels, with alarming consequences for climate change and energy security.
  • Non-OECD countries account for all of the projected growth in energy-related CO2 emissions to 2030.
  • The reductions in energy-related CO2 emissions required in the 450 Scenario (relative to the Reference Scenario) by 2020 — just a decade away — are formidable, but the financial crisis offers what may be a unique opportunity to take the necessary steps as the political mood shifts.
  • With a new international climate policy agreement, a comprehensive and rapid transformation in the way we produce, transport and use energy — a veritable lowcarbon revolution — could put the world onto this 450-ppm trajectory.
  • Energy efficiency offers the biggest scope for cutting emissions
  • The 450 Scenario entails $10.5 trillion more investment in energy infrastructure and energy-related capital stock globally than in the Reference Scenario through to the end of the projection period.
  • The cost of the additional investments needed to put the world onto a 450-ppm path is at least partly offset by economic, health and energy-security benefits.
  • In the 450 Scenario, world primary gas demand grows by 17% between 2007 and 2030, but is 17% lower in 2030 compared with the Reference Scenario.
  • The world’s remaining resources of natural gas are easily large enough to cover any conceivable rate of increase in demand through to 2030 and well beyond, though the cost of developing new resources is set to rise over the long term.
  • A glut of gas is looming

This is pretty striking language, especially if you recall the much more business-as-usual tone of WEOs in the 90s.

Marginal Damage has (or will have) more.

MAC Attack

John Sterman just pointed me to David Levy’s newish blog, Climate Inc., which has some nice thoughts on Marginal Abatement Cost curves: How to get free mac lunches, and Whacking the MAC. They reminded me of my own thoughts on The elusive MAC curve. Climate Inc. also has a very interesting post on the psychology of US and European oil companies’ climate strategies, Back to Petroleum?.

The conclusion from How to get free mac lunches:

Of course, these solutions are not cost free ’“ they involve managerial time, some capital, and transaction costs. Some of the barriers are complex and would require large scale institutional restructuring, requiring government-business collaboration. But one person’s transaction costs are another’s business opportunity (the transaction costs of carbon markets will keep financial firms smiling). The key point here is that there are creative organizational and managerial approaches to unlock the doors to low-cost or even negative-cost carbon reductions. The carbon price is, by itself, an inefficient and ineffective tool ’“ the price would have to be at a politically infeasible level to achieve the desired goal. But we don’t have to rely just on the carbon price or on command and control; a multi-pronged attack is needed.

and Whacking the MAC:

Simply put, it will take a lot more than a market-based carbon price and a handout of free allowances to utilities to unlock the potential of conservation and energy efficiency investments.  It will take some serious innovation, a great deal of risk-taking and capital, and a coordinated effort by policy-makers, investors, and entrepreneurs to jump the significant institutional and legal hurdles currently in the way.  Until then, it will continue to be a real stretch to bend over the hurdles in an effort to reach all the elusive fruit lying on the ground.

Here’s my bottom line on MAC curves:

The existence of negative cost energy efficiency and mitigation options has been debated for decades. The arguments are more nuanced than they used to be, but this will not be settled any time soon. Still, there is an obvious way to proceed. First, put a price on carbon and other externalities. We’d make immediate progress on some fronts, where there are no barriers or misperceptions. In the stickier areas, there would be a financial incentive to solve the institutional, informational and transaction cost barriers that prevented implementation when energy was cheap and emissions were free. Service providers would emerge, and consumers and producers could gang up to push bureaucrats in the right direction. MAC curves would be a useful roadmap for action.