More power of personal feedback

Now that I’ve dumped on emerging behavioral feedback technologies, perhaps I should share a personal success story, in which measurement technology played a key role.

Ten years ago, a routine test revealed that my cholesterol was 280 mg/dl, and even higher in a confirmation test. That’s not instant death, but it’s bad. NIH calls <200 desirable, and many argue for even lower levels.

This was a surprise, because I was getting a fair amount of exercise and eating healthier than the typical American diet. I suspect that their must be some genetic component.

Without any discussion, my doctor handed me a prescription for Lipitor. Now, I liked that doctor, and I know he was smart because we’d just had an interesting conversation about wavelet analysis of time series data in biomedical research. But I think he was operating under the assumption that there was no potential for improvement from behavior change. This idea seems to grip much of the medical profession, and creates nasty self-fulfilling prophecy and eroding goals dynamics.

I decided that I didn’t want to take statins for the rest of my (hopefully long) life, so with the aid of spousal prodding and planning, I eliminated all cholesterol and saturated fats (essentially all animal products) from my diet. I was quickly below 200, and then made more gradual progress to a range of about 160 to 180.

Interestingly, since then I’ve also cut out a lot of carbohydrates, because the rest of my family is gluten intolerant, which takes the fun out of bread and pasta. My cholesterol is now lower than ever, 149 at last check, in spite of adding eggs, a big dietary cholesterol source, back into my diet.

While my wife deserves most of the credit for my success, I think technology played a key role as well. Early on, I bought a home cholesterol test meter (a Bioscanner 2000, predecessor to the CardioChek that I now have). The meter allowed me to close the loop between behavior and outcome without the long delay and expense involved with a trip to the doctor. That obviously had a practical benefit, but it was also very motivating.

Continue reading “More power of personal feedback”

The Ryan health care proposal

The Ryan budget proposal achieves the bulk of its savings by cutting health care outlays, particularly Medicare and Medicaid. The mechanism sounds a lot like a firm’s transition from a defined benefits pension plan to a defined contribution scheme. Medicaid becomes a system of block grants to states, and Medicare becomes a system of flat-rate vouchers. Along the way, it has some useful aspirations: to separate health insurance from employment and eliminate health’s favored tax status.

Reading some of the finer print, though, I don’t think it really fixes the fundamental flaws of the current system. It’s billed as “universal access” but that’s a misnomer. It guarantees universal access to a tax credit or voucher that can be used to purchase coverage, but not universal access to coverage. That’s because it doesn’t solve the adverse selection problem. As a result, any provider that doesn’t play the usual game of excluding anyone who’s really sick from coverage (using preexisting conditions and rotating plan changes) will suffer a variant of the utility death spiral: increasing costs drive the healthy out of the plan, leaving it to serve a diminishing set of members who had the misfortune to get sick, at an escalating cost.

Universal access to coverage is left to the states, who can create assigned risk pools or other methods to cover the uncoverable. Leaving things to the states strikes me as a reasonable strategy, because the health system is so complex that evolutionary learning is likely to beat the kind of deliberate design we’ll get out of congress. But it’s not clear to me that the proposal creates any real authority to raise money to support these assigned risk pools; without money, the state mechanisms will be rather perfunctory.

The real challenge seems to me to be to address three features of health:

  • Prevention beats cure by a long shot, in terms of both cost and quality of life. In the current system, patient churn through providers eliminates most of the provider-side incentive to address this. Patients have contributed by abdicating responsibility for their own health, and insurance exacerbates the problem by obscuring the costs of the quadruple bypass that follows from a life of Big Macs.
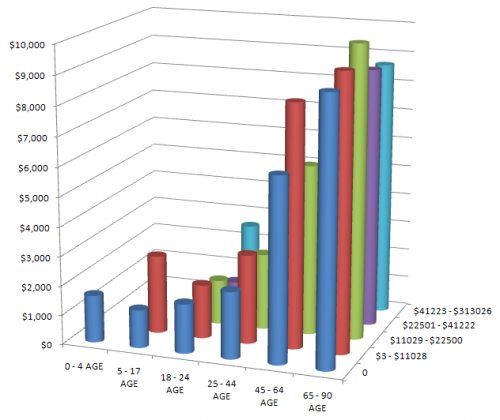
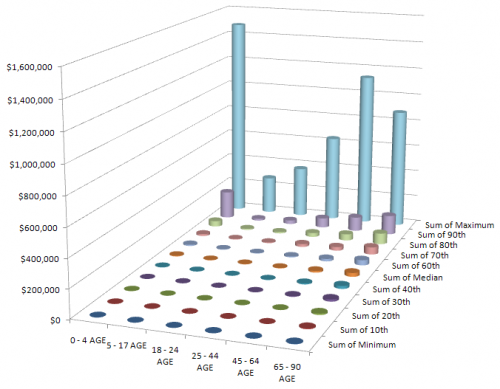
  • Health care expenditures are extremely skewed over one’s lifetime and within age cohorts. Good behavior can’t mitigate all risk, particularly the risk of getting old. (See below for a peek at the data.)
  • In some circumstances, the health care system is capable of expending an extremely large amount of resources on a person – sometimes for a miraculous outcome, and sometimes for rather marginal end-of-life extension.

What’s needed is a distributed way to share risk (which is why it’s called insurance), while preserving incentives for good behavior and matching total expenditures to resources. That’s a tall order. It’s not clear to me that the Ryan proposal tackles it in any serious way; it just extends the flaws of the current system to Medicare patients.

healthExpendAgeIncomeMEPSPer capita annual medical expenditures from the MEPS panel, by age and income. There’s surprisingly little variation by income, but a lot by age. The bill terminates the agency that collects this data.

healthExpendAgeDecileMEPSHealth expenditures by age and decile of cohort, showing the extreme concentration of expenditures at all ages.

The really fine print, the text of the bill itself, is daunting – 629 pages. This strikes me as simply unmanageable (like the deceased cap and trade legislation). There are simply too many opportunities for unintended consequences, and hidden agendas, in such a multifaceted approach, especially with the opaque analytic support available. Surely this could be tackled in a series of smaller bites – health, revenue, other expenditures. It calls to mind the criticism of the FAA’s repeated failure to redesign the air traffic control system, “you can’t design a system that evolved.” Well, maybe you can, but not with the kind of tools and discourse that now prevail.

A System Zoo

I just picked up a copy of Hartmut Bossel’s excellent System Zoo 1, which I’d seen years ago in German, but only recently discovered in English. This is the first of a series of books on modeling – it covers simple systems (integration, exponential growth and decay), logistic growth and variants, oscillations and chaos, and some interesting engineering systems (heat flow, gliders searching for thermals). These are high quality models, with units that balance, well-documented by the book. Every one I’ve tried runs in Vensim PLE so they’re great for teaching.

I haven’t had a chance to work my way through the System Zoo 2 (natural systems – climate, ecosystems, resources) and System Zoo 3 (economy, society, development), but I’m pretty confident that they’re equally interesting.

You can get the models for all three books, in English, from the Uni Kassel Center for Environmental Systems Research – it’s now easy to find a .zip archive of the zoo models for the whole series, in Vensim .mdl format, on CESR’s home page: www2.cesr.de/downloads.

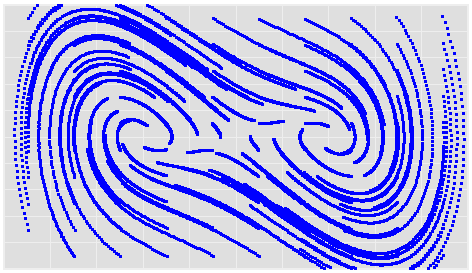
To tantalize you, here are some images of model output from Zoo 1. First, a phase map of a bistable oscillator, which was so interesting that I built one with my kids, using legos and neodymium magnets:

Continue reading “A System Zoo”

Cheese is Murder

Needlessly provocative title notwithstanding, the dairy industry has to be one of the most spectacular illustrations of the battle for control of system leverage points. In yesterday’s NYT:

Domino’s Pizza was hurting early last year. Domestic sales had fallen, and a survey of big pizza chain customers left the company tied for the worst tasting pies.

Then help arrived from an organization called Dairy Management. It teamed up with Domino’s to develop a new line of pizzas with 40 percent more cheese, and proceeded to devise and pay for a $12 million marketing campaign.

Consumers devoured the cheesier pizza, and sales soared by double digits. “This partnership is clearly working,” Brandon Solano, the Domino’s vice president for brand innovation, said in a statement to The New York Times.

But as healthy as this pizza has been for Domino’s, one slice contains as much as two-thirds of a day’s maximum recommended amount of saturated fat, which has been linked to heart disease and is high in calories.

And Dairy Management, which has made cheese its cause, is not a private business consultant. It is a marketing creation of the United States Department of Agriculture — the same agency at the center of a federal anti-obesity drive that discourages over-consumption of some of the very foods Dairy Management is vigorously promoting.

Urged on by government warnings about saturated fat, Americans have been moving toward low-fat milk for decades, leaving a surplus of whole milk and milk fat. Yet the government, through Dairy Management, is engaged in an effort to find ways to get dairy back into Americans’ diets, primarily through cheese.

Now recall Donella Meadows’ list of system leverage points:

Leverage points to intervene in a system (in increasing order of effectiveness)
12. Constants, parameters, numbers (such as subsidies, taxes, standards)
11. The size of buffers and other stabilizing stocks, relative to their flows
10. The structure of material stocks and flows (such as transport network, population age structures)
9. The length of delays, relative to the rate of system changes
8. The strength of negative feedback loops, relative to the effect they are trying to correct against
7. The gain around driving positive feedback loops
6. The structure of information flow (who does and does not have access to what kinds of information)
5. The rules of the system (such as incentives, punishment, constraints)
4. The power to add, change, evolve, or self-organize system structure
3. The goal of the system
2. The mindset or paradigm that the system – its goals, structure, rules, delays, parameters – arises out of
1. The power to transcend paradigms

The dairy industry has become a master at exercising these points, in particular using #4 and #5 to influence #6, resulting in interesting conflicts about #3.

Specifically, Dairy Management is funded by a “checkoff” (effectively a tax) on dairy output. That money basically goes to marketing of dairy products. A fair amount of that is done in stealth mode, through programs and information that appear to be generic nutrition advice, but happen to be funded by the NDC, CNFI, or other arms of Dairy Management. For example, there’s http://www.nutritionexplorations.org/ – for kids, they serve up pizza:

nutritionexplorations

That slice of “combination food” doesn’t look very nutritious to me, especially if it’s from the new Dominos line DM helped create. Notice that it’s cheese pizza, devoid of toppings. And what’s the gratuitous bowl of mac & cheese doing there? Elsewhere, their graphics reweight the food pyramid (already a grotesque product of lobbying science), to give all components equal visual weight. This systematic slanting of nutrition information is a nice example of my first deadly sin of complex system management.

A conspicuous target of dubious dairy information is school nutrition programs. Consider this, from GotMilk:

Flavored milk contributes only small amounts of added sugars to children ‘s diets. Sodas and fruit drinks are the number one source of added sugars in the diets of U.S. children and adolescents, while flavored milk provides only a small fraction (< 2%) of the total added sugars consumed.

It’s tough to fact-check this, because the citation doesn’t match the journal. But it seems likely that the statement that flavored milk provides only a small fraction of sugars is a red herring, i.e. that it arises because flavored milk is a small share of intake, rather than because the marginal contribution of sugar per unit flavored milk is small. Much of the rest of the information provided is a similar riot of conflated correlation and causation and dairy-sponsored research. I have to wonder whether innovations like flavored milk are helpful, because they displace sugary soda, or just one more trip around a big eroding goals loop that results in kids who won’t eat anything without sugar in it.

Elsewhere in the dairy system, there are price supports for producers at one end of the supply chain. At the consumer end, their are price ceilings, meant to preserve the affordability of dairy products. It’s unclear what this bizarre system of incentives at cross-purposes really delivers, other than confusion.

The fundamental problem, I think, is that there’s no transparency: no immediate feedback from eating patterns to health outcomes, and little visibility of the convoluted system of rules and subsidies. That leaves marketers and politicians free to push whatever they want.

So, how to close the loop? Unfortunately, many eaters appear to be uninterested in closing the loop themselves by actively seeking unbiased information, or even actively resist information contrary to their current patterns as the product of some kind of conspiracy. That leaves only natural selection to close the loop. Not wanting to experience that personally, I implemented my own negative feedback loop. I bought a cholesterol meter and modified my diet until I routinely tested OK. Sadly, that meant no more dairy.

Ultradian Oscillations of Insulin and Glucose

Citation: Jeppe Sturis, Kenneth S. Polonsky, Erik Mokilde, and Eve van Cauter. Computer Model for Mechanisms Underlying Ultradian Oscillations of Insulin and Glucose. Am. J. Physiol. 260 (Endocrinol. Metab. 23): E801-E809, 1991.

Source: Replicated by Hank Taylor

Units: No Yes!

Format: Vensim

Ultradian Oscillations of Insulin and Glucose (Vensim .vpm)

Update, 10/2017:

Refreshed, with units defined (mathematically the same as before): ultradia2.vpm ultradia2.mdl

Further refined, for initialization in equilibrium (insulin by analytic expression; glucose by parameter). Glucose infusion turned on by default. Graphs added.

ultradia-enhanced-3.mdl ultradia-enhanced-3.vpm

The Health Care Death Spiral

Paul Krugman documents an ongoing health care death spiral in California:

Here’s the story: About 800,000 people in California who buy insurance on the individual market — as opposed to getting it through their employers — are covered by Anthem Blue Cross, a WellPoint subsidiary. These are the people who were recently told to expect dramatic rate increases, in some cases as high as 39 percent.

Why the huge increase? It’s not profiteering, says WellPoint, which claims instead (without using the term) that it’s facing a classic insurance death spiral.

Bear in mind that private health insurance only works if insurers can sell policies to both sick and healthy customers. If too many healthy people decide that they’d rather take their chances and remain uninsured, the risk pool deteriorates, forcing insurers to raise premiums. This, in turn, leads more healthy people to drop coverage, worsening the risk pool even further, and so on.

A death spiral arises when a positive feedback loop runs as a vicious cycle. Another example is Andy Ford’s utility death spiral. The existence of the positive feedback leads to counter-intuitive policy prescriptions: Continue reading “The Health Care Death Spiral”

The Blood-Hungry Spleen

OK, I’ve stolen another title, this time from a favorite kids’ book. This post is really about the thyroid, which is a little less catchy than the spleen.

Your hormones are exciting!
They stir your body up.
They’re made by glands (called endocrine)
and give your body pluck.

Allan Wolf & Greg Clarke, The Blood-Hungry Spleen

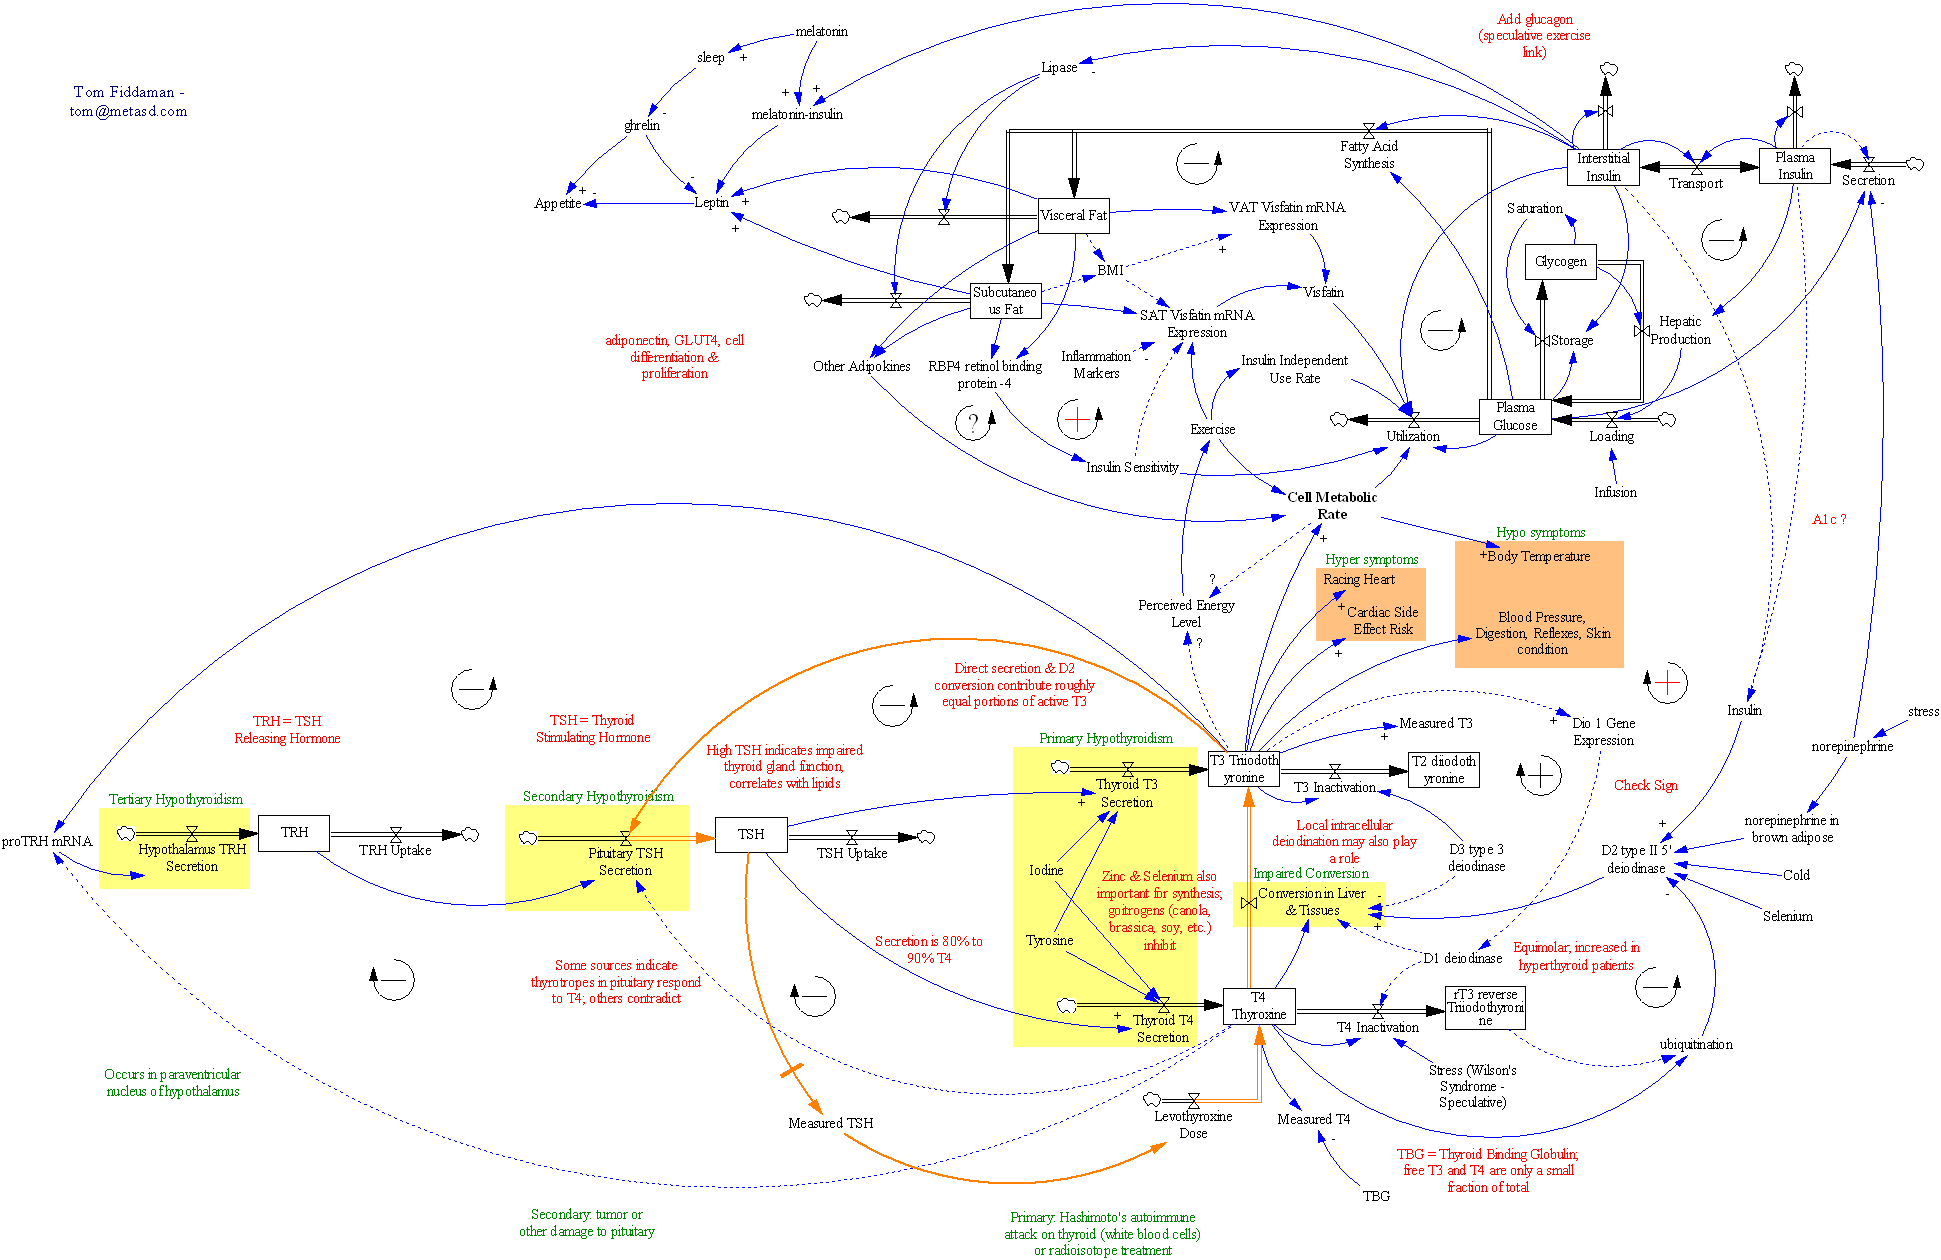
A friend has been diagnosed with hypothyroidism, so I did some digging on the workings of the thyroid. A few hours searching citations on PubMed, Medline and google gave me enough material to create this diagram:

Thyroid function and some associated feedbacks

(This is a LARGE image, so click through and zoom in to do it justice.)

The bottom half is the thyroid control system, as it is typically described. The top half strays into the insulin regulation system (borrowed from a classic SD model), body fat regulation, and other areas that seem related. A lot of the causal links above are speculative, and I have little hope of turning the diagram into a running model. Unfortunately, I can’t find anything in the literature that really digs into the dynamics of the system. In fact, I can’t even find the basics – how much stuff is in each stock, and how long does it stay there? There is a core of the system that I hope to get running at some point though:

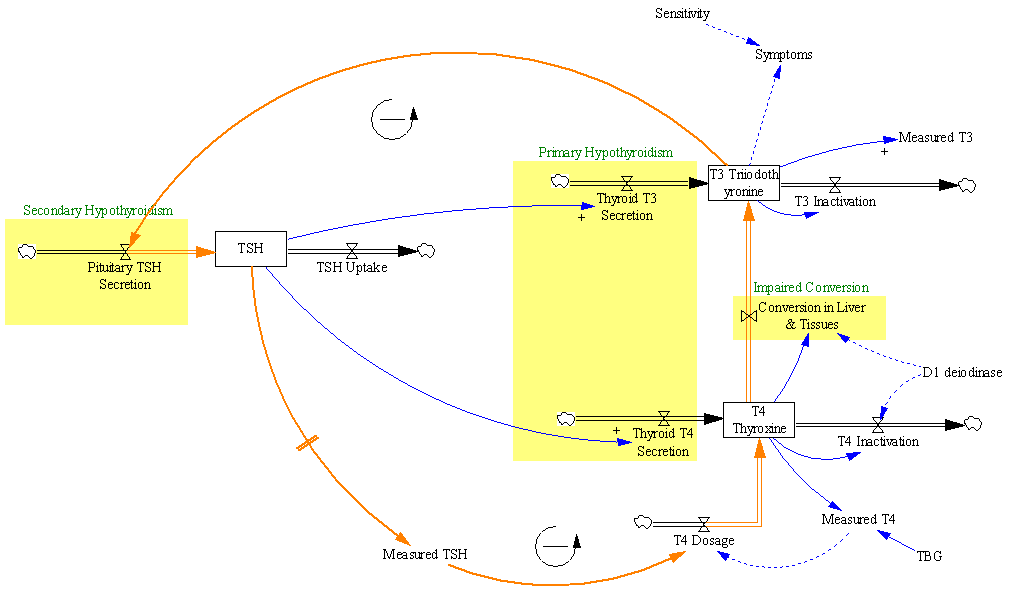
Thyroid - core regulation and dose titration

(another largish image)

This is the part of the system that’s typically involved in the treatment of hypothyroidism with synthetic hormone replacements. Normally, the body runs a negative feedback loop in which thyroid hormone levels (T3/T4) govern production of TSH, which in turn controls the production of T3 and T4. The problem begins when something (perhaps an autoimmune disease, i.e. Hashimoto’s) diminishes the thyroid’s ability to produce T3 and T4 (reducing the two inflows in the big yellow box at center). Then therapy seeks to replace the natural control loop, by adjusting a dose of synthetic T4 (levothyroxine) until the measured level of TSH (left stock structure) reaches a desired target.

This is a negative feedback loop with fairly long delays, so dosage adjustments are made only at infrequent intervals, in order to allow the system to settle between changes. Otherwise, you’d have the aggressive shower taker problem: water’s to cold, crank up the hot water … ouch, too hot, turn it way down … eek, too cold …. Measurements of T3 and T4 are made, but seldom paid much heed – the TSH level is regarded as the “gold standard.”

This black box approach to control is probably effective for many patients, but it leaves me feeling uneasy about several things. The “normal” range for TSH varies by an order of magnitude; what basis is there for choosing one or the other end of the range as a target? Wouldn’t we expect variation among patients in the appropriate target level? How do we know that TSH levels are a reliable indicator, if they don’t correlate well with T3/T4 levels or symptoms? Are extremely sparse measurements of TSH really robust to variability on various time scales, or is dose titration vulnerable to noise?

One could imagine alternative approaches to control, using direct measurements of T3 and T4, or indirect measurements (symptoms). Those might have the advantage of less delay (fewer confounding states between the goal state and the measured state). But T3/T4 measurements seem to be regarded as unreliable, which might have something to do with the fact that it’s hard to find any information on the scale or dynamics of their reservoirs. Symptoms also take a back seat; one paper even demonstrates fairly convincingly that dosage changes +/- 25% have no effect on symptoms (so why are we doing this again?).

I’d like to have a more systemic understanding of both the internal dynamics of the thyroid regulation system, and its interaction with symptoms, behaviors, and other regulatory systems. Here’s hoping that one of you lurkers (I know you’re out there) can comment with some thoughts or references.


So the spleen doesn’t feel shortchanged, I’ll leave you with another favorite:

Lovely
I think that I ain’t never seen
A poem ugly as a spleen.
A poem that could make you shiver
Like 3.5 … pounds of liver.
A poem to make you lose your lunch,
Tie your intestines in a bunch.
A poem all gray, wet, and swollen,
Like a stomach or a colon.
Something like your kidney, lung,
Pancreas, bladder, even tongue.
Why you turning green, good buddy?
It’s just human body study.

John Scieszka & Lane Smith, Science Verse