I got curious about the time series of earthquakes around the big one in Japan after a friend posted a link to the USGS quake map of the area.
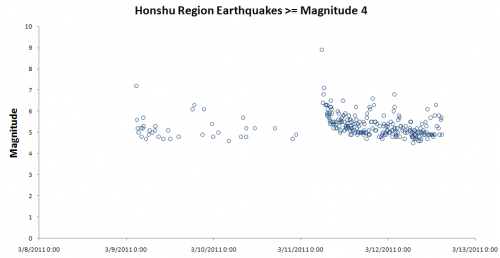
The data actually show a swarm of quakes before the big one – but looking at the data, it appears that those are a separate chain of events, beginning with a magnitude 7.2 on the 9th. By the 10th, it seemed like those events were petering out, though perhaps they set up the conditions for the 8.9 on the 11th. You can also see this on the USGS movie.
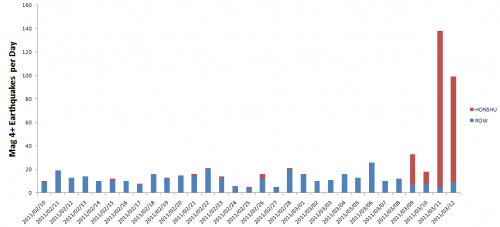
If you look at the event on a recent global scale, it’s amazingly big by count of events of significant magnitude:
(Honshu is the region USGS reports for the quake, and ROW = Rest of World; honshu.xlsx)
The graph looks similar if you make a rough translation to units of energy dissipated (which is proportional to magnitude^(3/2)). It would be interesting to see even longer time series, but I suspect that this is actually not surprising, given that earthquake magnitudes have a roughly power law distribution. The heavy tail means “expect the unexpected” – as with financial market movements.
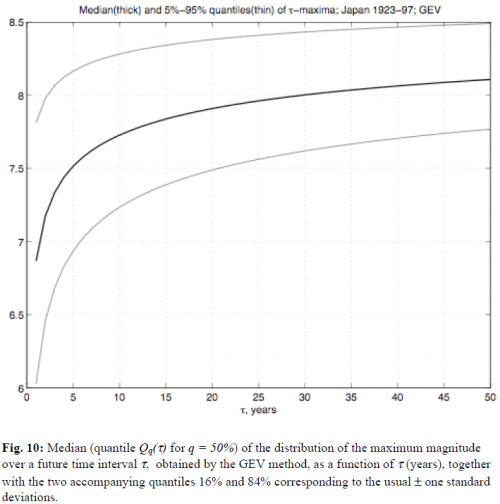
Interestingly, geophysicist-turned-econophysicist Didier Sornette, who famously predicted the bursting of the Shanghai bubble, and colleagues recently looked at Japan’s earthquake distribution and estimated distributions of future events. By their estimates, the 8.9 quake was quite extreme, even given the expectation of black swans:
The authors point out that predicting the frequency of earthquakes beyond the maximum magnitude in the data is problematic:
The main problem in the statistical study of the tail of the distribution of earthquake magnitudes (as well as in distributions of other rarely observable extremes) is the estimation of quantiles, which go beyond the data range, i.e. quantiles of level q > 1 – 1/n, where n is the sample size. We would like to stress once more that the reliable estimation of quantiles of levels q > 1 – 1/n can be made only with some additional assumptions on the behavior of the tail. Sometimes, such assumptions can be made on the basis of physical processes underlying the phenomena under study. For this purpose, we used general mathematical limit theorems, namely, the theorems of EVT. In our case, the assumptions for the validity of EVT boil down to assuming a regular (power-like) behavior of the tail 1 – F(m) of the distribution of earthquake magnitudes in the vicinity of its rightmost point Mmax. Some justification of such an assumption can serve the fact that, without them, there is no meaningful limit theorem in EVT. Of course, there is no a priori guarantee that these assumptions will hold in some concrete situation, and they should be discussed and possibly verified or supported by other means. In fact, because EVT suggests a statistical methodology for the extrapolation of quantiles beyond the data range, the question whether such interpolation is justified or not in a given problem should be investigated carefully in each concrete situation. But EVT provides the best statistical approach possible in such a situation.
Sornette also made some interesting remarks about self-organized criticality and quakes in a 1999 Nature debate.


