Does statistics trump physics?

My dissertation was a critique and reconstruction of William Nordhaus’ DICE model for climate-economy policy (plus a look at a few other models). I discovered a lot of issues, for example that having a carbon cycle that didn’t conserve carbon led to a low bias in CO2 projections, especially in high-emissions scenarios.

There was one sector I didn’t critique: the climate itself. That’s because Nordhaus used an established model, from climatologists Schneider & Thompson (1981). It turns out that I missed something important: Nordhaus reestimated the parameters of the model from time series temperature and forcing data.

Nordhaus’ estimation focused on a parameter representing the thermal inertia of the atmosphere/surface ocean system. The resulting value was about 3x higher than Schneider & Thompson’s physically-based parameter choice. That delays the effects of GHG emissions by about 15 years. Since the interest rate in the model is about 5%, that lag substantially diminishes the social cost of carbon and the incentive for mitigation.

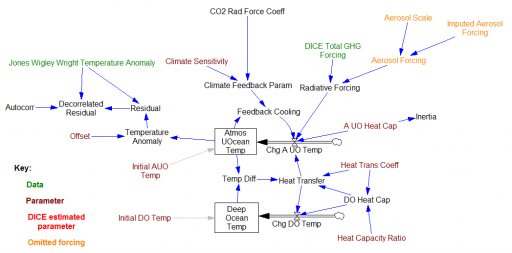
DICE Climate Sector
The climate subsystem of the DICE model, implemented in Vensim

So … should an economist’s measurement of a property of the climate, from statistical methods, overrule a climatologist’s parameter choice, based on physics and direct observations of structure at other scales?

I think the answer could be yes, IF the statistics are strong and reconcilable with physics or the physics is weak and irreconcilable with observations. So, was that the case?

Continue reading “Does statistics trump physics?”

DICE

This is a replication of William Nordhaus’ original DICE model, as described in Managing the Global Commons and a 1992 Science article and Cowles Foundation working paper that preceded it.

There are many good things about this model, but also some bad. If you are thinking of using it as a platform for expansion, read my dissertation first.

Units balance.

I provide several versions:

  1. Model with simple heuristics replacing the time-vector decisions in the original; runs in Vensim PLE
  2. Full model, with decisions implemented as vectors of points over time; requires Vensim Pro or DSS
  3. Same as #2, but with VECTOR LOOKUP replaced with VECTOR ELM MAP; supports earlier versions of Pro or DSS
    • DICE-vec-6-elm.mdl (you’ll also want a copy of DICE-vec-6.vpm above, so that you can extract the supporting optimization control files)

Note that there may be minor variances from the published versions, e.g. that transversality coefficients for the state variables (i.e. terminal values of the states for optimization) are not included. The optimizations use fewer time decision points than the original GAMS equivalents. These do not have any significant effect on the outcome.

The elusive MAC curve

Marginal Abatement Cost (MAC) curves are a handy way of describing the potential for and cost of reducing energy consumption or GHG emissions. McKinsey has recently made them famous, but they’ve been around, and been debated, for a long time.
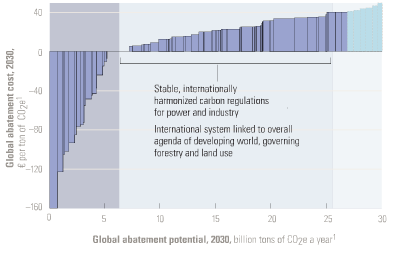
McKinsey MAC 2.0

One version of the McKinsey MAC curve

Five criticisms are common:

1. Negative cost abatement options don’t really exist, or will be undertaken anyway without policy support. This criticism generally arises from the question begged by the Sweeney et al. MAC curve below: if the leftmost bar (diesel anti-idling) has a large negative cost (i.e. profit opportunity) and is price sensitive, why hasn’t anyone done it? Where are those $20 bills on the sidewalk? There is some wisdom to this, but you have to drink pretty deeply of the neoclassical economic kool aid to believe that there really are no misperceptions, institutional barriers, or non-climate externalities that could create negative cost opportunities.
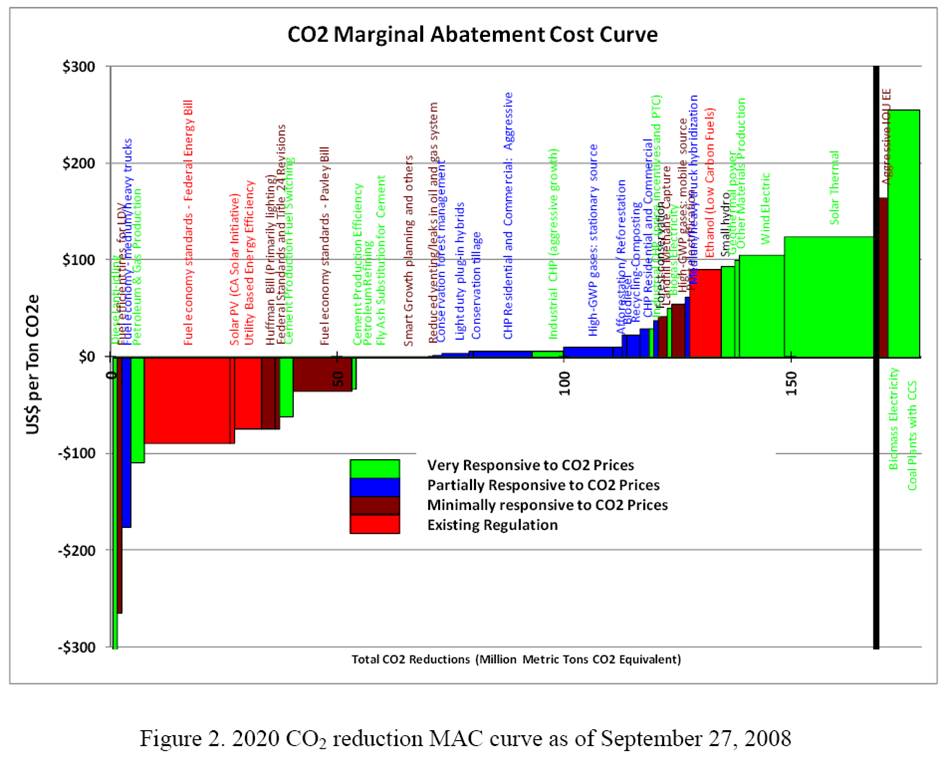
Sweeney et al. California MAC curve

Sweeney, Weyant et al. Analysis of Measures to Meet the Requirements of California’s Assembly Bill 32

The neoclassical perspective is evident in AR4, which reports results primarily of top-down, equilibrium models. As a result, mitigation costs are (with one exception) positive:
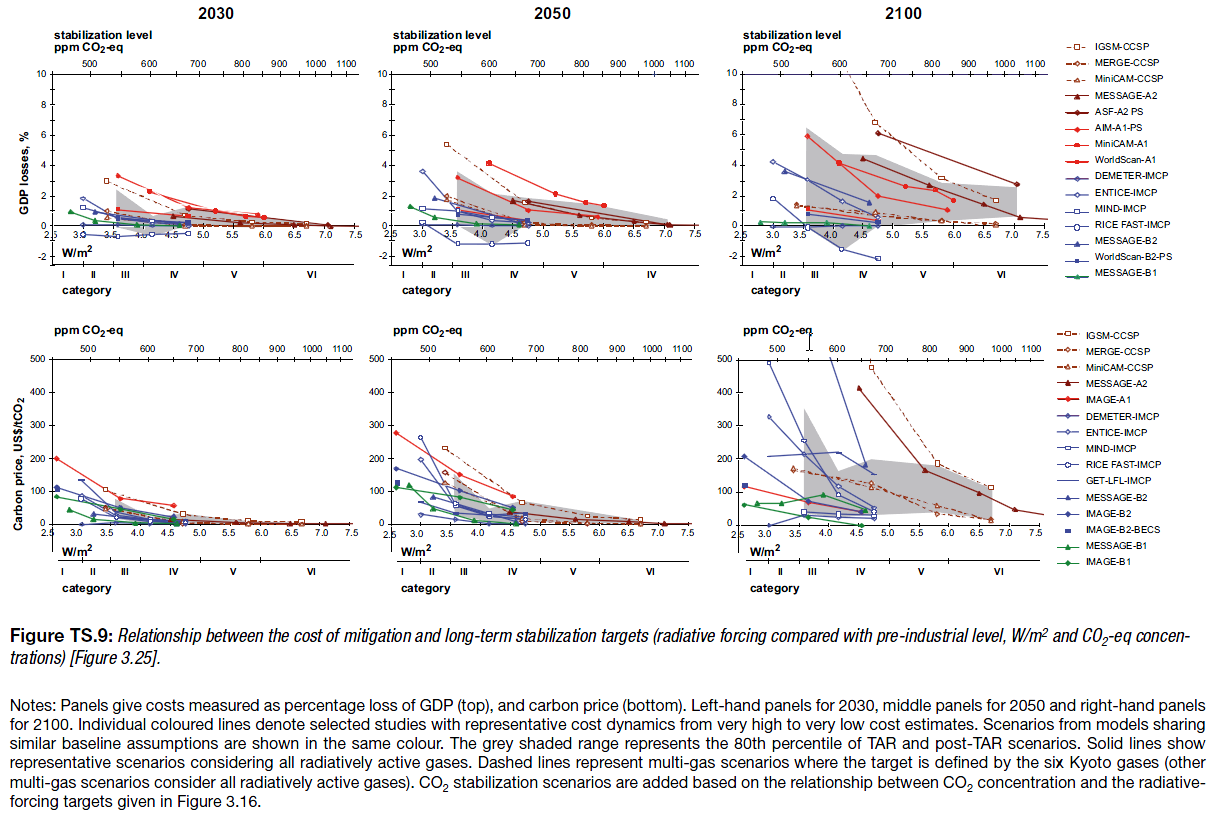
AR4 WG3 TS fig. TS.9, implicit MAC curves

AR4 WG3 TS fig. TS-9

Note that these are top-down implicit MAC curves, derived by exercising aggregate models, rather than bottom-up curves constructed from detailed menus of technical options.

2. The curves employ static assumptions, that might not come true. For example, I’ve heard that the McKinsey curves assume $60/bbl oil. This criticism is true, but could be generalized to more or less any formal result that’s presented as a figure rather than an interactive model. I regard it as a caveat rather than a flaw.

3. The curves themselves are static, while reality evolves. I think the key issue here is that technology evolves endogenously, so that to some extent the shape of the curve in the future will depend on where we choose to operate on the curve today. There are also 2nd-order, market-mediated effects (related to #2 as well): a) exploiting the curve reduces energy demand, and thus prices, which changes the shape of the curve, and b) changes in GHG prices or other policies used to drive exploitation of the curve influence prices of capital and other factors, again changing the shape of the curve.

4. The notion of “supply” is misleading or incomplete. Options depicted on a MAC curve typically involve installing some kind of capital to reduce energy or GHG use. But that installation depends on capital turnover, and therefore is available only incrementally. The rate of exploitation is more difficult to pin down than the maximum potential under idealized conditions.

5. A lot of mitigation falls through the cracks. There are two prongs to this criticism: bottom-up, and top-down. Bottom-up models, because they employ a menu of known technologies, inevitably overlook some existing or potential options that might materialize in reality (with the incentive of GHG prices, for example). That error is, to some extent, offset by over-optimism about other technologies that won’t materialize. More importantly, a menu of supply and end use technology choices is an incomplete specification of the economy; there’s also a lot of potential for changes in lifestyle and substitution of activity among economic sectors. Today’s bottom-up MAC curve is essentially a snapshot of how to do what we do now, with fewer GHGs. If we’re serious about deep emissions cuts, the economy may not resemble what we’re doing now very much  in 40 years. Top down models capture the substitution potential among sectors, but still take lifestyle as a given and (mostly) start from a first-best equilibrium world, devoid of mitigation options arising from the frailty of human, institutional, and market failures.

To get the greenhouse gas MAC curve right, you need a model that captures bottom-up and top-down aspects of the economy, with realistic dynamics and agent behavior, endogenous technology, and non-climate externalities all included. As I see it, mainstream integrated assessment models are headed down some of those paths (endogenous technology), but remain wedded to the equilibrium/optimization perspective. Others (including us at Ventana) are exploring other avenues, but it’s a hard road to hoe.

In the meantime, we’re stuck with a multitude of perspectives on mitigation costs. Here are a few from the WCI, compiled by Wei and Rose from partner jurisdictions’ Climate Action Team reports and other similar documents:
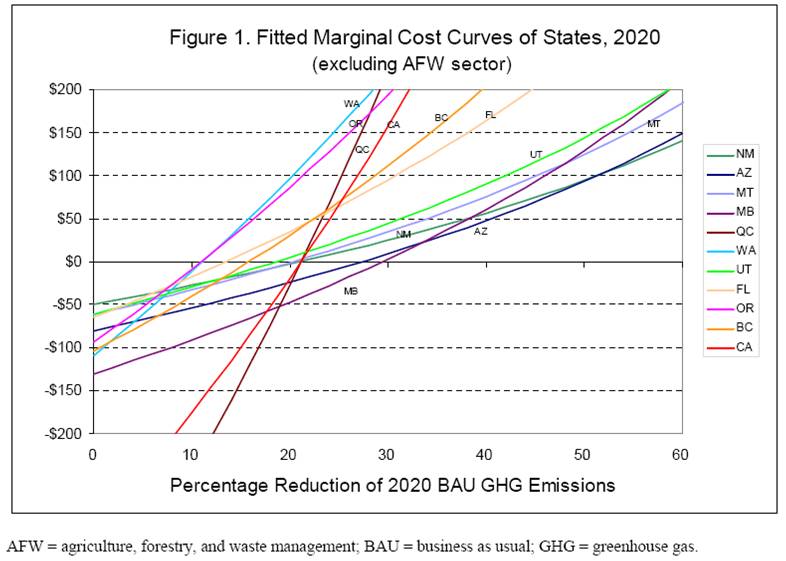
WCI partner MAC curves

Wei & Rose, Preliminary Cap & Trade Simulation of Florida Joining WCI

The methods used to develop the various partner options differ, so these curves reflect diverse beliefs rather than a consistent comparison. What’s striking to me is that the biggest opportunities (are perceived to) exist in California, which already has (roughly) the lowest GHG intensity and most stringent energy policies among the partners. Economics 101 would suggest that California might already have exploited the low-hanging fruit, and that greater opportunity would exist, say, here in Montana, where energy policy means low taxes and GHG intensity is extremely high.

For now, we have to live with the uncertainty. However, it seems obvious that an adaptive strategy for discovering the true potential for mitigation is easy. No matter who you beleive, the cost of the initial increment of emissions reductions is either small (<<1% of GDP) or negative, so just put a price on GHGs and see what happens.
Next Generation Climate Policy Models

Today I’m presenting a talk at an ECF workshop, Towards the next generation of climate policy models. The workshop’s in Berlin, but I’m staying in Montana, so my carbon footprint is minimal for this one (just wait until next month …). My slides are here: Towards Next Generation Climate Policy Models.

I created a set of links to supporting materials on del.icio.us.

Update Workshop materials are now on a web site here.

Ethics, Equity & Models

I’m at the 2008 Balaton Group meeting, where a unique confluence of modeling talent, philosophy, history, activist know-how, compassion and thirst for sustainability makes it hard to go 5 minutes without having a Big Idea.

Our premeeting tackled Ethics, Values, and the Next Generation of Energy and Climate Modeling. I presented a primer on discounting and welfare in integrated assessment modeling, based on a document I wrote for last year’s meeting, translating some of the issues raised by the Stern Review and critiques into plainer language. Along the way, I kept a running list of assumptions in models and modeling processes that have ethical/equity implications.

There are three broad insights:

  1. Technical choices in models have ethical implications. For example, choices about the representation of technology and resource constraints determine whether a model explores a parameter space where “growing to help the poor” is a good idea or not.
  2. Modelers’ prescriptive and descriptive uses of discounting and other explicit choices with ethical implications are often not clearly distinguished.
  3. Decision makers have no clue how the items above influence model outcomes, and do not in any case operate at that level of description.

My list of ethical issues is long and somewhat overlapping. Perhaps in part that is due to the fact that I compiled it with no clear definition of ‘ethics’ in mind. However, I think it’s also due to the fact that there are inevitably large gray areas in practice, accentuated by the fact that the issue doesn’t receive much formal attention. Here goes: Continue reading “Ethics, Equity & Models”

SRES – We've got a bigger problem now

Recently Pielke, Wigley and Green discussed the implications of autonomous energy efficiency improvements (AEEI) in IPCC scenarios, provoking many replies. Some found the hubbub around the issue surprising, because the assumptions concerned were well known, at least to modelers. I was among the surprised, but sometimes the obvious needs to be restated loud and clear. I believe that there are several bigger elephants in the room that deserve such treatment. AEEI is important, as are other hotly debated SRES choices like PPP vs. MEX, but at the end of the day, these are just parameter choices. In complex systems parameter uncertainty generally plays second fiddle to structural uncertainty. Integrated assessment models (IAMs) as a group frequently employ similar methods, e.g., dynamic general equilibrium, and leave crucial structural assumptions untested. I find it strange that the hottest debates surround biogeophysical models, which are actually much better grounded in physical principles, when socio-economic modeling is so uncertain.

Continue reading “SRES – We've got a bigger problem now”

Dangerous Assumptions

Roger Pielke Jr., Tom Wigley, and Christopher Green have a nice commentary in this week’s Nature. It argues that current scenarios are dangerously reliant on business-as-usual technical improvement to reduce greenhouse gas intensity:

Here we show that two-thirds or more of all the energy efficiency improvements and decarbonization of energy supply required to stabilize greenhouse gases is already built into the IPCC reference scenarios. This is because the scenarios assume a certain amount of spontaneous technological change and related decarbonization. Thus, the IPCC implicitly assumes that the bulk of the challenge of reducing future emissions will occur in the absence of climate policies. We believe that these assumptions are optimistic at best and unachievable at worst, potentially seriously underestimating the scale of the technological challenge associated with stabilizing greenhouse-gas concentrations.

They note that assumed rates of decarbonization exceed reality:

The IPCC scenarios include a wide range of possibilities for the future evolution of energy and carbon intensities. Many of the scenarios are arguably unrealistic and some are likely to be unachievable. For instance, the IPCC assumptions for decarbonization in the short term (2000’“2010) are already inconsistent with the recent evolution of the global economy (Fig. 2). All scenarios predict decreases in energy intensity, and in most cases carbon intensity, during 2000 to 2010. But in recent years, both global energy intensity and carbon intensity have risen, reversing the trend of previous decades.

In an accompanying news article, several commenters object to the notion of a trend reversal:

Energy efficiency has in the past improved without climate policy, and the same is very likely to happen in the future. Including unprompted technological change in the baseline is thus logical. It is not very helpful to discredit emission scenarios on the sole basis of their being at odds with the most recent economic trends in China. Chinese statistics are not always reliable. Moreover, the period in question is too short to signify a global trend-break. (Detlef van Vuuren)

Having seen several trend breaks evaporate, including the dot.com productivity miracle and the Chinese emissions reductions coincident with the Asian crisis, I’m inclined to agree that gloom may be premature. On the other hand, Pielke, Wigley and Green are conservative in that they don’t consider the possible pressure for recarbonization created by a transition from conventional oil and gas to coal and tar sands. A look at the long term is helpful:

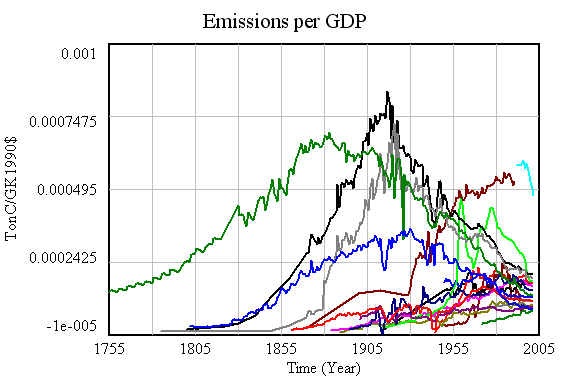
18 country emissions intensity

Emissions intensity of GDP for 18 major emitters. Notice the convergence in intensity, with high-intensity nations falling, and low-intensity nations (generally less-developed) rising.

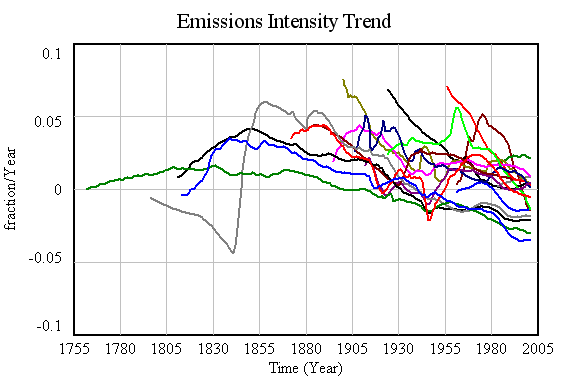
Emissions intensity trend for 18 major emitters

Corresponding decadal trends in emissions intensity. Over the long haul, there’s some indication that emissions are falling faster in developed nations – a reason for hope. But there’s also a lot of diversity, and many nations have positive trends in intensity. More importantly, even with major wars and depressions, no major emitter has achieved the kind of intensity trend (about -7%/yr) needed to achieve 80% emissions reductions by 2050 while sustaining 3%/yr GDP growth. That suggests that achieving aggressive goals may require more than technology, including – gasp – lifestyle changes.

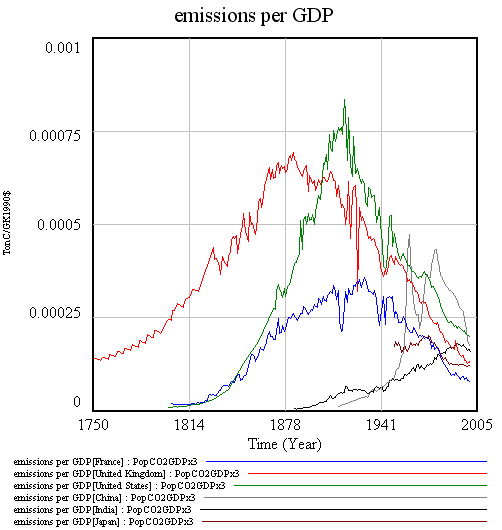
6 country emissions intensity

A closer look at intensity for 6 major emitters. Notice intensity rising in China and India until recently, and that Chinese data is indeed suspect.

Pielke, Wigley, and Green wrap up:

There is no question about whether technological innovation is necessary ’” it is. The question is, to what degree should policy focus directly on motivating such innovation? The IPCC plays a risky game in assuming that spontaneous advances in technological innovation will carry most of the burden of achieving future emissions reductions, rather than focusing on creating the conditions for such innovations to occur.

There’s a second risky game afoot, which is assuming that “creating the conditions for such innovations to occur” means investing in R&D, exclusive of other measures. To achieve material reductions in emissions, “occur” must mean “be adopted” not just “be invented.” Absent market signals and institutional changes, it is unlikely that technologies like carbon sequestration will ever be adopted. Others, like vehicle and lighting efficiency, could easily see their gains eroded by increased consumption of energy services, which become cheaper as technology improves productivity.