
At the top, the US coronavirus response seems to be operating with (at least) two misperceptions. First, that border control works. Second, that a lower fatality rate means fewer deaths. Here’s how it really works.
Consider an extremely simplified SEIRD model. This is a generalization of the simple SIR framework to include asymptomatic, non-infective Exposed people and the Deceased:
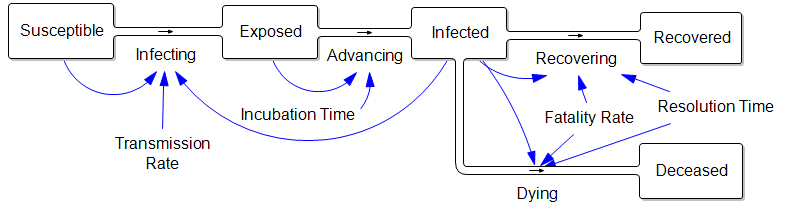
The parameters are such that the disease takes about a week to incubate, and about a week to resolve. The transmission rate is such that cases double about once a week, if left uncontrolled.
Those fortuitous time constants make it really simple to model the spread in discrete time. First, abstract away the susceptible (who are abundant early in the epidemic) and the resolved cases (which are few and don’t participate further):
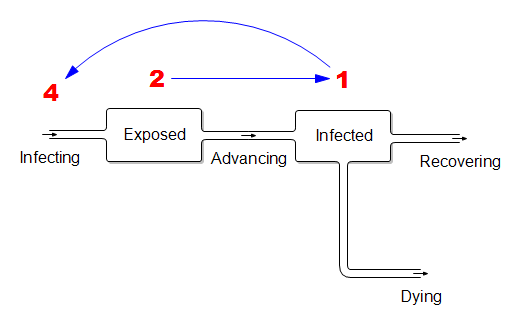
In this dirt-simple model,
- This week’s infected will all resolve
- This week’s exposed will advance to become next week’s infected
- Next week’s exposed are the ones the current infected are infecting now.
If the disease is doubling weekly, then for every 1 infected person there must be 2 exposed people in the pipeline. And each of those infected people must expose 4 others. (Note that this is seemingly an R0 of 4, which is higher than what’s usually quoted, but the difference is partly due to discrete vs. continuous compounding. The R0 of 2.2 that’s currently common seems too low to fit the data though – more on that another time.)
What does this imply for control strategy? It means that, on the day you close the border, the infected arrivals you’ve captured and isolated understate the true problem. For every infected person, there are two exposed people on the loose, initiating domestic community spread. Because it’s doubling weekly, community infections very quickly replace the imports, even if a travel ban is 100% effective.
Mild Cases
Now consider the claim that the fatality rate is much lower than reported, because there are many unobserved mild cases:
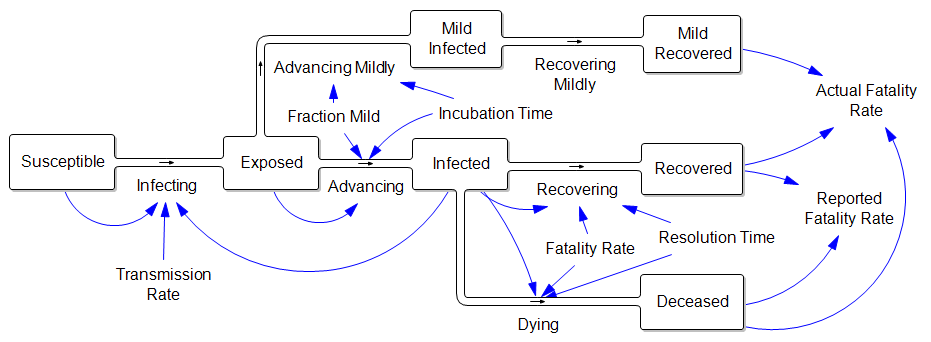
In other words, the reported fatality rate is Deceased/(Recovered+Deceased), but the “real” fatality rate is Deceased/(Recovered+Deceased+Mild Recovered). That’s great, but where did all those mild cases come from? If they are sufficiently numerous to dilute the fatality rate by, say, a factor of 10, then there must also be 9 people with mild infections going undetected for every known infected case. That doesn’t help the prognosis for deaths a bit, because (one tenth the fatality rate) x (ten times the cases) yields the same outcome. Actually, this makes the border control and community containment problem much harder, because there are now 10x as many contacts to trace and isolate. Fortunately this appears to be pure speculation.
Dear Tom,
I don’t thing the question do border controls work should be the focus, here in Europe is seems that this question is getting answered more and more. Nassim Taleb claims that with a 30% decrease in mobility (on a country level and between countries) the virus can be under control.
The above model should include one thing, and that is the fact that the recovered can go back to the infected stock. As some data from China shows. There is a terrible article in Fortune: Why are patients who recover from coronavirus testing positive again?, they missed the point. If this flow is as some expect to be close to 10% (in China and Iran) the above model is not caching the right dynamics. Are relatively young people who had the coronavirus the first time and then get it again is their immune system impaired for the following weeks after the first time. I live in Serbia and here if enough people get infected, doe to the shortage of available beds and respirators (which is extremely low) the fatality rate might increase exponentially. These nonlinearities should be the focus. This is a extremely interesting topic for a publication, and a extremely scary topic if you live in a country whit a bad healthcare system.
I haven’t seen what Taleb said specifically, but I don’t believe 30% does the job. To reduce the reproduction ratio to 1 or less, transmission has to fall by 1-1/R0. That’s 50% for the most optimistic R0 estimates. I think it’s at least 3.3, which requires a 70% reduction.
Anyway, the point about recurrence is interesting. I saw one paper from China that genetically ID’ed two strains – that might be one cause. I had assumed that there might be recurrence next year – beyond the horizon I was modeling – but sooner is problematic.
The bed-fatality nonlinearity does seem really important. I may address that next. Thanks for the thoughts!
Good article, Tom.
Speaking of genetic tracing, have you seen Trevor Bedford’s work at Fred Hutch (https://twitter.com/search?q=trevor%20bedford&src=typed_query)? https://nextstrain.org/ is interesting, too.
Dear Tom,
Some quick thoughts on your model (and the initial discussion). The first two are knit-picky questions about the assumptions in the model–sorry in-advance–while the last two might be worth considering while discussing later iterations of the model. That is… if there are going to be later iterations!
1. Do the people in your “Mild Infected” stock contribute the “Infecting” flow? From your description above, I assume so. However, there seems to be an arrow missing in the diagram that goes from “Mild Infected” to “Infecting”. Are they as infectious as someone who is in the “Infected” stock?
2. Is using “resolution time” in your “Dying” flow the best representation for the avg. time between the “Infected” and “Deceased” stocks? I’m not as familiar with the literature as I’d like to be, but some estimates I’ve seen suggest that differences exist. While I have yet to re-create your model in Vensim, I wonder how (if at all) these differences might alter your discussion above?
3. Is there any difference between the model’s exogenous “Fatality Rate” and your calculated “Reported” and “Actual” fatality rates? For me, the “Fatality Rate” that governs the flows out of the “Infected” stock is the model’s representation of the “true” fatality rate, while your “Reported” and “Actual” rates are estimates of it. I think this could be a great opportunity to highlight the difference between (again, if any exist) between the “truth” (an exogenous constant) and our representation of it, given different assumptions. How close do we get to the “real” fatality rate? Does that even matter?
4. The extent of “Reinfection” with this virus is puzzling. However, a far as I can tell, it’s a question of “do people get reinfected?” vs. “have they really cleared infection in the first place?” For me, the focus returns to the reliability of what we’re observing vs. what’s actually happening. However, this is where simulation using a few different models might become extremely informative.
I hope my comments haven’t “missed the mark” for the model’s current purpose. As an epidemiologist, there’s a few places my brain goes automatically.
All the best,
David
Hi David –
Good thoughts. I’ll be posting more on this very soon – including models.
1. Good catch – you’re right, there should be an arrow. Presumably less-sick people are less infectious, but I haven’t seen any literature on that. Also, there appears to be some infectivity from the exposed asymptomatic stock. One thing I haven’t run through the math on is what mild cases due to the ultimate cumulative incidence – presumably they consume some susceptibles who would otherwise end up in the observed pathway, so the peak is lower. But I would think that happens late in the game – long after you’d hope to have things under control.
2. For sure the single resolution time is a big simplification. It would be better to disaggregate serious cases, because they have a longer duration.
3. The “Fatality Rate” on the diagram is the actual fraction of cases who ultimately die, among the cases serious enough to be noticed. With this simple system, the “Reported Fatality Rate” would be equal to that, but adding your consideration about durations in #2 would change that. Fatalities would then take longer to “arrive” and therefore early fatality reports would understate the truth. But either way, unobserved mild cases would dilute the rates, but not the absolute fatalities, if they could be seen.
4. Right. A related question that seems important to me is the question of seasonality – is this going to die out when it warms up, then come back because people have lost any immunity, or will it rage on?
I think your comments are right on. The bits I posted here were really directed fairly narrowly at the flawed ideas that travel bans and mild cases will save us, but they’re really important for a more realistic model.
re #4: There is a paper coming from the US (CDC?) late last week indicating that there will not be any significant seasonality. Not good. Also not good that I cannot find it.
Some data fun: A comparison of the currently reported mortality rates within the EU has Italy running at 6.5% and Germany at 0.2%. Which parameters explain the difference?
– Germany was among the first to develop a test and immediately kicked-off to decentralized mass production. (Thus, avoiding problems in case of a central facility is screwing up) All identified cases got tracked down as far as possible with all known contacts getting quarantined and tested. With enough test kits available, Germany has tested more young people, even those not yet showing symptoms, than any other country.
– Italy is testing deceased persons with most of the dead being over 80 years of age. Other countries are hesitant to test elderly people with preconditions, especially those with limited life expectancy to save tests. In general, attributing the cause of death in cases with multiple diseases differs between countries.
– The hospitals in Italy got overrun by the caseload which further spikes mortality rates. Germany would be able to process higher caseloads as after H1N1 the number of (mobile) respirators got increased significantly to mitigate for an identified bottle neck.
#4: I linked a paper with seasonal scenarios on my Coronavirus Roundup post – in the comments, I think. They showed data indicating that other cov’s have strong seasonality. If that’s not true, it’s the worst news I’ve heard all day. A summer reprieve would be a huge benefit to the north. Luckily it’s only 7:30am so things can change.
The death rate difference is interesting. It’s discouraging that the US rate is running above 3% already. But we’re also in the limited testing category.
I think the reference is to this paper: https://www.medrxiv.org/content/10.1101/2020.03.04.20031112v1
which is in line with this one
https://www.medrxiv.org/content/10.1101/2020.02.13.20022806v1.full.pdf
Based on the research the German government is now expecting a continuous ramp up with peak June to August. The lead scientists are pretty transparent that they are running detailed policy models which govern the reaction but there is still a lot of uncertainty about the virus so the parametrization is not stable and things have changed for the worse.