Fuzzy VISION

Like spreadsheets, open-loop models are popular but flawed tools. An open loop model is essentially a scenario-specification tool. It translates user input into outcomes, without any intervening dynamics. These are common in public discourse. An example turned up in the very first link when I googled “regional growth forecast”:

The growth forecast is completed in two stages. During the first stage SANDAG staff produces a forecast for the entire San Diego region, called the regionwide forecast. This regionwide forecast does not include any land use constraints, but simply projects growth based on existing demographic and economic trends such as fertility rates, mortality rates, domestic migration, international migration, and economic prosperity.

In other words, there’s unidirectional causality from inputs  to outputs, ignoring the possible effects of the outputs (like prosperity) on the inputs (like migration). Sometimes such scenarios are useful as a starting point for thinking about a problem. However, with no estimate of the likelihood of realization of such a scenario, no understanding of the feedback that would determine the outcome, and no guidance about policy levers that could be used to shape the future, such forecasts won’t get you very far (but they might get you pretty deep – in trouble).

The key question for any policy, is “how do you get there from here?” Models can help answer such questions. In California, one key part of the low-carbon fuel standard (LCFS) analysis was VISION-CA. I wondered what was in it, so I took it apart to see. The short answer is that it’s an open-loop model that demonstrates a physically-feasible path to compliance, but leaves the user wondering what combination of vehicle and fuel prices and other incentives would actually get consumers and producers to take that path.

First, it’s laudable that the model is publicly available for critique, and includes macros that permit replication of key results. That puts it ahead of most analyses right away. Unfortunately, it’s a spreadsheet, which makes it tough to know what’s going on inside.

I translated some of the model core to Vensim for clarity. Here’s the structure:
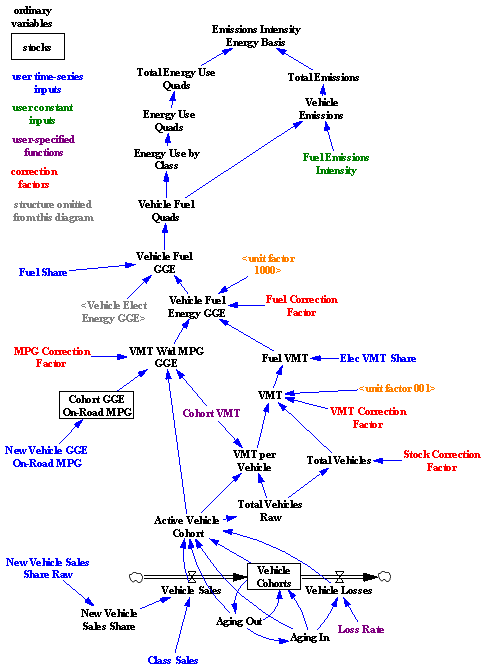
VISION-CA

Bringing the structure into the light reveals that it’s basically a causal tree – from vehicle sales, fuel efficiency, fuel shares, and fuel intensity to emissions. There is one pair of minor feedback loops, concerning the aging of the fleet and vehicle losses. So, this is a vehicle accounting tool that can tell you the consequences of a particular pattern of new vehicle and fuel sales. That’s already a lot of useful information. In particular, it enforces some reality on scenarios, because it imposes the fleet turnover constraint, which imposes a delay in implementation from the time it takes for the vehicle capital stock to adjust. No overnight miracles allowed.

What it doesn’t tell you is whether a particular measure, like an LCFS, can achieve the desired fleet and fuel trajectory with plausible prices and other conditions. It also can’t help you to decide whether an LCFS, emissions tax, or performance mandate is the better policy. That’s because there’s no consumer choice linking vehicle and fuel cost and performance, consumer knowledge, supplier portfolios, and technology to fuel and vehicle sales. Since equilibrium analysis suggests that there could be problems for the LCFS, and disequilibrium generally makes things harder rather than easier, those omissions are problematic.

Continue reading “Fuzzy VISION”

The Trouble with Spreadsheets

As a prelude to my next look at alternative fuels models, some thoughts on spreadsheets.

Everyone loves to hate spreadsheets, and it’s especially easy to hate Excel 2007 for rearranging the interface: a productivity-killer with no discernible benefit. At the same time, everyone uses them. Magne Myrtveit wonders, Why is the spreadsheet so popular when it is so bad?

Spreadsheets are convenient modeling tools, particularly where substantial data is involved, because numerical inputs and outputs are immediately visible and relationships can be created flexibly. However, flexibility and visibility quickly become problematic when more complex models are involved, because:

  • Structure is invisible and equations, using row-column addresses rather than variable names, are sometimes incomprehensible.
  • Dynamics are difficult to represent; only Euler integration is practical, and propagating dynamic equations over rows and columns is tedious and error-prone.
  • Without matrix subscripting, array operations are hard to identify, because they are implemented through the geography of a worksheet.
  • Arrays with more than two or three dimensions are difficult to work with (row, column, sheet, then what?).
  • Data and model are mixed, so that it is easy to inadvertently modify a parameter and save changes, and then later be unable to easily recover the differences between versions. It’s also easy to break the chain of causality by accidentally replacing an equation with a number.
  • Implementation of scenario and sensitivity analysis requires proliferation of spreadsheets or cumbersome macros and add-in tools.
  • Execution is slow for large models.
  • Adherence to good modeling practices like dimensional consistency is impossible to formally verify

For some of the reasons above, auditing the equations of even a modestly complex spreadsheet is an arduous task. That means spreadsheets hardly ever get audited, which contributes to many of them being lousy. (An add-in tool called Exposé can get you out of that pickle to some extent.)

There are, of course, some benefits: spreadsheets are ubiquitous and many people know how to use them. They have pretty formatting and support a wide variety of data input and output. They support many analysis tools, especially with add-ins.

For my own purposes, I generally restrict spreadsheets to data pre- and post-processing. I do almost everything else in Vensim or a programming language. Even seemingly trivial models are better in Vensim, mainly because it’s easier to avoid unit errors, and more fun to do sensitivity analysis with Synthesim.

LCFS in Equilibrium II

My last post introduced some observations from simulation of an equilibrium fuel portfolio standard model:

  • knife-edge behavior of market volume of alternative fuels as you approach compliance limits (discussed last year): as the required portfolio performance approaches the performance of the best component options, demand for those approaches 100% of volume rapidly.
  • differences in the competitive landscape for technology providers, when compared to alternatives like a carbon tax.
  • differences in behavior under uncertainty.
  • perverse behavior when the elasticity of substitution among fuels is low

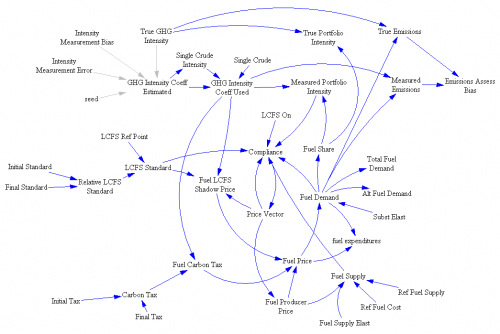
Here are some of the details. First, the model:

structure

Notice that this is not a normal SD model – there are loops but no stocks. That’s because this is a system of simultaneous equations solved in equilibrium. The Vensim FIND ZERO function is used to find a vector of prices (one for each fuel, plus the shadow price of emissions intensity) that matches supply and demand, subject to the intensity constraint.

Continue reading “LCFS in Equilibrium II”

How to critique a model (and build a model that withstands critique)

Long ago, in the MIT SD PhD seminar, a group of us replicated and critiqued a number of classic models. Some of those formed the basis for my model library. Around that time, Liz Keating wrote a nice summary of “How to Critique a Model.” That used to be on my web site in the mid-90s, but I lost track of it. I haven’t seen an adequate alternative, so I recently tracked down a copy. Here it is: SD Model Critique (thanks, Liz). I highly recommend a look, especially with the SD conference paper submission deadline looming.

A Tale of Three Models – LCFS in Equilibrium

This is the first of several posts on models of the transition to alternative fuel vehicles. The first looks at a static equilibrium model of the California Low Carbon Fuel Standard (LCFS). Another will look at another model of the LCFS, called VISION-CA, which generates fuel carbon intensity scenarios. Finally, I’ll discuss Jeroen Struben’s thesis, which is a full dynamic model that closes crucial loops among vehicle fleets, consumer behavior, fueling infrastructure, and manufacturers’ learning. At some point I will try to put the pieces together into a general reflection on alt fuel policy.

Those who know me might be surprised to see me heaping praise on a static model, but I’m about to do so. Not every problem is dynamic, and sometimes a comparative statics exercise yields a lot of insight.

In a no-longer-so-new paper, Holland, Hughes, and Knittel work out the implications of the LCFS and some variants. In a nutshell, a low carbon fuel standard is one of a class of standards that requires providers of a fuel (or managers of some kind of portfolio) to meet some criteria on average – X grams of carbon per MJ of fuel energy, or Y% renewable content, for example. If trading is allowed (fun, no?), then the constraint effectively applies to the market portfolio as a whole, rather than to individual providers, which should be more efficient. The constraint in effect requires the providers to set up an internal tax and subsidy system – taxing products that don’t meet the standard, and subsidizing those that do. The LCFS sounds good on paper, but when you do the math, some problems emerge:

We show this decreases high-carbon fuel production but increases low-carbon fuel production, possibly increasing net carbon emissions. The LCFS cannot be efficient, and the best LCFS may be nonbinding. We simulate a national LCFS on gasoline and ethanol. For a broad parameter range, emissions decrease; energy prices increase; abatement costs are large ($80-$760 billion annually); and average abatement costs are large ($307-$2,272 per CO tonne). A cost effective policy has much lower average abatement costs ($60-$868).

Continue reading “A Tale of Three Models – LCFS in Equilibrium”

Dumb and Dumber

Not to be outdone by Utah, South Dakota has passed its own climate resolution.

They raise the ante – where Utah cherry-picked twelve years of data, South Dakotans are happy with only 8. Even better, their pattern matching heuristic violates bathtub dynamics:

WHEREAS, the earth has been cooling for the last eight years despite small increases in anthropogenic carbon dioxide

They have taken the skeptic claim, that there’s little warming in the tropical troposphere, and bumped it up a notch:

WHEREAS, there is no evidence of atmospheric warming in the troposphere where the majority of warming would be taking place

Nope, no trend here:

Satellite tropospheric temperature, RSS

Satellite tropospheric temperature (RSS, TLT)

Continue reading “Dumb and Dumber”

Sea level update – newish work

I linked some newish work on sea level by Aslak Grinsted et al. in my last post. There are some other new developments:

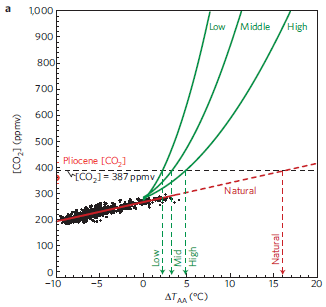
On the data front, Rohling et al. investigate sea level over the last half a million years and in the Pliocene (3+ million years ago). Here’s the relationship between CO2 and Antarctic temperatures:

Rohling Fig 2A

Two caveats and one interesting observation here:

  • The axes are flipped; if you think causally with CO2 on the x-axis, you need to mentally reflect this picture.
  • TAA refers to Antarctic temperature, which is subject to polar amplification
  • Notice that the empirical line (red) is much shallower than the relationship in model projections (green). Since the axes are flipped, that means that empirical Antarctic temperatures are much more sensitive to CO2 than projections, if it’s valid to extrapolate, and we wait long enough.

Continue reading “Sea level update – newish work”

Sea level update – Grinsted edition

I’m waaayyy overdue for an update on sea level models.

I’ve categorized my 6 previous posts on the Rahmstorf (2007) and Grinsted et al. models under sea level.

I had some interesting correspondence last year with Aslak Grinsted.

I agree with the ellipsis idea that you show in the figure on page IV. However, i conclude that if i use the paleo temperature reconstructions then the long response times are ‘eliminated’. You can sort of see why on this page: Fig2 here illustrates one problem with having a long response time:

http://www.glaciology.net/Home/Miscellaneous-Debris/rahmstorf2007lackofrealism

It seems it is very hard to make the turn at the end of the LIA with a large inertia.

I disagree with your statement “this suggests to me that G’s confidence bounds, +/- 67 years on the Moberg variant and +/- 501 years on the Historical variant are most likely slices across the short dimension of a long ridge, and thus understate the true uncertainty of a and tau.”

The inverse monte carlo method is designed not to “slice across” the distributions. I think the reason we get so different results is that your payoff function is very different from my likelihood function – as you also point out on page VI.

Aslak is politely pointing out that I screwed up one aspect of the replication. We agree that the fit payoff surface is an ellipse (I think the technical I used was “banana-ridge”). However, my hypothesis about the inexplicably narrow confidence bounds in the Grinsted et al. paper was wrong. It turns out that the actual origin of the short time constant and narrow confidence bounds is a constraint that I neglected to implement. The constraint involves the observation that variations in sea level over the last two millenia have been small. That basically chops off most of the long-time-constant portion of the banana, leaving the portion described in the paper. I’ve confirmed this with a quick experiment.

Continue reading “Sea level update – Grinsted edition”

Earthquakes != climate

Daniel Sarewitz has a recent column in Nature (paywall, unfortunately). It contains some wisdom, but the overall drift conclusion is bonkers.

First, the good stuff: Sarewitz rightly points out the folly of thinking that more climate science (like regional downscaling) will lead to action where existing science has failed to yield any. Similarly, he observes that good scientific information about the vulnerability of New Orleans didn’t lead to avoidance of catastrophe.

For complex, long-term problems such as climate change or nuclear-waste disposal, the accuracy of predictions is often unknowable, uncertainties are difficult to characterize and people commonly disagree about the outcomes they desire and the means to achieve them. For such problems, the belief that improved scientific predictions will compel appropriate behaviour and lead to desired outcomes is false.

Then things go off the rails. Continue reading “Earthquakes != climate”

The Health Care Death Spiral

Paul Krugman documents an ongoing health care death spiral in California:

Here’s the story: About 800,000 people in California who buy insurance on the individual market — as opposed to getting it through their employers — are covered by Anthem Blue Cross, a WellPoint subsidiary. These are the people who were recently told to expect dramatic rate increases, in some cases as high as 39 percent.

Why the huge increase? It’s not profiteering, says WellPoint, which claims instead (without using the term) that it’s facing a classic insurance death spiral.

Bear in mind that private health insurance only works if insurers can sell policies to both sick and healthy customers. If too many healthy people decide that they’d rather take their chances and remain uninsured, the risk pool deteriorates, forcing insurers to raise premiums. This, in turn, leads more healthy people to drop coverage, worsening the risk pool even further, and so on.

A death spiral arises when a positive feedback loop runs as a vicious cycle. Another example is Andy Ford’s utility death spiral. The existence of the positive feedback leads to counter-intuitive policy prescriptions: Continue reading “The Health Care Death Spiral”