LCFS in Equilibrium II

My last post introduced some observations from simulation of an equilibrium fuel portfolio standard model:

  • knife-edge behavior of market volume of alternative fuels as you approach compliance limits (discussed last year): as the required portfolio performance approaches the performance of the best component options, demand for those approaches 100% of volume rapidly.
  • differences in the competitive landscape for technology providers, when compared to alternatives like a carbon tax.
  • differences in behavior under uncertainty.
  • perverse behavior when the elasticity of substitution among fuels is low

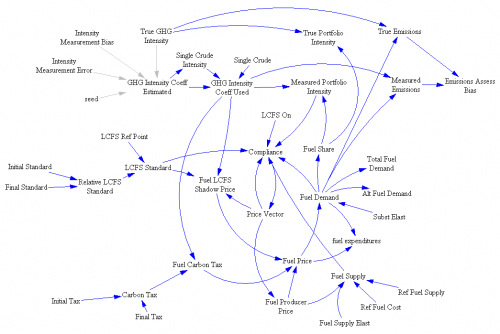
Here are some of the details. First, the model:

structure

Notice that this is not a normal SD model – there are loops but no stocks. That’s because this is a system of simultaneous equations solved in equilibrium. The Vensim FIND ZERO function is used to find a vector of prices (one for each fuel, plus the shadow price of emissions intensity) that matches supply and demand, subject to the intensity constraint.

Continue reading “LCFS in Equilibrium II”

Heat Trap

Replicated by: Tom Fiddaman

Citation: Hatlebakk, Magnus, & Moxnes, Erling (1992). Misperceptions and Mismanagement of the Greenhouse Effect? The Simulation Model . Report # CMR-92-A30009, December). Christian Michelsen Research.

Units: no

Format: Vensim

This is a climate-economy model, of about the same scale and vintage as Nordhaus’ original DICE model. It’s more interesting in some respects, because it includes path-dependent reversible and irreversible emissions reductions. As I recall, the original also had some stochastic elements, not active here. This version has no units; hopefully I can get an improved version online at some point.

Heat trap (Vensim .vmf)

Sea Level Rise

Citations: Rahmstorf 2007, “A semi-empirical approach to projecting future sea level rise.” Science 315. Grinsted, Moore & Jevrejeva 2009. “Reconstructing sea level from paleo and projected temperatures 200 to 2100 AD.” Climate Dynamics [1]

Source: Replicated by Tom Fiddaman based on an earlier replication of Rahmstorf provided by John Sterman

Units balance: Yes

Format: Vensim; requires Model Reader or an advanced version

Notes: See discussion at metasd.

Files:

Grinsted_v3b‎ – first model; default calibration replicates Rahmstorf, and optimization is set up to adjust constant terms to fit Rahmstorf slope to data

Grinsted_v3c – second model; updated data and calibration, as in Part III

Grinsted_v3c-k2 – third model; set up for Kalman filtering, as in Part V

A Tale of Three Models – LCFS in Equilibrium

This is the first of several posts on models of the transition to alternative fuel vehicles. The first looks at a static equilibrium model of the California Low Carbon Fuel Standard (LCFS). Another will look at another model of the LCFS, called VISION-CA, which generates fuel carbon intensity scenarios. Finally, I’ll discuss Jeroen Struben’s thesis, which is a full dynamic model that closes crucial loops among vehicle fleets, consumer behavior, fueling infrastructure, and manufacturers’ learning. At some point I will try to put the pieces together into a general reflection on alt fuel policy.

Those who know me might be surprised to see me heaping praise on a static model, but I’m about to do so. Not every problem is dynamic, and sometimes a comparative statics exercise yields a lot of insight.

In a no-longer-so-new paper, Holland, Hughes, and Knittel work out the implications of the LCFS and some variants. In a nutshell, a low carbon fuel standard is one of a class of standards that requires providers of a fuel (or managers of some kind of portfolio) to meet some criteria on average – X grams of carbon per MJ of fuel energy, or Y% renewable content, for example. If trading is allowed (fun, no?), then the constraint effectively applies to the market portfolio as a whole, rather than to individual providers, which should be more efficient. The constraint in effect requires the providers to set up an internal tax and subsidy system – taxing products that don’t meet the standard, and subsidizing those that do. The LCFS sounds good on paper, but when you do the math, some problems emerge:

We show this decreases high-carbon fuel production but increases low-carbon fuel production, possibly increasing net carbon emissions. The LCFS cannot be efficient, and the best LCFS may be nonbinding. We simulate a national LCFS on gasoline and ethanol. For a broad parameter range, emissions decrease; energy prices increase; abatement costs are large ($80-$760 billion annually); and average abatement costs are large ($307-$2,272 per CO tonne). A cost effective policy has much lower average abatement costs ($60-$868).

Continue reading “A Tale of Three Models – LCFS in Equilibrium”

Dumb and Dumber

Not to be outdone by Utah, South Dakota has passed its own climate resolution.

They raise the ante – where Utah cherry-picked twelve years of data, South Dakotans are happy with only 8. Even better, their pattern matching heuristic violates bathtub dynamics:

WHEREAS, the earth has been cooling for the last eight years despite small increases in anthropogenic carbon dioxide

They have taken the skeptic claim, that there’s little warming in the tropical troposphere, and bumped it up a notch:

WHEREAS, there is no evidence of atmospheric warming in the troposphere where the majority of warming would be taking place

Nope, no trend here:

Satellite tropospheric temperature, RSS

Satellite tropospheric temperature (RSS, TLT)

Continue reading “Dumb and Dumber”

Sea level update – newish work

I linked some newish work on sea level by Aslak Grinsted et al. in my last post. There are some other new developments:

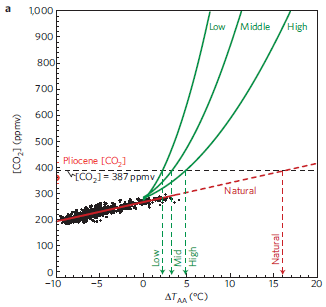
On the data front, Rohling et al. investigate sea level over the last half a million years and in the Pliocene (3+ million years ago). Here’s the relationship between CO2 and Antarctic temperatures:

Rohling Fig 2A

Two caveats and one interesting observation here:

  • The axes are flipped; if you think causally with CO2 on the x-axis, you need to mentally reflect this picture.
  • TAA refers to Antarctic temperature, which is subject to polar amplification
  • Notice that the empirical line (red) is much shallower than the relationship in model projections (green). Since the axes are flipped, that means that empirical Antarctic temperatures are much more sensitive to CO2 than projections, if it’s valid to extrapolate, and we wait long enough.

Continue reading “Sea level update – newish work”

Sea level update – Grinsted edition

I’m waaayyy overdue for an update on sea level models.

I’ve categorized my 6 previous posts on the Rahmstorf (2007) and Grinsted et al. models under sea level.

I had some interesting correspondence last year with Aslak Grinsted.

I agree with the ellipsis idea that you show in the figure on page IV. However, i conclude that if i use the paleo temperature reconstructions then the long response times are ‘eliminated’. You can sort of see why on this page: Fig2 here illustrates one problem with having a long response time:

http://www.glaciology.net/Home/Miscellaneous-Debris/rahmstorf2007lackofrealism

It seems it is very hard to make the turn at the end of the LIA with a large inertia.

I disagree with your statement “this suggests to me that G’s confidence bounds, +/- 67 years on the Moberg variant and +/- 501 years on the Historical variant are most likely slices across the short dimension of a long ridge, and thus understate the true uncertainty of a and tau.”

The inverse monte carlo method is designed not to “slice across” the distributions. I think the reason we get so different results is that your payoff function is very different from my likelihood function – as you also point out on page VI.

Aslak is politely pointing out that I screwed up one aspect of the replication. We agree that the fit payoff surface is an ellipse (I think the technical I used was “banana-ridge”). However, my hypothesis about the inexplicably narrow confidence bounds in the Grinsted et al. paper was wrong. It turns out that the actual origin of the short time constant and narrow confidence bounds is a constraint that I neglected to implement. The constraint involves the observation that variations in sea level over the last two millenia have been small. That basically chops off most of the long-time-constant portion of the banana, leaving the portion described in the paper. I’ve confirmed this with a quick experiment.

Continue reading “Sea level update – Grinsted edition”

Earthquakes != climate

Daniel Sarewitz has a recent column in Nature (paywall, unfortunately). It contains some wisdom, but the overall drift conclusion is bonkers.

First, the good stuff: Sarewitz rightly points out the folly of thinking that more climate science (like regional downscaling) will lead to action where existing science has failed to yield any. Similarly, he observes that good scientific information about the vulnerability of New Orleans didn’t lead to avoidance of catastrophe.

For complex, long-term problems such as climate change or nuclear-waste disposal, the accuracy of predictions is often unknowable, uncertainties are difficult to characterize and people commonly disagree about the outcomes they desire and the means to achieve them. For such problems, the belief that improved scientific predictions will compel appropriate behaviour and lead to desired outcomes is false.

Then things go off the rails. Continue reading “Earthquakes != climate”

Legislating Science

The Utah House has declared that CO2 is harmless. The essence of the argument in HJR 12: temperature’s going down, climategate shows that scientists are nefarious twits, whose only interest is in riding the federal funding gravy train, and emissions controls hurt the poor. While it’s reassuring that global poverty is a big concern of Utah Republicans, the scientific observations are egregiously bad:

29 WHEREAS, global temperatures have been level and declining in some areas over the
30 past 12 years;
31 WHEREAS, the “hockey stick” global warming assertion has been discredited and
32 climate alarmists’ carbon dioxide-related global warming hypothesis is unable to account for
33 the current downturn in global temperatures;
34 WHEREAS, there is a statistically more direct correlation between twentieth century
35 temperature rise and Chlorofluorocarbons (CFCs) in the atmosphere than CO2;
36 WHEREAS, outlawed and largely phased out by 1978, in the year 2000 CFC’s began to
37 decline at approximately the same time as global temperatures began to decline;

49 WHEREAS, Earth’s climate is constantly changing with recent warming potentially an
50 indication of a return to more normal temperatures following a prolonged cooling period from
51 1250 to 1860 called the “Little Ice Age”;

The list cherry-picks skeptic arguments that rely on a few papers (if that), nearly all thoroughly discredited. There are so many things wrong here that it’s not worth the electrons to refute them one by one. The quality of their argument calls to mind to the 1897 attempt in Indiana to legislate that pi = 3.2. It’s sad that this resolution’s supporters are too scientifically illiterate to notice, or too dishonest to care. There are real uncertainties about climate; it would be nice to see a legislative body really grapple with the hard questions, rather than chasing red herrings.