Climate and Competitiveness

Trump gets well-deserved criticism for denying having claimed that the Chinese invented climate change to make  US manufacturing non-competitive.

climatechinesehoax

The idea is absurd on its face. Climate change was proposed long before (or long after) China figured on the global economic landscape. There was only one lead author from China out of the 34 in the first IPCC Scientific Assessment. The entire climate literature is heavily dominated by the US and Europe.

But another big reason to doubt its veracity is that climate policy, like emissions pricing, would make Chinese manufacturing less competitive. In fact, at the time of the first assessment, China was the most carbon-intensive economy in the world, according to the World Bank:

chinaintensity

Today, China’s carbon intensity remains more than twice that of the US. That makes a carbon tax with a border adjustment an attractive policy for US competitiveness. What conspiracy theory makes it rational for China to promote that?

Models, data and hidden hockey sticks

NPR takes a harder look at the much-circulated xkcd temperature reconstruction cartoon.

cartoonheader

The criticism:

Epic Climate Cartoon Goes Viral, But It Has One Key Problem

[…]

As you scroll up and down the graphic, it looks like the temperature of Earth’s surface has stayed remarkably stable for 10,000 years. It sort of hovers around the same temperature for some 10,000 years … until — bam! The industrial revolution begins. We start producing large amounts of carbon dioxide. And things heat up way more quickly.

Now look a bit closer at the bottom of the graphic. See how all of a sudden, around 150 years ago, the dotted line depicting average Earth temperature changes to a solid line. Munroe makes this change because the data used to create the lines come from two very different sources.

The solid line comes from real data — from scientists actually measuring the average temperature of Earth’s surface. These measurements allow us to see temperature fluctuations that occur over a very short timescale — say, a few decades or so.

But the dotted line comes from computer models — from scientists reconstructing Earth’s surface temperature. This gives us very, very coarse information. It averages Earth’s temperature over hundreds of years. So we can see temperature fluctuations that occur only over longer periods of time, like a thousand years or so. Any upticks, spikes or dips that occur in shorter time frames get smoothed out.

So in a way the graphic is really comparing apples and oranges: measurements of the recent past versus reconstructions of more ancient times.

Here’s the bit in question:

recent

The fundamental point is well taken, that fruit are mixed here. The cartoon even warns of that:

limits

I can’t fault the technical critique, but I take issue with a couple aspects of the tone of the piece. It gives the impression that “real data” is somehow exalted and models are inferior, thereby missing the real issues. And it lends credence to the “sh!t happens” theory of climate, specifically that the paleoclimate record could be full of temperature “hockey sticks” like the one we’re in now.

There’s no such thing as pure, assumption free “real data.” Measurement processes involve – gasp! – models. Even the lowly thermometer requires a model to be read, with the position of a mercury bubble converted to temperature via a calibrated scale, making various assumptions about physics of thermal expansion, linearity, etc.

There are no infallible “scientists actually measuring the average temperature of Earth’s surface.” Earth is a really big place, measurements are sparse, and instruments and people make mistakes. Reducing station observations to a single temperature involves reconstruction, just as it does for longer term proxy records. (If you doubt this, check the methodology for the Berkeley Earth Surface Temperature.)

Data combined with a model gives a better measurement than the raw data alone. That’s why a GPS unit combines measurements from satellites with a model of the device’s motion and noise processes to estimate position with greater accuracy than any single data point can provide.

In fact, there are three sources here:

  1. recent global temperature, reconstructed from land and sea measurements with high resolution in time and space (the solid line)
  2. long term temperature, reconstructed from low resolution proxies (the top dotted line)
  3. projections from models that translate future emissions scenarios into temperature

If you take the recent, instrumental global temperature record as the gold standard, there are then two consistency questions of interest. Does the smoothing in the long term paleo record hide previous hockey sticks? Are the models accurate prognosticators of the future?

On the first point, the median temporal resolution of the records contributing to the Marcott 11,300 year reconstruction used is 120 years. So, a century-scale temperature spike would be attenuated by a factor of 2. There is then some reason to think that missing high frequency variation makes the paleo record look different. But there are also good reasons to think that this is not terribly important. Marcott et al. address this:

Our results indicate that global mean temperature for the decade 2000 – 2009 ( 34 ) has not yet exceeded the warmest temperatures of the early Holocene (5000 to 10,000 yr B.P.). These temperatures are, however, warmer than 82% of the Holocene distribution as represented by the Standard 5×5 stack, or 72% after making plausible corrections for inherent smoothing of the high frequencies in the stack. In contrast, the decadal mean global temperature of the early 20th century (1900 – 1909) was cooler than >95% of the Holocene distribution under both the Standard 5×5 and high-frequency corrected scenarios. Global temperature, therefore, has risen from near the coldest to the warmest levels of the Holocene within the past century, reversing the long-term cooling trend that began ~5000 yr B.P.

Even if there were hockey sticks in the past, that’s not evidence for a natural origin for today’s warming. We know little about paleo forcings, so it would be hard to discern the origin of those variations. One might ask, if they are happening now, why can’t we observe them? Similarly, evidence for higher natural variability is evidence for less damping of the climate system, which favors higher climate sensitivity.

Finally, the question of the validity of model projections is too big to tackle, but I should point out that the distinction between a model that generates future projections and a model that assimilates historic measurements is not as great as one might think. Obviously the future hasn’t happened yet, so future projections are subject to an additional source of uncertainty, which is that we don’t know all the inputs (future solar output, volcanic eruptions, etc.), whereas in the past those have been realized, even if we didn’t measure them. Also, models the project may have somewhat different challenges (like getting atmospheric physics right) than data-driven models (which might focus more on statistical methods). But future-models and observational data-models also have one thing in common: there’s no way to be sure that the model structure is right. In one case, it’s because the future hasn’t happened yet, and in the other because there’s no oracle to reveal the truth about what did happen.

So, does the “one key problem” with the cartoon invalidate the point, that something abrupt and unprecedented in the historical record is underway or about to happen? Not likely.

Missing the point about efficiency rebounds … again

Breakthrough’s Nordhaus and Shellenberger (N&S) spot a bit of open-loop thinking about LED lighting:

ON Tuesday, the Royal Swedish Academy of Sciences awarded the 2014 Nobel Prize in Physics to three researchers whose work contributed to the development of a radically more efficient form of lighting known as light-emitting diodes, or LEDs.

In announcing the award, the academy said, “Replacing light bulbs and fluorescent tubes with LEDs will lead to a drastic reduction of electricity requirements for lighting.” The president of the Institute of Physics noted: “With 20 percent of the world’s electricity used for lighting, it’s been calculated that optimal use of LED lighting could reduce this to 4 percent.”

The problem of course is that lighting energy use would fall 20% to 4% only if there’s no feedback, so that LEDs replace incandescents 1 for 1 (and of course the multiplier can’t be that big, because CFLs and other efficient technologies already supply a lot of light).

N&S go on to argue:

But it would be a mistake to assume that LEDs will significantly reduce overall energy consumption.

Why? Because rebound effects will eat up the efficiency gains:

“The growing evidence that low-cost efficiency often leads to faster energy growth was recently considered by both the Intergovernmental Panel on Climate Change and the International Energy Agency.”

“The I.E.A. and I.P.C.C. estimate that the rebound could be over 50 percent globally.”

Notice the sleight-of-hand: the first statement implies a rebound effect greater than 100%, while the evidence they’re citing describes a rebound of 50%, i.e. 50% of the efficiency gain is preserved, which seems pretty significant.

Presumably the real evidence they have in mind is http://iopscience.iop.org/0022-3727/43/35/354001 – authors Tsao & Saunders are Breakthrough associates. Saunders describes a 100% rebound for lighting here http://thebreakthrough.org/index.php/programs/energy-and-climate/understanding-energy-efficiency-rebound-interview-with-harry-saunders

Now the big non sequitur:

But LED and other ultraefficient lighting technologies are unlikely to reduce global energy consumption or reduce carbon emissions. If we are to make a serious dent in carbon emissions, there is no escaping the need to shift to cleaner sources of energy.

Let’s assume the premise is true – that the lighting rebound effect is 100% or more. That implies that lighting use is highly price elastic, which in turn means that an emissions price like a carbon tax will have a strong influence on lighting energy. Therefore pricing can play a major role in reducing emissions. It’s probably still true that a shift to clean energy is unavoidable, but it’s not an exclusive remedy, and a stronger rebound effect actually weakens the argument for clean sources.

Their own colleagues point this out:

In fact, our paper shows that, for the two 2030 scenarios (with and without solid-state lighting), a mere 12% increase in real electricity prices would result in a net decline in electricity-for-lighting consumption.

What should the real takeaway be?

  • Subsidizing lighting efficiency is ineffective, and possibly even counterproductive.
  • Subsidizing clean energy lowers the cost of delivering lighting and other services, and therefore will also be offset by rebound effects.
  • Emissions pricing is a win-win, because it encourages efficiency, counteracts rebound effects and promotes substitution of clean sources.

Reflections on Virgin Earth

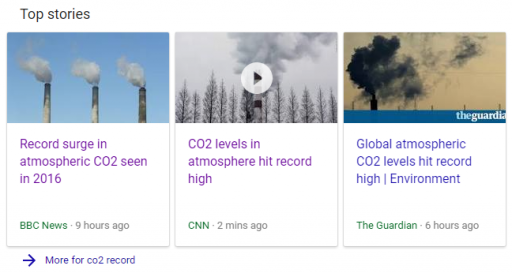
Colleagues just pointed out the Virgin Earth Challenge, “a US$25 million prize for an environmentally sustainable and economically viable way to remove greenhouse gases from the atmosphere.”

John Sterman writes:

I think it inevitable that we will see more and more interest in CO2 removal. And IF it can be done without undermining mitigation I’d be all for it. I do like biochar as a possibility; though I am very skeptical of direct air capture and CCS. But the IF in the prior sentence is clearly not true: if there were effective removal technology it would create moral hazard leading to less mitigation and more emissions.

Even more interesting, direct air capture is not thermodynamically favored; needs lots of energy. All the finalists claim that they will use renewable energy or “waste” heat from other processes to power their removal technology, but how about using those renewable sources and waste heat to directly offset fossil fuels and reduce emissions instead of using them to power less efficient removal processes? Clearly, any wind/solar/geothermal that is used to power a removal technology could have been used directly to reduce fossil emissions, and will be cheaper and offset more net emissions. Same for waste heat unless the waste heat is too low temp to be used to offset fossil fuels. Result: these capture schemes may increase net CO2 flux into the atmosphere.

Every business knows it’s always better to prevent the creation of a defect than to correct it after the fact. No responsible firm would say “our products are killing the customers; we know how to prevent that, but we think our money is best spent on settling lawsuits with their heirs.” (Oh: GM did exactly that, and look how it is damaging them). So why is it ok for people to say “fossil fuel use is killing us; we know how to prevent that, but we’ve decided to spend even more money to try to clean up the mess after the pollution is already in the air”?

To me, many of these schemes reflect a serious lack of systems thinking, and the desire for a technical solution that allows us to keep living the way we are living without any change in our behavior. Can’t work.

I agree with John, and I think there are some additional gaps in systemic thinking about these technologies. Here are some quick reflections, in pictures.

EmittingCapturing
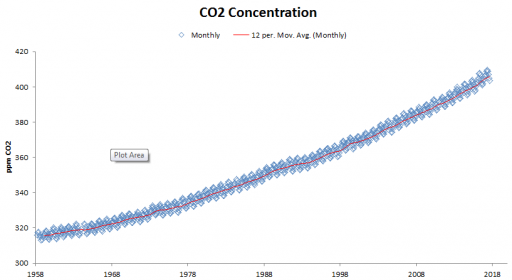
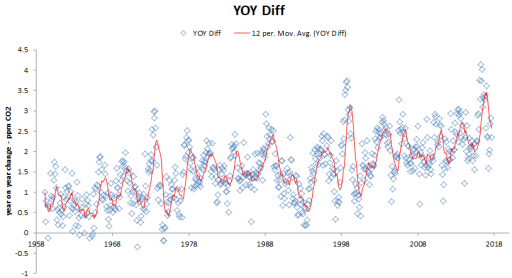
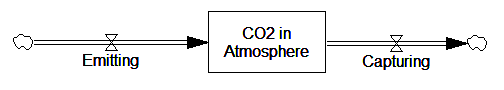
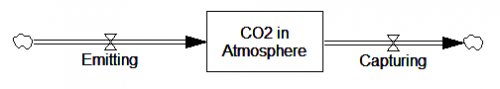
A basic point for any system is that you can lower the level of a stock (all else equal) by reducing the inflow or increasing the outflow. So the idea of capturing CO2 is not totally bonkers. In fact, it lets you do at least one thing that you can’t do by reducing emissions. When emissions fall to 0, there’s no leverage to reduce CO2 in the atmosphere further. But capture could actively draw down the CO2 stock. However, we are very far from 0 emissions, and this is harder than it seems:

AirCapturePushback
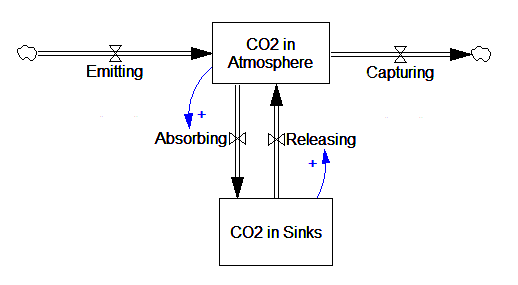
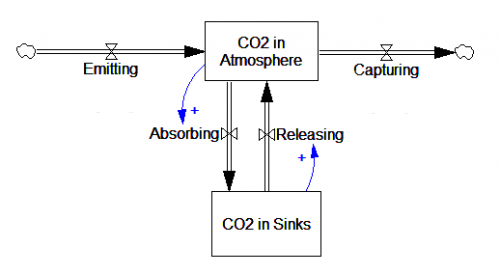
Natural sinks have been graciously absorbing roughly half of our CO2 emissions for a long time. If we reduce emissions dramatically, and begin capturing, nature will be happy to give us back that CO2, ton for ton. So, the capture problem is actually twice as big you’d think from looking at the excess CO2 in the atmosphere.

Currently, there’s also a problem of scale. Emissions are something like two orders of magnitude larger than potential markets for CO2, so there’s a looong way to go. And capture doesn’t scale like like a service running on Amazon Elastic Cloud servers; it’s bricks and mortar.

EmitCaptureScale
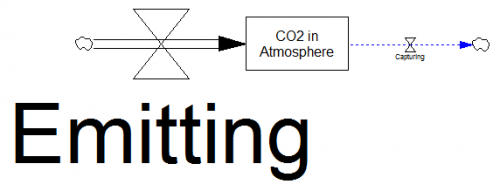
And where does that little cloud go, anyway? Several proposals gloss over this, as in:

The process involves a chemical solution (that naturally absorbs CO2) being brought into contact with the air. This solution, now containing the captured CO2, is sent to through a regeneration cycle which simultaneously extracts the CO2 as a high-pressure pipeline-quality product (ready to be put to numerous commercial uses) …

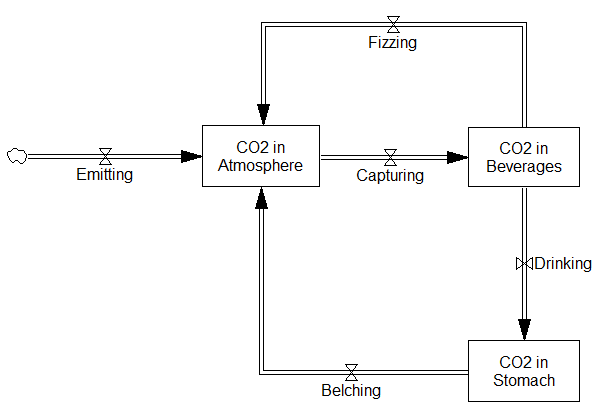
The biggest commercial uses I know of are beverage carbonation and enhanced oil recovery (EOR). Consider the beverage system:

BeverageCO2
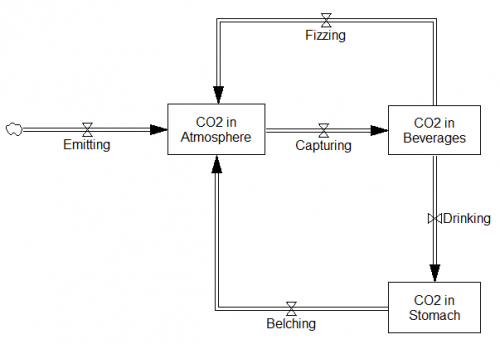
CO2 sequestered in beverages doesn’t stay there very long! You’d have to start stockpiling vast quantities of Coke in salt mines to accumulate a significant quantity. This reminds me of Nike’s carbon-sucking golf ball. EOR is just as bad, because you put CO2 down a hole (hopefully it stays there), and oil and gas come back up, which are then burned … emitting more CO2. Fortunately the biochar solutions do not suffer so much from this problem.

Next up, delays and moral hazard:

CO2moralHazard
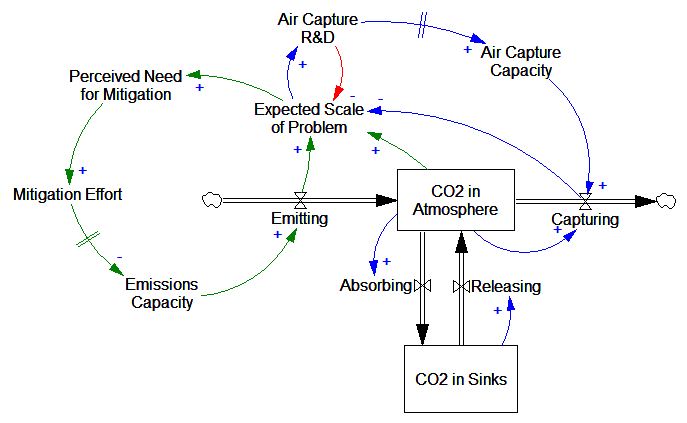
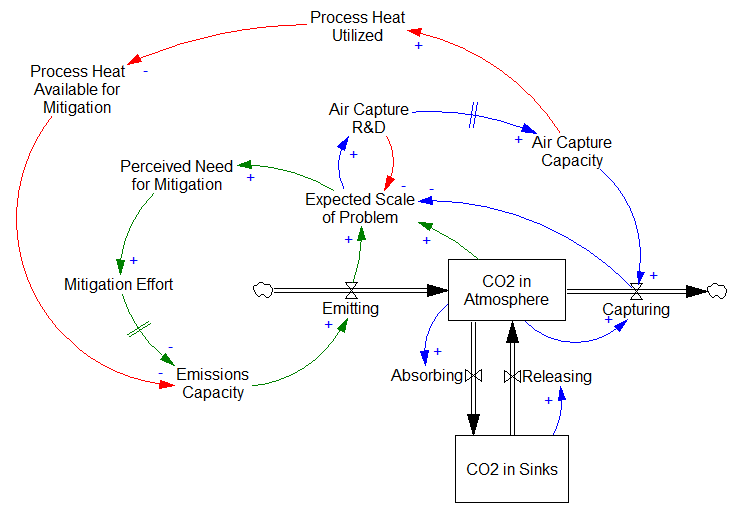
This is a cartoonish view of the control system driving mitigation and capture effort. The good news is that air capture gives us another negative loop (blue, top) by which we can reduce CO2 in the atmosphere. That’s good, especially if we mismanage the green loop. The moral hazard side effect is that the mere act of going through the motions of capture R&D reduces the perceived scale of the climate problem (red link), and therefore reduces mitigation, which actually makes the problem harder to solve.

Capture also competes with mitigation for resources, as in John’s process heat example:

ProcessHeat

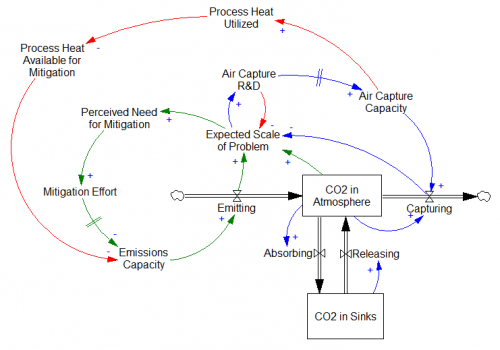
It’s even worse than that, because a lot of mitigation efforts have fairly rapid effects on emissions. There are certainly long-lived aspects of energy and infrastructure that must be considered, but behavior can change a lot of emissions quickly and with off-the-shelf technology. The delay between air capture R&D and actual capturing, on the other hand, is bound to be fairly long, because it’s in its infancy, and has to make it through multiple discover/develop/deploy hurdles.

One of those hurdles is cost. Why would anyone bother to pay for air capture, especially in cases where it’s a sure loser in terms of thermodynamics and capital costs? Altruism is not a likely candidate, so it’ll take a policy driver. There are essentially two choices: standards and emissions pricing.

A standard might mandate (as the EPA and California have) that new power plants above a certain emissions intensity must employ some kind of offsetting capture. If coal wants to stay in business, it has to ante up. The silly thing about this, apart from inevitable complexity, is that any technology that meets the standard without capture, like combined cycle gas electricity currently, pays 0 for its emissions, even though they too are harmful.

Similarly, you could place a subsidy or bounty on tons of CO2 captured. That would be perverse, because taxpayers would then have to fund capture – not likely a popular measure. The obvious alternative would be to price emissions in general – positive for emissions, negative for capture. Then all sources and sinks would be on a level playing field. That’s the way to go, but of course we ought to do it now, so that mitigation starts working, and air capture joins in later if and when it’s a viable competitor.

I think it’s fine if people work on carbon capture and sequestration, as long as they don’t pretend that it’s anywhere near a plausible scale, or even remotely possible without comprehensive changes in incentives. I won’t spend my own time on a speculative, low-leverage policy when there are more effective, immediate and cheaper mitigation alternatives. And I’ll certainly never advise anyone to pursue a geoengineered world, any more than I’d advise them to keep smoking but invest in cancer research.


Climate Interactive – #12 climate think tank

Climate Interactive is #12 (out of 210) in the International Center for Climate Governance’s Standardized Ranking of climate think tanks (by per capita productivity):

  1. Woods Hole Research Center (WHRC)
  2. Basque Centre for Climate Change (BC3)
  3. Centre for European Policy Studies (CEPS)*
  4. Centre for European Economic Research (ZEW)*
  5. International Institute for Applied Systems Analysis (IIASA)
  6. Worldwatch Institute
  7. Fondazione Eni Enrico Mattei (FEEM)
  8. Resources for the Future (RFF)
  9. Mercator Research Institute on Global Commons and Climate Change (MCC)
  10. Centre International de Recherche sur l’Environnement et le De?veloppement (CIRED)
  11. Institut Pierre Simon Laplace (IPSL)
  12. Climate Interactive
  13. The Climate Institute
  14. Buildings Performance Institute Europe (BPIE)
  15. International Institute for Environment and Development (IIED)
  16. Center for Climate and Energy Solutions (C2ES)
  17. Global Climate Forum (GCF)
  18. Potsdam Institute for Climate Impact Research (PIK)
  19. Sandbag Climate Campaign
  20. Civic Exchange

That’s some pretty illustrious company! Congratulations to all at CI.

How many things can you get wrong on one chart?

Let’s count:

  1. stupidGraphTruncate records that start ca. 1850 at an arbitrary starting point.
  2. Calculate trends around a breakpoint cherry-picked to most favor your argument.
  3. Abuse polynomial fits generally. (See this series.)
  4. Report misleading linear trends by simply dropping the quadratic term.
  5. Fail to notice the obvious: that temperature in the second period is, on average, higher than in the first.
  6. Choose a loaded color scheme that emphasizes #5.
  7. Fail to understand that temperature integrates CO2.
  8. Fallacy of the single cause (only CO2 affects temperature – in good company with Burt Rutan).

Those crazy Marxists are at it again

“Normally, conservatives extol the magic of markets and the adaptability of the private sector, which is supposedly able to transcend with ease any constraints posed by, say, limited supplies of natural resources. But as soon as anyone proposes adding a few limits to reflect environmental issues — such as a cap on carbon emissions — those all-capable corporations supposedly lose any ability to cope with change.” Krugman – NYT

Geoengineering justice & governance

From Clive Hamilton via Technology Review,

If humans were sufficiently omniscient and omnipotent, would we, like God, use climate engineering methods benevolently? Earth system science cannot answer this question, but it hardly needs to, for we know the answer already. Given that humans are proposing to engineer the climate because of a cascade of institutional failings and self-interested behaviours, any suggestions that deployment of a solar shield would be done in a way that fulfilled the strongest principles of justice and compassion would lack credibility, to say the least.

Geoengineering seems sure to make a mess, even if the tech works.

How I learned to stop worrying and love methane

RealClimate has a nice summary of recent atmospheric methane findings. Here’s the structure:

methane2The bad news (red) has been that methane release from permafrost and clathrates on the continental shelf appears to be significant. At the same time, methane release from natural gas seems to be larger than previously thought, and (partly for the same reason – fracking) gas resources appear to be larger. Both put upward pressure on atmospheric methane.

However, there are some constraints as well. The methane budget must be consistent with observations of atmospheric concentrations and gradients (green). Therefore, if one source is thought to be bigger, it must be the case historically that other natural or anthropogenic sources are smaller (or perhaps uptake is faster) by an offsetting amount (blue).

This bad-news-good-news story does not rule out positive feedbacks from temperature or atmospheric chemistry, but at least we’re not cooked yet.