By luck and a contorted Jet Stream, Montana more or less escaped the horrific heat that gripped the Northwest at the end of June. You probably heard, but this culminated in temperatures in Lytton BC breaking all-time records for Canada and the globe north of latitude 50 by huge margins. The next day, the town burned to the ground.
I wondered just how big this was, so when GHCN temperature records from KNMI became available, I pulled the data for a quick and dirty analysis. Here’s the daily Tmax for Lytton:
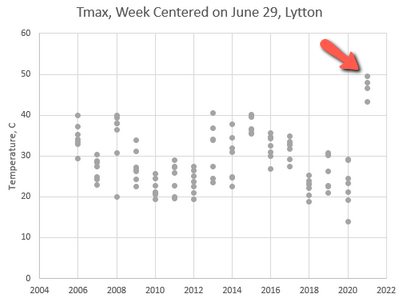
That’s about 3.5 standard deviations above the recent mean. Lytton’s records are short and fragmented, so I also pulled Kamloops (the closest station with a long record):
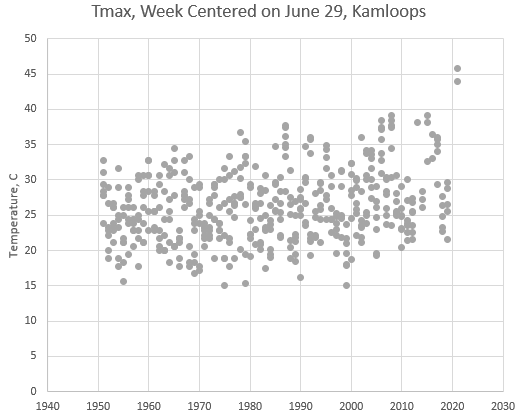
You can see how bizarre the recent event was, even in a long term context. In Kamloops, it’s a +4 standard deviation event, which means a likelihood of 1 in 16,000 if this were simply random. Even if you start adjusting for selection and correlations, it still looks exceedingly rare – perhaps a 1000-year event in a 70-year record.
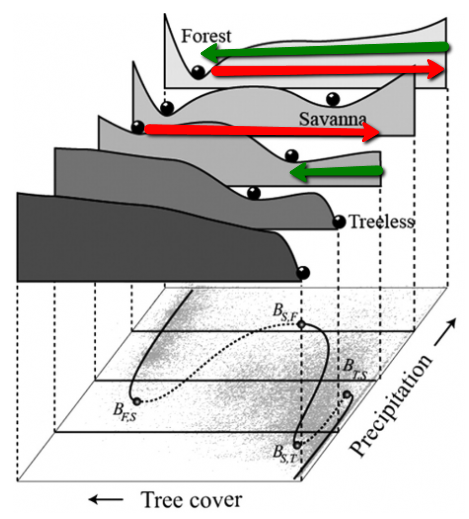
Clearly it’s not simply random. For one thing, there’s a pretty obvious long term trend in the Kamloops record. But a key question is, what will happen to the variance of temperature in the future? The simplest thermodynamic argument is that energy in partitions of a system has a Boltzmann distribution and therefore that variance should go up with the mean. However, feedback might alter this.
This paper argues that variance goes up:
Extreme summertime temperatures are a focal point for the impacts of climate change. Climate models driven by increasing CO2 emissions project increasing summertime temperature variability by the end of the 21st century. If credible, these increases imply that extreme summertime temperatures will become even more frequent than a simple shift in the contemporary probability distribution would suggest. Given the impacts of extreme temperatures on public health, food security, and the global economy, it is of great interest to understand whether the projections of increased temperature variance are credible. In this study, we use a theoretical model of the land surface to demonstrate that the large increases in summertime temperature variance projected by climate models are credible, predictable from first principles, and driven by the effects of warmer temperatures on evapotranspiration. We also find that the response of plants to increased CO2 and mean warming is important to the projections of increased temperature variability.
But Zeke Housfather argues for stable variance:
summer variability, where extreme heat events are more of a concern, has been essentially flat. These results are similar to those found in a paper last fall by Huntingford et al published in the journal Nature. Huntingford and colleagues looked at both land and ocean temperature records and found no evidence of increasing variability. They also analyzed the outputs of global climate models, and reported that most climate models actually predict a slight decline in temperature variability over the next century as the world warms. The figure below, from Huntingford, shows the mean and spread of variability (in standard deviations) for the models used in the latest IPCC report (the CMIP5 models).
This is good news overall; increasing mean temperatures and variability together would lead to even more extreme heat events. But “good news” is relative, and the projected declines in variability are modest, so rising mean temperatures by the end of this century will still push the overall temperature distribution well outside of what society has experienced in the last 12,000 years.
If he’s right, stable variance implies that the mean temperature of scenarios is representative of what we’ll experience – nothing further to worry about. I hope this is true, but I also hope it takes a long time to find out, because I really don’t want to experience what Lytton just did.
 BTS
BTS ARB
ARB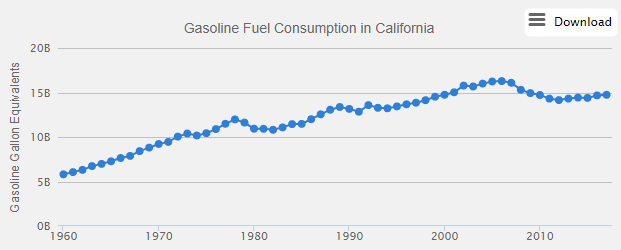 AFDC
AFDC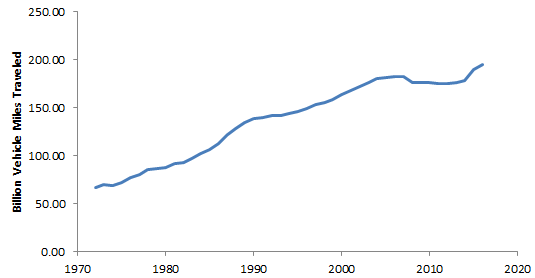 Caltrans
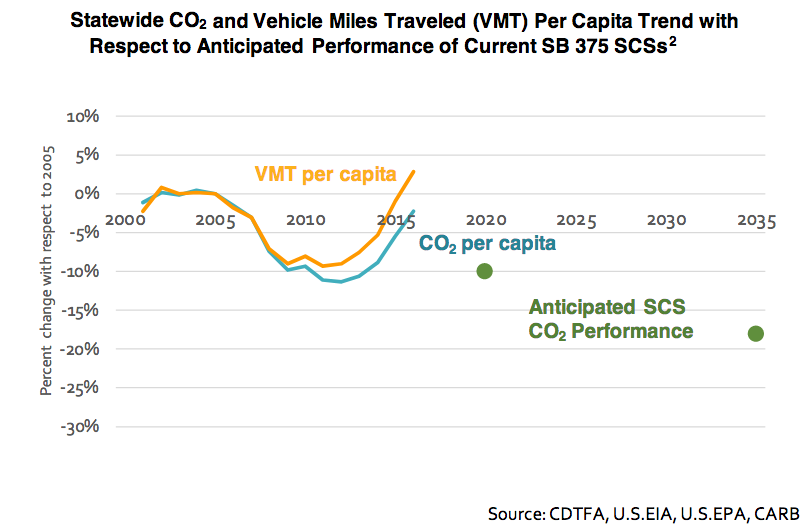
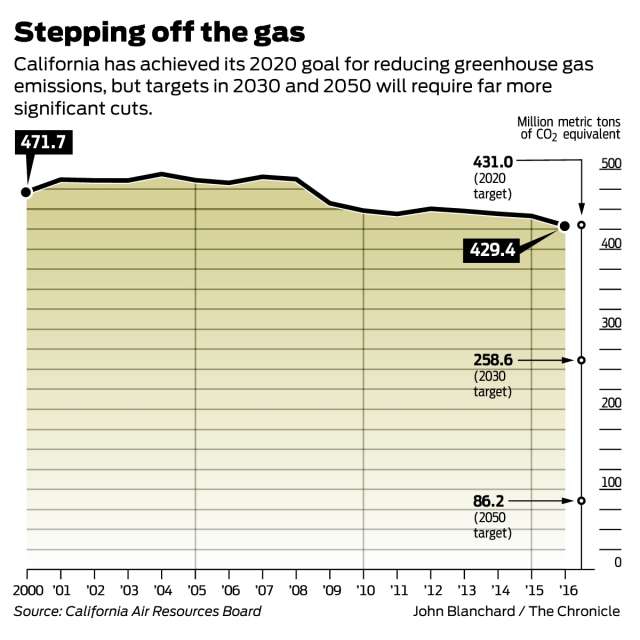 SF Chronicle