Independence of models and errors


Roger Pielke’s blog has an interesting guest post by Ryan Meyer, reporting on a paper that questions the meaning of claims about the robustness of conclusions from multiple models. From the abstract:

Climate modelers often use agreement among multiple general circulation models (GCMs) as a source of confidence in the accuracy of model projections. However, the significance of model agreement depends on how independent the models are from one another. The climate science literature does not address this. GCMs are independent of, and interdependent on one another, in different ways and degrees. Addressing the issue of model independence is crucial in explaining why agreement between models should boost confidence that their results have basis in reality.

Later in the paper, they outline the philosophy as follows,

In a rough survey of the contents of six leading climate journals since 1990, we found 118 articles in which the authors relied on the concept of agreement between models to inspire confidence in their results. The implied logic seems intuitive: if multiple models agree on a projection, the result is more likely to be correct than if the result comes from only one model, or if many models disagree. … this logic only holds if the models under consideration are independent from one another. … using multiple models to analyze the same system is a ‘‘robustness’’ strategy. Every model has its own assumptions and simplifications that make it literally false in the sense that the modeler knows that his or her mathematics do not describe the world with strict accuracy. When multiple independent models agree, however, their shared conclusion is more likely to be true.

I think they’re barking up the right tree, but one important clarification is in order. We don’t actually care about the independence of models per se. In fact, if we had an ensemble of perfect models, they’d necessarily be identical. What we really want is for the models to be right. To the extent that we can’t be right, we’d at least like to have independent systematic errors, so that (a) there’s some chance that mistakes average out and (b) there’s an opportunity to diagnose the differences.

For example, consider three models of gravity, of the form F=G*m1*m2/r^b. We’d prefer an ensemble of models with b = {1.9,2.0,2.1} to one with b = {1,2,3}, even though some metrics of independence (such as the state space divergence cited in the paper) would indicate that the first ensemble is less independent than the second. This means that there’s a tradeoff: if b is a hidden parameter, it’s harder to discover problems with the narrow ensemble, but harder to get good answers out of the dispersed ensemble, because its members are more wrong.

For climate models, ensembles provide some opportunity to discover systematic errors from numerical schemes, parameterization of poorly-understood sub-grid scale phenomena and program bugs, to the extent that models rely on different codes and approaches. As in my gravity example, differences would be revealed more readily by large perturbations, but I’ve never seen extreme conditions tests on GCMs (although I understand that they at least share a lot with models used to simulate other planets). I’d like to see more of that, plus an inventory of major subsystems of GCMs, and the extent to which they use different codes.

While GCMs are essentially the only source of regional predictions, which are a focus of the paper, it’s important to realize that GCMs are not the only evidence for the notion that climate sensitivity is nontrivial. For that, there are also simple energy balance models and paleoclimate data. That means that there are at least three lines of evidence, much more independent than GCM ensembles, backing up the idea that greenhouse gases matter.

It’s interesting that this critique comes up with reference to GCMs, because it’s actually not GCMs we should worry most about. For climate models, there are vague worries about systematic errors in cloud parameterization and other phenomena, but there’s no strong a priori reason, other than Murphy’s Law, to think that they are a problem. Economic models in the climate policy space, on the other hand, nearly all embody notions of economic equilibrium and foresight which we can be pretty certain are wrong, perhaps spectacularly so. That’s what we should be worrying about.

Dynamics on the iPhone

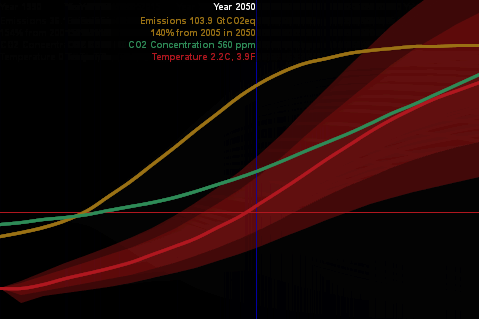
Scott Johnson asks about C-LITE, an ultra-simple version of C-ROADS, built in Processing – a cool visually-oriented language.

C-LITE

(Click the image to try it).

With this experiment, I was striving for a couple things:

  • A reduced-form version of the climate model, with “good enough” accuracy and interactive speed, as in Vensim’s Synthesim mode (no client-server latency).
  • Tufte-like simplicity of the UI (no grids or axis labels to waste electrons). Moving the mouse around changes the emissions trajectory, and sweeps an indicator line that gives the scale of input and outputs.
  • Pervasive representation of uncertainty (indicated by shading on temperature as a start).

This is just a prototype, but it’s already more fun than models with traditional interfaces.

I wanted to run it on the iPhone, but was stymied by problems translating the model to Processing.js (javascript) and had to set it aside. Recently Travis Franck stepped in and did a manual translation, proving the concept, so I took another look at the problem. In the meantime, a neat export tool has made it easy. It turns out that my code problem was as simple as replacing “float []” with “float[]” so now I have a javascript version here. It runs well in Firefox, but there are a few glitches on Safari and iPhones – text doesn’t render properly, and I don’t quite understand the event model. Still, it’s cool that modest dynamic models can run realtime on the iPhone. [Update: forgot to mention that I sued Michael Schieben’s touchmove function modification to processing.js.]

The learning curve for all of this is remarkably short. If you’re familiar with Java, it’s very easy to pick up Processing (it’s probably easy coming from other languages as well). I spent just a few days fooling around before I had the hang of building this app. The core model is just standard Euler ODE code:

initialize parameters
initialize levels
do while time < final time
compute rates & auxiliaries
compute levels

The only hassle is that equations have to be ordered manually. I built a Vensim prototype of the model halfway through, in order to stay clear on the structure as I flew seat-of-the pants.

With the latest Processing.js tools, it’s very easy to port to javascript, which runs on nearly everything. Getting it running on the iPhone (almost) was just a matter of discovering viewport meta tags and a line of CSS to set zero margins. The total codebase for my most complicated version so far is only 500 lines. I think there’s a lot of potential for sharing model insights through simple, appealing browser tools and handheld platforms.

As an aside, I always wondered why javascript didn’t seem to have much to do with Java. The answer is in this funny programming timeline. It’s basically false advertising.

The model that ate Europe

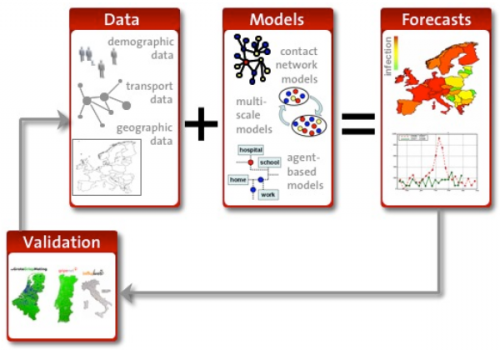
arXiv covers modeling on an epic scale in Europe’s Plan to Simulate the Entire Earth: a billion dollar plan to build a huge infrastructure for global multiagent models. The core is a massive exaflop “Living Earth Simulator” – essentially the socioeconomic version of the Earth Simulator.

FuturIcT

I admire the audacity of this proposal, and there are many good ideas captured in one place:

  • The goal is to take on emergent phenomena like financial crises (getting away from the paradigm of incremental optimization of stable systems).
  • It embraces uncertainty and robustness through scenario analysis and Monte Carlo simulation.
  • It mixes modeling with data mining and visualization.
  • The general emphasis is on networks and multiagent simulations.

I have no doubt that there might be many interesting spinoffs from such a project. However, I suspect that the core goal of creating a realistic global model will be an epic failure, for three reasons. Continue reading “The model that ate Europe”

Diagrams vs. Models

Following Bill Harris’ comment on Are causal loop diagrams useful? I went looking for Coyle’s hybrid influence diagrams. I didn’t find them, but instead ran across this interesting conversation in the SDR:

The tradition, one might call it the orthodoxy, in system dynamics is that a problem can only be analysed, and policy guidance given, through the aegis of a fully quantified model. In the last 15 years, however, a number of purely qualitative models have been described, and have been criticised, in the literature. This article briefly reviews that debate and then discusses some of the problems and risks sometimes involved in quantification. Those problems are exemplified by an analysis of a particular model, which turns out to bear little relation to the real problem it purported to analyse. Some qualitative models are then reviewed to show that they can, indeed, lead to policy insights and five roles for qualitative models are identified. Finally, a research agenda is proposed to determine the wise balance between qualitative and quantitative models.

… In none of this work was it stated or implied that dynamic behaviour can reliably be inferred from a complex diagram; it has simply been argued that describing a system is, in itself, a useful thing to do and may lead to better understanding of the problem in question. It has, on the other hand, been implied that, in some cases, quantification might be fraught with so many uncertainties that the model’s outputs could be so misleading that the policy inferences drawn from them might be illusory. The research issue is whether or not there are circumstances in which the uncertainties of simulation may be so large that the results are seriously misleading to the analyst and the client. … This stream of work has attracted some adverse comment. Lane has gone so far as to assert that system dynamics without quantified simulation is an oxymoron and has called it ‘system dynamics lite (sic)’. …

Coyle (2000) Qualitative and quantitative modelling in system dynamics: some research questions

Jack Homer and Rogelio Oliva aren’t buying it:

Geoff Coyle has recently posed the question as to whether or not there may be situations in which computer simulation adds no value beyond that gained from qualitative causal-loop mapping. We argue that simulation nearly always adds value, even in the face of significant uncertainties about data and the formulation of soft variables. This value derives from the fact that simulation models are formally testable, making it possible to draw behavioral and policy inferences reliably through simulation in a way that is rarely possible with maps alone. Even in those cases in which the uncertainties are too great to reach firm conclusions from a model, simulation can provide value by indicating which pieces of information would be required in order to make firm conclusions possible. Though qualitative mapping is useful for describing a problem situation and its possible causes and solutions, the added value of simulation modeling suggests that it should be used for dynamic analysis whenever the stakes are significant and time and budget permit.

Homer & Oliva (2001) Maps and models in system dynamics: a response to Coyle

Coyle rejoins:

This rejoinder clarifies that there is significant agreement between my position and that of Homer and Oliva as elaborated in their response. Where we differ is largely to the extent that quantification offers worthwhile benefit over and above analysis from qualitative analysis (diagrams and discourse) alone. Quantification may indeed offer potential value in many cases, though even here it may not actually represent ‘‘value for money’’. However, even more concerning is that in other cases the risks associated with attempting to quantify multiple and poorly understood soft relationships are likely to outweigh whatever potential benefit there might be. To support these propositions I add further citations to published work that recount effective qualitative-only based studies, and I offer a further real-world example where any attempts to quantify ‘‘multiple softness’’ could have lead to confusion rather than enlightenment. My proposition remains that this is an issue that deserves real research to test the positions of Homer and Oliva, myself, and no doubt others, which are at this stage largely based on personal experiences and anecdotal evidence.

Coyle (2001) Rejoinder to Homer and Oliva

My take: I agree with Coyle that qualitative models can often lead to insight. However, I don’t buy the argument that the risks of quantification of poorly understood soft variables exceeds the benefits. First, if the variables in question are really too squishy to get a grip on, that part of the modeling effort will fail. Even so, the modeler will have some other working pieces that are more physical or certain, providing insight into the context in which the soft variables operate. Second, as long as the modeler is doing things right, which means spending ample effort on validation and sensitivity analysis, the danger of dodgy quantification will reveal itself as large uncertainties in behavior subject to the assumptions in question. Third, the mere attempt  to quantify the qualitative is likely to yield some insight into the uncertain variables, which exceeds that derived from the purely qualitative approach. In fact, I would argue that the greater danger lies in the qualitative approach, because it is quite likely that plausible-looking constructs on a diagram will go unchallenged, yet harbor deep conceptual problems that would be revealed by modeling.

I see this as a cost-benefit question. With infinite resources, a model always beats a diagram. The trouble is that in many cases time, money and the will of participants are in short supply, or can’t be justified given the small scale of a problem. Often in those cases a qualitative approach is justified, and diagramming or other elicitation of structure is likely to yield a better outcome than pure talk. Also, where resources are limited, an overzealous modeling attempt could lead to narrow focus, overemphasis on easily quantifiable concepts, and implementation failure due to too much model and not enough process. If there’s a risk to modeling, that’s it – but that’s a risk of bad modeling, and there are many of those.

Faking fitness

Geoffrey Miller wonders why we haven’t met aliens. I think his proposed answer has a lot to do with the state of the world and why it’s hard to sell good modeling.

I don’t know why this 2006 Seed article bubbled to the top of my reader, but here’s an excerpt:

The story goes like this: Sometime in the 1940s, Enrico Fermi was talking about the possibility of extraterrestrial intelligence with some other physicists. … Fermi listened patiently, then asked, simply, “So, where is everybody?” That is, if extraterrestrial intelligence is common, why haven’t we met any bright aliens yet? This conundrum became known as Fermi’s Paradox.

It looks, then, as if we can answer Fermi in two ways. Perhaps our current science over-estimates the likelihood of extraterrestrial intelligence evolving. Or, perhaps evolved technical intelligence has some deep tendency to be self-limiting, even self-exterminating. …

I suggest a different, even darker solution to the Paradox. Basically, I think the aliens don’t blow themselves up; they just get addicted to computer games. They forget to send radio signals or colonize space because they’re too busy with runaway consumerism and virtual-reality narcissism. …

The fundamental problem is that an evolved mind must pay attention to indirect cues of biological fitness, rather than tracking fitness itself. This was a key insight of evolutionary psychology in the early 1990s; although evolution favors brains that tend to maximize fitness (as measured by numbers of great-grandkids), no brain has capacity enough to do so under every possible circumstance. … As a result, brains must evolve short-cuts: fitness-promoting tricks, cons, recipes and heuristics that work, on average, under ancestrally normal conditions.

The result is that we don’t seek reproductive success directly; we seek tasty foods that have tended to promote survival, and luscious mates who have tended to produce bright, healthy babies. … Technology is fairly good at controlling external reality to promote real biological fitness, but it’s even better at delivering fake fitness—subjective cues of survival and reproduction without the real-world effects.

Fitness-faking technology tends to evolve much faster than our psychological resistance to it.

… I suspect that a certain period of fitness-faking narcissism is inevitable after any intelligent life evolves. This is the Great Temptation for any technological species—to shape their subjective reality to provide the cues of survival and reproductive success without the substance. Most bright alien species probably go extinct gradually, allocating more time and resources to their pleasures, and less to their children. They eventually die out when the game behind all games—the Game of Life—says “Game Over; you are out of lives and you forgot to reproduce.”

I think the shorter version might be,

The secret of life is honesty and fair dealing… if you can fake that, you’ve got it made. – Attributed to Groucho Marx

The general problem for corporations and countries is that there’s a big problem attributing success to individuals. People rise in power, prestige and wealth by creating the impression of fitness, rather than creating any actual fitness, as long as there are large stocks that separate action and result in time and space and causality remains unclear. That means that there are two paths to oblivion. Miller’s descent into a self-referential virtual reality could be one. More likely, I think, is sinking into a self-deluded reality that erodes key resource stocks, until catastrophe follows – nukes optional.

The antidote for the attribution problem is good predictive modeling. The trouble is, the truth isn’t selling very well. I suspect that’s partly because we have less of it than we typically think. More importantly, though, leaders who succeeded on BS and propaganda are threatened by real predictive power. The ultimate challenge for humanity, then, is to figure out how to make insight about complex systems evolutionarily successful.

Computer models running the EU? Eruptions, models, and clueless reporting

The EU airspace shutdown provides yet another example of ignorance of the role of models in policy:

Computer Models Ruining EU?

Flawed computer models may have exaggerated the effects of an Icelandic volcano eruption that has grounded tens of thousands of flights, stranded hundreds of thousands of passengers and cost businesses hundreds of millions of euros. The computer models that guided decisions to impose a no-fly zone across most of Europe in recent days are based on incomplete science and limited data, according to European officials. As a result, they may have over-stated the risks to the public, needlessly grounding flights and damaging businesses. “It is a black box in certain areas,” Matthias Ruete, the EU’s director-general for mobility and transport, said on Monday, noting that many of the assumptions in the computer models were not backed by scientific evidence. European authorities were not sure about scientific questions, such as what concentration of ash was hazardous for jet engines, or at what rate ash fell from the sky, Mr. Ruete said. “It’s one of the elements where, as far as I know, we’re not quite clear about it,” he admitted. He also noted that early results of the 40-odd test flights conducted over the weekend by European airlines, such as KLM and Air France, suggested that the risk was less than the computer models had indicated. – Financial Times

Other venues picked up similar stories:

Also under scrutiny last night was the role played by an eight-man team at the Volcanic Ash Advisory Centre at Britain’s Meteorological Office. The European Commission said the unit started the chain of events that led to the unprecedented airspace shutdown based on a computer model rather than actual scientific data. – National Post

These reports miss a number of crucial points:

  • The decision to shut down the airspace was political, not scientific. Surely the Met Office team had input, but not the final word, and model results were only one input to the decision.
  • The distinction between computer models and “actual scientific data” is false. All measurements involve some kind of implicit model, required to interpret the result. The 40 test flights are meaningless without some statistical interpretation of sample size and so forth.
  • It’s not uncommon for models to demonstrate that data are wrong or misinterpreted.
  • The fact that every relationship or parameter in a model can’t be backed up with a particular measurement does not mean that the model is unscientific.
    • Numerical measurements are not the only valid source of data; there are also laws of physics, and a subject matter expert’s guess is likely to be better than a politician’s.
    • Calibration of the aggregate result of a model provides indirect measurement of uncertain components.
    • Feedback structure may render some parameters insensitive and therefore unimportant.
  • Good decisions sometimes lead to bad outcomes.

The reporters, and maybe also the director-general (covering his you-know-what), have neatly shifted blame, turning a problem in decision making under uncertainty into an anti-science witch hunt. What alternative to models do they suggest? Intuition? Prayer? Models are just a way of integrating knowledge in a formal, testable, shareable way. Sure, there are bad models, but unlike other bad ideas, it’s at least easy to identify their problems.

Thanks to Jack Dirmann, Green Technology for the tip.

Fuzzy VISION

Like spreadsheets, open-loop models are popular but flawed tools. An open loop model is essentially a scenario-specification tool. It translates user input into outcomes, without any intervening dynamics. These are common in public discourse. An example turned up in the very first link when I googled “regional growth forecast”:

The growth forecast is completed in two stages. During the first stage SANDAG staff produces a forecast for the entire San Diego region, called the regionwide forecast. This regionwide forecast does not include any land use constraints, but simply projects growth based on existing demographic and economic trends such as fertility rates, mortality rates, domestic migration, international migration, and economic prosperity.

In other words, there’s unidirectional causality from inputs  to outputs, ignoring the possible effects of the outputs (like prosperity) on the inputs (like migration). Sometimes such scenarios are useful as a starting point for thinking about a problem. However, with no estimate of the likelihood of realization of such a scenario, no understanding of the feedback that would determine the outcome, and no guidance about policy levers that could be used to shape the future, such forecasts won’t get you very far (but they might get you pretty deep – in trouble).

The key question for any policy, is “how do you get there from here?” Models can help answer such questions. In California, one key part of the low-carbon fuel standard (LCFS) analysis was VISION-CA. I wondered what was in it, so I took it apart to see. The short answer is that it’s an open-loop model that demonstrates a physically-feasible path to compliance, but leaves the user wondering what combination of vehicle and fuel prices and other incentives would actually get consumers and producers to take that path.

First, it’s laudable that the model is publicly available for critique, and includes macros that permit replication of key results. That puts it ahead of most analyses right away. Unfortunately, it’s a spreadsheet, which makes it tough to know what’s going on inside.

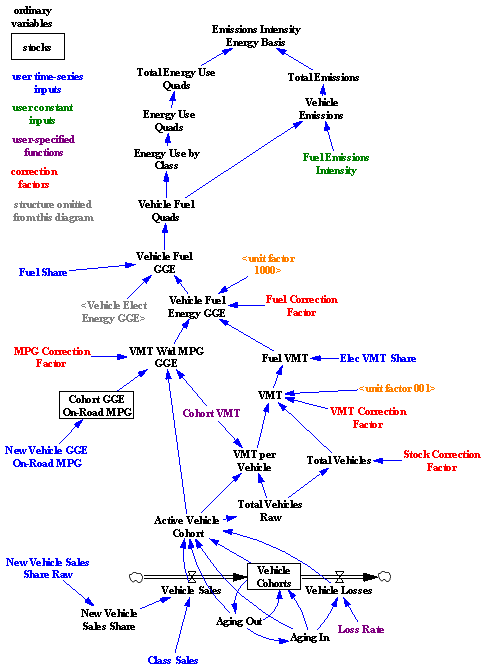
I translated some of the model core to Vensim for clarity. Here’s the structure:

VISION-CA

Bringing the structure into the light reveals that it’s basically a causal tree – from vehicle sales, fuel efficiency, fuel shares, and fuel intensity to emissions. There is one pair of minor feedback loops, concerning the aging of the fleet and vehicle losses. So, this is a vehicle accounting tool that can tell you the consequences of a particular pattern of new vehicle and fuel sales. That’s already a lot of useful information. In particular, it enforces some reality on scenarios, because it imposes the fleet turnover constraint, which imposes a delay in implementation from the time it takes for the vehicle capital stock to adjust. No overnight miracles allowed.

What it doesn’t tell you is whether a particular measure, like an LCFS, can achieve the desired fleet and fuel trajectory with plausible prices and other conditions. It also can’t help you to decide whether an LCFS, emissions tax, or performance mandate is the better policy. That’s because there’s no consumer choice linking vehicle and fuel cost and performance, consumer knowledge, supplier portfolios, and technology to fuel and vehicle sales. Since equilibrium analysis suggests that there could be problems for the LCFS, and disequilibrium generally makes things harder rather than easier, those omissions are problematic.

Continue reading “Fuzzy VISION”

The Trouble with Spreadsheets

As a prelude to my next look at alternative fuels models, some thoughts on spreadsheets.

Everyone loves to hate spreadsheets, and it’s especially easy to hate Excel 2007 for rearranging the interface: a productivity-killer with no discernible benefit. At the same time, everyone uses them. Magne Myrtveit wonders, Why is the spreadsheet so popular when it is so bad?

Spreadsheets are convenient modeling tools, particularly where substantial data is involved, because numerical inputs and outputs are immediately visible and relationships can be created flexibly. However, flexibility and visibility quickly become problematic when more complex models are involved, because:

  • Structure is invisible and equations, using row-column addresses rather than variable names, are sometimes incomprehensible.
  • Dynamics are difficult to represent; only Euler integration is practical, and propagating dynamic equations over rows and columns is tedious and error-prone.
  • Without matrix subscripting, array operations are hard to identify, because they are implemented through the geography of a worksheet.
  • Arrays with more than two or three dimensions are difficult to work with (row, column, sheet, then what?).
  • Data and model are mixed, so that it is easy to inadvertently modify a parameter and save changes, and then later be unable to easily recover the differences between versions. It’s also easy to break the chain of causality by accidentally replacing an equation with a number.
  • Implementation of scenario and sensitivity analysis requires proliferation of spreadsheets or cumbersome macros and add-in tools.
  • Execution is slow for large models.
  • Adherence to good modeling practices like dimensional consistency is impossible to formally verify

For some of the reasons above, auditing the equations of even a modestly complex spreadsheet is an arduous task. That means spreadsheets hardly ever get audited, which contributes to many of them being lousy. (An add-in tool called Exposé can get you out of that pickle to some extent.)

There are, of course, some benefits: spreadsheets are ubiquitous and many people know how to use them. They have pretty formatting and support a wide variety of data input and output. They support many analysis tools, especially with add-ins.

For my own purposes, I generally restrict spreadsheets to data pre- and post-processing. I do almost everything else in Vensim or a programming language. Even seemingly trivial models are better in Vensim, mainly because it’s easier to avoid unit errors, and more fun to do sensitivity analysis with Synthesim.

How to critique a model (and build a model that withstands critique)

Long ago, in the MIT SD PhD seminar, a group of us replicated and critiqued a number of classic models. Some of those formed the basis for my model library. Around that time, Liz Keating wrote a nice summary of “How to Critique a Model.” That used to be on my web site in the mid-90s, but I lost track of it. I haven’t seen an adequate alternative, so I recently tracked down a copy. Here it is: SD Model Critique (thanks, Liz). I highly recommend a look, especially with the SD conference paper submission deadline looming.

A Tale of Three Models – LCFS in Equilibrium

This is the first of several posts on models of the transition to alternative fuel vehicles. The first looks at a static equilibrium model of the California Low Carbon Fuel Standard (LCFS). Another will look at another model of the LCFS, called VISION-CA, which generates fuel carbon intensity scenarios. Finally, I’ll discuss Jeroen Struben’s thesis, which is a full dynamic model that closes crucial loops among vehicle fleets, consumer behavior, fueling infrastructure, and manufacturers’ learning. At some point I will try to put the pieces together into a general reflection on alt fuel policy.

Those who know me might be surprised to see me heaping praise on a static model, but I’m about to do so. Not every problem is dynamic, and sometimes a comparative statics exercise yields a lot of insight.

In a no-longer-so-new paper, Holland, Hughes, and Knittel work out the implications of the LCFS and some variants. In a nutshell, a low carbon fuel standard is one of a class of standards that requires providers of a fuel (or managers of some kind of portfolio) to meet some criteria on average – X grams of carbon per MJ of fuel energy, or Y% renewable content, for example. If trading is allowed (fun, no?), then the constraint effectively applies to the market portfolio as a whole, rather than to individual providers, which should be more efficient. The constraint in effect requires the providers to set up an internal tax and subsidy system – taxing products that don’t meet the standard, and subsidizing those that do. The LCFS sounds good on paper, but when you do the math, some problems emerge:

We show this decreases high-carbon fuel production but increases low-carbon fuel production, possibly increasing net carbon emissions. The LCFS cannot be efficient, and the best LCFS may be nonbinding. We simulate a national LCFS on gasoline and ethanol. For a broad parameter range, emissions decrease; energy prices increase; abatement costs are large ($80-$760 billion annually); and average abatement costs are large ($307-$2,272 per CO tonne). A cost effective policy has much lower average abatement costs ($60-$868).

Continue reading “A Tale of Three Models – LCFS in Equilibrium”