Read all about it at Climate Interactive.
Category: Policy
One child at the crossroads
China’s one child policy is at its 30th birthday. Inside-Out China has a quick post on the debate over the future of the policy. That caught my interest, because I’ve seen recent headlines calling for an increase in China’s population growth to facilitate dealing with an aging population – a potentially disastrous policy that nevertheless has adherents in many countries, including the US.
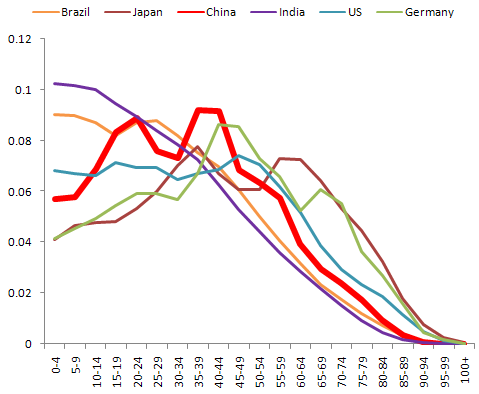
Here are the age structures of some major countries, young and old:
Vertical axis indicates the fraction of the population that resides in each age category.
Germany and Japan have the pig-in-the-python shape that results from falling birthrates. The US has a flatter age structure, presumably due to a combination of births and immigration. Brazil and India have very young populations, with the mode at the left hand side. Given the delay between birth and fertility, that builds in a lot of future growth.
Compared to Germany and Japan, China hardly seems to be on the verge of an aging crisis. In any case, given the bathtub delay between birth and maturity, a baby boom wouldn’t improve the dependency ratio for almost two decades.
More importantly, growth is not a sustainable strategy for coping with aging. At the same time that growth augments labor, it dilutes the resource base and capital available per capita. If you believe that people are the ultimate resource, i.e. that increasing returns to human capital will create offsetting technical opportunities, that might work. I rather doubt that’s a viable strategy though; human capital is more than just warm bodies (of which there’s no shortage); it’s educated and productive bodies – which are harder to get. More likely, a growth strategy just accelerates the arrival of resource constraints. In any case, the population growth play is not robust to uncertainty about future returns to human capital – if there are bumps on the technical road, it’s disastrous.
To say that population growth is a bad strategy for China is not necessarily to say that the one child policy should stay. If its enforcement is spotty, perhaps lifting it would be a good thing. Focusing on incentives and values that internalize population tradeoffs might lead to a better long term outcome than top-down control.
Painting ourselves into a green corner
At the Green California Summit & Expo this week, I saw a strange sight: a group of greentech manufacturers hanging out in the halls, griping about environmental regulations. Their point? That a surfeit of command-and-control measures makes compliance such a lengthy and costly process that it’s hard to bring innovations to market. That’s a nice self-defeating outcome!
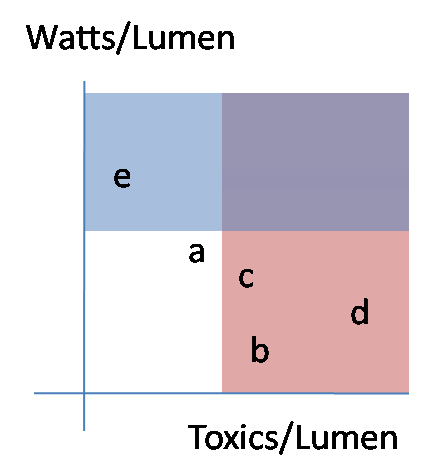
Consider this situation:
I was thinking of lighting, but it could be anything. Letters a-e represent technologies with different properties. The red area is banned as too toxic. The blue area is banned as too inefficient. That leaves only technology a. Maybe that’s OK, but what if a is made in Cuba, or emits harmful radiation, or doesn’t work in cold weather? That’s how regulations get really complicated and laden with exceptions. Also, if we revise our understanding of toxics, how should we update this to reflect the tradeoffs between toxics in the bulb and toxics from power generation, or using less toxic material per bulb vs. using fewer bulbs? Notice that the only feasible option here – a – is not even on the efficient frontier; a mix of e and b could provide the same light with slightly less power and toxics.
Proliferation of standards creates a situation with high compliance costs, both for manufacturers and the bureaucracy that has to administer them. That discourages small startups, leaving the market for large firms, which in turn creates the temptation for the incumbents to influence the regulations in self-serving ways. There are also big coverage issues: standards have to be defined clearly, which usually means that there are fringe applications that escape regulation. Refrigerators get covered by Energy Star, but undercounter icemakers and other cold energy hogs don’t. Even when the standards work, lack of a price signal means that some of their gains get eaten up by rebound effects. When technology moves on, today’s seemingly sensible standard becomes part of tomorrow’s “dumb laws” chain email.
The solution is obviously not total laissez faire; then the environmental goals just don’t get met. There probably are some things that are most efficient to ban outright (but not the bulb), but for most things it would be better to impose upstream prices on the problems – mercury, bisphenol A, carbon, or whatever – and let the market sort it out. Then providers can make tradeoffs the way they usually do – which package of options makes the cheapest product? -without a bunch of compliance risk involved in bringing their product to market.
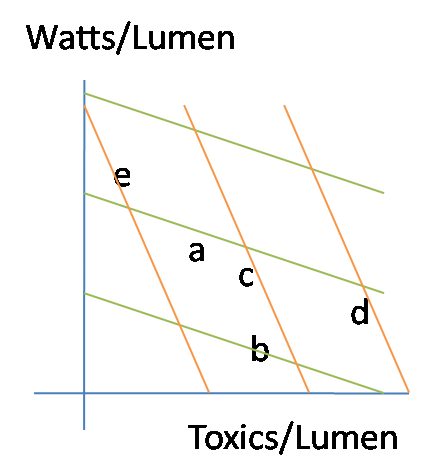
Here’s the alternative scheme:
The green and orange lines represent isocost curves for two different sets of energy and toxic prices. If the unit prices of a-e were otherwise the same, you’d choose b with the green pricing scheme (cheap toxics, expensive energy) and e in the opposite circumstance (orange). If some of the technologies are uniquely valuable in some situations, pricing also permits that tradeoff – perhaps c is not especially efficient or clean, but has important medical applications.
With a system driven by prices and values, we could have very simple conversations about adaptive environmental control. Are NOx levels acceptable? If not, raise the price of emitting NOx until it is. End of discussion.
Two related tidbits:
Fed green buildings guru Kevin Kampschroer gave an interesting talk on the GSA’s greening efforts. He expressed hope that we could move from LEED (checklists) to LEEP (performance-based ratings).
I heard from a lighting manufacturer that the cost of making a CFL is under a buck, but running a recycling program (for mercury recapture) costs $1.50/bulb. There must be a lot of markup in the distribution channels to get them up to retail prices.
State of the global deal, Feb 2010
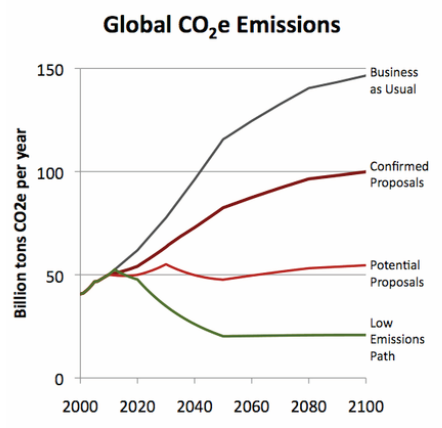
Somehow I forgot to mention our latest release:
The “Confirmed Proposals” emissions above translate into temperature rise of 3.9C (7F) in 2100. More details on the CI blog. The widget still stands where we left it in Copenhagen:
The lure of border carbon adjustments
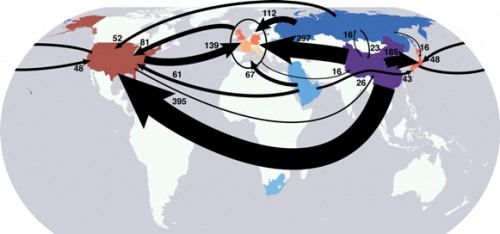
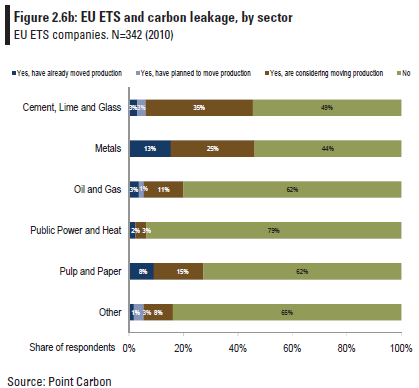
Are border carbon adjustments (BCAs) the wave of the future? Consider these two figures:
The first shows the scale of carbon embodied in trade. The second, even if it overstates true intentions, demonstrates the threat of carbon outsourcing. Both are compelling arguments for border adjustments (i.e. tariffs) on GHG emissions.
I think things could easily go this route: it’s essentially a noncooperative route to a harmonized global carbon price. Unlike global emissions trading, it’s not driven by any principle of fair allocation of property rights in the atmosphere; instead it serves the more vulgar notion that everyone (or at least every nation) keeps their own money.
Consider the pros and cons:
Advocates of BCAs claim that the measures are intended to address three factors. First, competitiveness concerns where some industries in developed countries consider that a BCA will protect their global competitiveness vis-a-vis industries in countries that do not apply the same requirements. The second argument for BCAs is ‘carbon leakage’ – the notion that emissions might move to countries where rules are less stringent. A third argument, of the highest political relevance, has to do with ‘leveraging’ the participation of developing countries in binding mitigation schemes or to adopt comparable measures to offset emissions by their own industries.
from a developing country perspective, at least three arguments run counter to that idea: 1) that the use of BCAs is a prima facie violation of the spirit and letter of multilateral trade principles and norms that require equal treatment among equal goods; 2) that BCAs are a disguised form of protectionism; and 3) that BCAs undermine in practice the principle of common but differentiated responsibilities.
In other words: the advocates are a strong domestic constituency with material arguments in places where BCAs might arise. The opponents are somewhere else and don’t get to vote, and armed with legalistic principles more than fear and greed.
Fuzzy VISION
Like spreadsheets, open-loop models are popular but flawed tools. An open loop model is essentially a scenario-specification tool. It translates user input into outcomes, without any intervening dynamics. These are common in public discourse. An example turned up in the very first link when I googled “regional growth forecast”:
The growth forecast is completed in two stages. During the first stage SANDAG staff produces a forecast for the entire San Diego region, called the regionwide forecast. This regionwide forecast does not include any land use constraints, but simply projects growth based on existing demographic and economic trends such as fertility rates, mortality rates, domestic migration, international migration, and economic prosperity.
In other words, there’s unidirectional causality from inputs to outputs, ignoring the possible effects of the outputs (like prosperity) on the inputs (like migration). Sometimes such scenarios are useful as a starting point for thinking about a problem. However, with no estimate of the likelihood of realization of such a scenario, no understanding of the feedback that would determine the outcome, and no guidance about policy levers that could be used to shape the future, such forecasts won’t get you very far (but they might get you pretty deep – in trouble).
The key question for any policy, is “how do you get there from here?” Models can help answer such questions. In California, one key part of the low-carbon fuel standard (LCFS) analysis was VISION-CA. I wondered what was in it, so I took it apart to see. The short answer is that it’s an open-loop model that demonstrates a physically-feasible path to compliance, but leaves the user wondering what combination of vehicle and fuel prices and other incentives would actually get consumers and producers to take that path.
First, it’s laudable that the model is publicly available for critique, and includes macros that permit replication of key results. That puts it ahead of most analyses right away. Unfortunately, it’s a spreadsheet, which makes it tough to know what’s going on inside.
I translated some of the model core to Vensim for clarity. Here’s the structure:
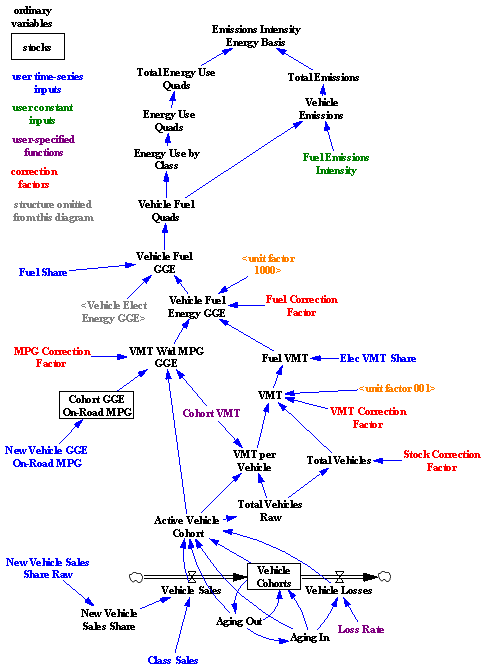
Bringing the structure into the light reveals that it’s basically a causal tree – from vehicle sales, fuel efficiency, fuel shares, and fuel intensity to emissions. There is one pair of minor feedback loops, concerning the aging of the fleet and vehicle losses. So, this is a vehicle accounting tool that can tell you the consequences of a particular pattern of new vehicle and fuel sales. That’s already a lot of useful information. In particular, it enforces some reality on scenarios, because it imposes the fleet turnover constraint, which imposes a delay in implementation from the time it takes for the vehicle capital stock to adjust. No overnight miracles allowed.
What it doesn’t tell you is whether a particular measure, like an LCFS, can achieve the desired fleet and fuel trajectory with plausible prices and other conditions. It also can’t help you to decide whether an LCFS, emissions tax, or performance mandate is the better policy. That’s because there’s no consumer choice linking vehicle and fuel cost and performance, consumer knowledge, supplier portfolios, and technology to fuel and vehicle sales. Since equilibrium analysis suggests that there could be problems for the LCFS, and disequilibrium generally makes things harder rather than easier, those omissions are problematic.
LCFS in Equilibrium II
My last post introduced some observations from simulation of an equilibrium fuel portfolio standard model:
- knife-edge behavior of market volume of alternative fuels as you approach compliance limits (discussed last year): as the required portfolio performance approaches the performance of the best component options, demand for those approaches 100% of volume rapidly.
- differences in the competitive landscape for technology providers, when compared to alternatives like a carbon tax.
- differences in behavior under uncertainty.
- perverse behavior when the elasticity of substitution among fuels is low
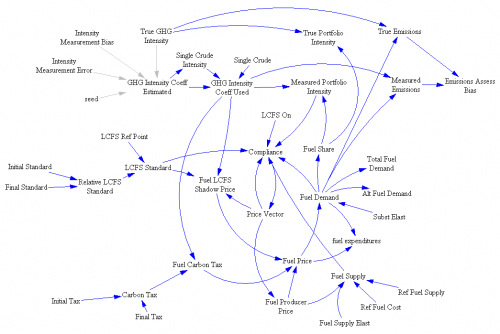
Here are some of the details. First, the model:
Notice that this is not a normal SD model – there are loops but no stocks. That’s because this is a system of simultaneous equations solved in equilibrium. The Vensim FIND ZERO function is used to find a vector of prices (one for each fuel, plus the shadow price of emissions intensity) that matches supply and demand, subject to the intensity constraint.
A Tale of Three Models – LCFS in Equilibrium
This is the first of several posts on models of the transition to alternative fuel vehicles. The first looks at a static equilibrium model of the California Low Carbon Fuel Standard (LCFS). Another will look at another model of the LCFS, called VISION-CA, which generates fuel carbon intensity scenarios. Finally, I’ll discuss Jeroen Struben’s thesis, which is a full dynamic model that closes crucial loops among vehicle fleets, consumer behavior, fueling infrastructure, and manufacturers’ learning. At some point I will try to put the pieces together into a general reflection on alt fuel policy.
Those who know me might be surprised to see me heaping praise on a static model, but I’m about to do so. Not every problem is dynamic, and sometimes a comparative statics exercise yields a lot of insight.
In a no-longer-so-new paper, Holland, Hughes, and Knittel work out the implications of the LCFS and some variants. In a nutshell, a low carbon fuel standard is one of a class of standards that requires providers of a fuel (or managers of some kind of portfolio) to meet some criteria on average – X grams of carbon per MJ of fuel energy, or Y% renewable content, for example. If trading is allowed (fun, no?), then the constraint effectively applies to the market portfolio as a whole, rather than to individual providers, which should be more efficient. The constraint in effect requires the providers to set up an internal tax and subsidy system – taxing products that don’t meet the standard, and subsidizing those that do. The LCFS sounds good on paper, but when you do the math, some problems emerge:
We show this decreases high-carbon fuel production but increases low-carbon fuel production, possibly increasing net carbon emissions. The LCFS cannot be efficient, and the best LCFS may be nonbinding. We simulate a national LCFS on gasoline and ethanol. For a broad parameter range, emissions decrease; energy prices increase; abatement costs are large ($80-$760 billion annually); and average abatement costs are large ($307-$2,272 per CO tonne). A cost effective policy has much lower average abatement costs ($60-$868).
Continue reading “A Tale of Three Models – LCFS in Equilibrium”
Dumb and Dumber
Not to be outdone by Utah, South Dakota has passed its own climate resolution.
They raise the ante – where Utah cherry-picked twelve years of data, South Dakotans are happy with only 8. Even better, their pattern matching heuristic violates bathtub dynamics:
WHEREAS, the earth has been cooling for the last eight years despite small increases in anthropogenic carbon dioxide
They have taken the skeptic claim, that there’s little warming in the tropical troposphere, and bumped it up a notch:
WHEREAS, there is no evidence of atmospheric warming in the troposphere where the majority of warming would be taking place
Nope, no trend here:
Legislating Science
The Utah House has declared that CO2 is harmless. The essence of the argument in HJR 12: temperature’s going down, climategate shows that scientists are nefarious twits, whose only interest is in riding the federal funding gravy train, and emissions controls hurt the poor. While it’s reassuring that global poverty is a big concern of Utah Republicans, the scientific observations are egregiously bad:
29 WHEREAS, global temperatures have been level and declining in some areas over the
30 past 12 years;
31 WHEREAS, the “hockey stick” global warming assertion has been discredited and
32 climate alarmists’ carbon dioxide-related global warming hypothesis is unable to account for
33 the current downturn in global temperatures;
34 WHEREAS, there is a statistically more direct correlation between twentieth century
35 temperature rise and Chlorofluorocarbons (CFCs) in the atmosphere than CO2;
36 WHEREAS, outlawed and largely phased out by 1978, in the year 2000 CFC’s began to
37 decline at approximately the same time as global temperatures began to decline;
…
49 WHEREAS, Earth’s climate is constantly changing with recent warming potentially an
50 indication of a return to more normal temperatures following a prolonged cooling period from
51 1250 to 1860 called the “Little Ice Age”;
The list cherry-picks skeptic arguments that rely on a few papers (if that), nearly all thoroughly discredited. There are so many things wrong here that it’s not worth the electrons to refute them one by one. The quality of their argument calls to mind to the 1897 attempt in Indiana to legislate that pi = 3.2. It’s sad that this resolution’s supporters are too scientifically illiterate to notice, or too dishonest to care. There are real uncertainties about climate; it would be nice to see a legislative body really grapple with the hard questions, rather than chasing red herrings.