Changes afoot

I’m looking forward to some changes in my role at Ventana Systems. From the recent Vensim announcement:

Dear Vensim Community,

We would like to alert you to some exciting changes to the Vensim team.

Bob Eberlein, who has been head of development since almost the beginning of Vensim, has decided to embark on a new chapter of his life, starting in January. While we are sad to see him go, we greatly appreciate all of his efforts and accomplishments over the past 22 years, and wish him the very best in his new adventures.

Vensim is extremely important to our efforts here at Ventana Systems and we know that it is also important to many of you in the System Dynamics community. We are fully committed to maintaining Vensim as the leading System Dynamics software platform and to extending its features and capabilities. We have increased our investment in Vensim with the following team:

Tom Fiddaman has taken on an additional role as Vensim Product Manager. He will make sure that new releases of Vensim address market requirements and opportunities. He will facilitate information flow between the community, our user base, and the Vensim design team.

• Tony Kennedy from Ventana Systems UK will lead the Customer Services functions, including order fulfillment, bug resolution, and the master training schedule. He will also support the Distributor network. Tony has been working with UK Vensim customers for over 10 years.

• Larry Yeager has recently joined Ventana Systems to head the future development of Vensim. Larry has led the development of many software products and applications, including the Jitia System Dynamics software for PA Consulting.

• We have formed a steering team that will provide guidance and expertise to our future product development. This team includes Alan Graham, Tony Kennedy, Tom Fiddaman, Marios Kagarlis, and David Peterson.

We are very excited about the future and look forward to continuing our great relationships with you, our clients and friends.

Most sincerely,

Laura Peterson

President & CEO

Ventana Systems, Inc.

Statistics >> Calculus ?

Another TED talk argues for replacing calculus with statistics at the pinnacle of mathematics education.

There’s an interesting discussion at Wild About Math!.

I’m a bit wary of the idea. First, I don’t think there needs to be a pinnacle – math can be a Bactrian camel. Second, some of the concepts are commingled anyway (limits and convergence, for example), so it hardly makes sense to treat them as competitors. Third, both are hugely important to good decision making (which is ultimately what we want out of education). Fourth, the world is a dynamic, stochastic system, so you need to understand a little of each.

Where the real opportunity lies, I think, is in motivating the teaching of both experientially. Start calculus with stocks and flows and physical systems, and start statistics with games of chance and estimation. Use both to help people learn how to make better inferences about a complex world. Then do the math as it gets interesting and necessary. Whether you come at the problem from the angle of dynamics or uncertainty first hardly matters.

Firefighting and other project dynamics

The tipping loop, a positive feedback that drives sequential or concurrent projects into permanent firefighting mode, is actually just one of a number of positive feedbacks that create project management traps. Here are some others:

  • Rework – the rework cycle is central to project dynamics. Rework arises when things aren’t done right the first time. When errors are discovered, tasks have to be reworked, and there’s no guarantee that they’ll be done right the second time either. This creates a reinforcing loop that bloats project tasks beyond what’s expected with perfect execution.
  • Brooks’ Law – adding resources to a late project makes it later. There are actually several feedback loops involved:
    • Rookie effects: new resources take time to get up to speed. Until they do, they eat up the time of senior staff, decreasing output. Also, they’re likely to be more error prone, creating more rework to be dealt with downstream.
    • Diseconomies of scale from communication overhead.
  • Burnout – under schedule pressure, it’s tempting to work harder and longer. That works briefly, but sustained overtime is likely to be counterproductive, due to decreases in productivity, turnover, and increases in error rates.
  • Congestion – in construction or assembly, a delay in early phases may not delay the arrival of materials from suppliers. Unused materials stack up, congesting the work site and slowing progress further.
  • Dilution – trying to overcome stalled phases by tackling too many tasks in parallel thins resources to the point that overhead consumes all available time, and progress grinds to a halt.
  • Hopelessness – death marches are no fun, and the mere fact that a project is going astray hurts morale, leading to decreased productivity and loss of resources as rats leave the sinking ship.

Any number of things can contribute to schedule pressure that triggers these traps. Often the trigger is external, such as late-breaking change orders or regulatory mandates. However, it can also arise internally through scope creep. As long as it appears that a project is on schedule (a supposition that’s likely to prove false in hindsight), it’s hard to resist additional feature requests and suppress gold-plating urges of developers.

Taylor & Ford integrate a number of these dynamics into a simple model of single-project tipping points. They generically characterize the “ripple effect” via a few parameters: one characterizes “the amount of impact that reworked portions of the project have on the total work required to complete the project” and another captures the effect of schedule pressure on generation of rework. They suggest a robust design approach that keeps projects out of trouble, by ensuring that the vicious cycles created by these loops do not become dominant.

Because projects are complicated nests of feedback, it’s not surprising that we manage them poorly. Cognitive biases and learned heuristics can exacerbate the effect of vicious cycles arising from the structure of the work itself. For example,

… many organizations reward and promote engineers based on their ability to save troubled projects. Consider, for example, one senior manager’s reflection on how developers in his organizations were rewarded:

Occasionally there is a superstar of an engineer or a manager that can take one of these late changes and run through the gauntlet of all the possible ways that it could screw up and make it a success. And then we make a hero out of that person. And everybody else who wants to be a hero says “Oh, that is what is valued around here.” It is not valued to do the routine work months in advance and do the testing and eliminate all the problems before they become problems. …

… allowing managers to “save” troubled projects, and therefore receive accolades and benefits, creates a situation in which, for those interested in advancement, there is little incentive to execute a project properly from start to finish. While allowing such heroics may help in the short run, the long run health of the development system is better served by not rewarding them.

Repenning, Gonçalves & Black (2001) CMR

… much of the complexity of concurrent development—and the implementation failures that plague many organizations—arises from interactions between the technical and behavioral dimensions. We use a dynamic project model that explicitly represents these interactions to investigate how a ‘‘Liar’s Club’’—concealing known rework requirements from managers and colleagues—can aggravate the ‘‘90% syndrome,’’ a common form of schedule failure, and disproportionately degrade schedule performance and project quality.

Sterman & Ford (2003) Concurrent Engineering

Once caught in a downward spiral, managers must make some attribution of cause. The psychology literature also contains ample evidence suggesting that managers are more likely to attribute the cause of low performance to the attitudes and dispositions of people working within the process rather than to the structure of the process itself …. Thus, as performance begins to decline due to the downward spiral of fire fighting, managers are not only unlikely to learn to manage the system better, they are also likely to blame participants in the process. To make matters even worse, the system provides little evidence to discredit this hypothesis. Once fire fighting starts, system performance continues to decline even if the workload returns to its initial level. Further, managers will observe engineers spending a decreasing fraction of their time on up-front activities like concept development, providing powerful evidence confirming the managers’ mistaken belief that engineers are to blame for the declining performance.

Finally, having blamed the cause of low performance on those who work within the process, what actions do managers then take? Two are likely. First, managers may be tempted to increase their control over the process via additional surveillance, more detailed reporting requirements, and increasingly bureaucratic procedures. Second, managers may increase the demands on the development process in the hope of forcing the staff to be more efficient. The insidious feature of these actions is that each amounts to increasing resource utilization and makes the system more prone to the downward spiral. Thus, if managers incorrectly attribute the cause of low performance, the actions they take both confirm their faulty attribution and make the situation worse rather than better. The end result of this dynamic is a management team that becomes increasingly frustrated with an engineering staff that they perceive as lazy, undisciplined, and unwilling to follow a pre-specified development process, and an engineering staff that becomes increasingly frustrated with managers that they feel do not understand the realities of the system and, consequently, set unachievable objectives.

Repenning (2001) JPIM

There’s a long history of the use of SD models to solve these problems, or to resolve conflicts over attribution after the fact.

The secret to successful system dynamics modeling

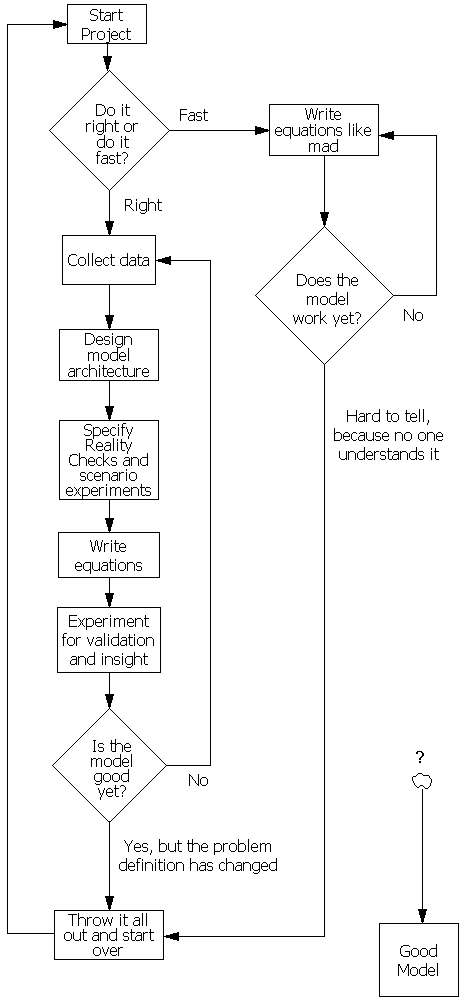
Whenever a student wandered in late to a lecture at MIT, Jim Hines would announce, “… and that’s the secret to system dynamics.” If you were one of those perpetually late students, who’s struggled without the secret ever since, I will now reveal it.

”The key to successful modeling is to keep one’s understanding of the model and what it says about the problem ahead of its size.” – Geoff Coyle, via JJ Lauble at the Vensim forum.

Maintaining understanding is really a matter of balancing model testing and critique against creation of new structure, which requires a little discipline in your modeling process. A few suggestions:

Dynamics of firefighting

SDM has a new post about failure modes in DoD procurement. One of the key dynamics is firefighting:

For example, McNew was working on a radar system attached to the belly of airplanes so they could track enemy ground movements for targeting by both ground and air fighters. “The contractor took used 707s,” McNew explains, “tore them down to the skin and stringers, determined their structural soundness, fixed what needed fixing, and then replaced the old systems and attached the new radar system.” But when the plane got to the last test station, some structural problems still had not been fixed, meaning the systems that had been installed had to be ripped out to fix the problems, and then the systems had to be reinstalled. In order to get that last airplane out the door on time, firefighting became the order of the day. “We had most of the people in the plant working on that one plane while other planes up the line were falling farther and farther behind schedule.”

Says McNew, putting on his systems thinking hat, “You think you’re going to get a one-to-one ratio of effort-to-result but you don’t. There’s no linear correlation. The project you’re firefighting isn’t helped as much as you think it will be, and the other project falls farther behind as it’s operating with fewer resources. In other words, you’ve doubled the dysfunction.

This has been well-characterized by a bunch of modeling work at MIT’s SD group. It’s hard to find at the moment, because Sloan seems to have vandalized its own web site. Here’s a sampling of what I could lay my hands on:

From Laura Black & Nelson Repenning in the SDR, Why Firefighting Is Never Enough: Preserving High-Quality Product Development:

… we add to insights already developed in single-project models about insufficient resource allocation and the “firefighting” and last-minute rework that often result by asking why dysfunctional resource allocation persists from project to project. …. The main insight of the analysis is that under-allocating resources to the early phases of a given project in a multi-project environment can create a vicious cycle of increasing error rates, overworked engineers, and declining performance in all future projects. Policy analysis begins with those that were under consideration by the organization described in our data set. Those policies turn out to offer relatively low leverage in offsetting the problem. We then test a sequence of new policies, each designed to reveal a different feature of the system’s structure and conclude with a strategy that we believe can significantly offset the dysfunctional dynamics we discuss. ….

The key dynamic is what they term tilting – a positive feedback that arises from the interactions among early and late phase projects. When a late phase project is in trouble, allocating more resources to it is the natural response (put out the fire; part of the balancing late phase work completion loop). The perverse side effect is that, with finite resources, firefighting steals from early phase projects that are tomorrow’s late phase projects. That means that, down the road, those projects – starved for resources earlier in their life – will be in even more trouble, and steal more resources from the next generation of early phase projects. Thus the descent into permanent firefighting begins …

blackrepenning

The positive feedback of tilting creates a trap that can snare incautious organizations. In the presence of such traps, well-intentioned policies can turn vicious.

… testing plays a paradoxical role in multi-project development environments. On the one hand, it is absolutely necessary to preserve the integrity of the final product. On the other hand, in an environment where resources are scarce, allocating additional resources to testing or to addressing the problems that testing identifies leaves fewer resources available to do the up-front work that prevents problems in the first place in subsequent projects. Thus, while a decision to increase the amount of testing can yield higher quality in the short run, it can also ignite a cycle of greater-than-expected resource requirements for projects in downstream phases, fewer resources allocated to early upstream phases, and increasingly delayed discovery of major problems.

In related work with a similar model, Repenning characterizes the tilting dynamic with a phase plot that nicely illustrates the point:

executionModes

To read the phase plot, start at any point on the horizontal axis, read up to the solid black line and then over to the vertical axis. So, for example, suppose that, in a given model year, the organization manages to accomplish about 60 percent of its planned concept development work, what happens next year? Reading up and over suggests that, if it accomplishes 60 percent of the up-front work this year, the dynamics of the system are such that about 70 percent of the up-front work will get done next year. Determining what happens in a subsequent model year requires simply returning to the horizontal axis and repeating; accomplishing 70 percent this year leads to almost 95 percent being accomplished in the year that follows. Continuing this mode of analysis shows that, if the system starts at any point to the right of the solid black circle in the center of the diagram, over time the concept development completion fraction will continue to increase until it reaches 100%. Here, the positive loop works as a virtuous cycle: Each year a little more up front work is done, decreasing errors and, thereby, reducing the need for resources in the downstream phase. …

In contrast, however, consider another example. Imagine this time that the organization starts to the left of the solid black dot and accomplishes only 40 percent of its planned concept development activities. Now, reading up and over, shows that instead of completing more early phase work in the next year, the organization completes less—in this case only about 25 percent. In subsequent years, the completion fraction declines further, creating a vicious cycle of declining attention to upfront activities and increasing error rates in design work. In this case, the system converges to a mode in which concept development work is ignored in favor of fixing problems in the downstream project.

The phase plot thus reveals two important features of the system. First, note from the discussion above that anytime the plot crosses the forty-five degree line … the execution mode in question will repeat itself. Formally, at these points the system is said to be in equilibrium. Practically, equilibria represent the possible “steady states” in the system, the execution modes that, once reached, are self-sustaining. As the plot highlights, this system has three equilibria (highlighted by the solid black circles), two at the corners and one in the center of the diagram.

Second, also note that the equilibria do not have identical characteristics. The equilibria at the two corners are stable, meaning that small excursions will be counteracted. If, for example, the system starts in the desired execution mode … and is slightly perturbed, perhaps pushing the completion fraction down to 60%, then, as the example above highlights, over time the system will return to the point from which it started  …. Similarly, if the system starts at f(s)=0 and receives an external shock, perhaps moving it to a completion fraction of 40%, then it will also eventually return to its starting point. The arrows on the plot line highlight the “direction” or trajectory of the system in disequilibrium situations. In contrast to those at the corners, the equilibrium at the center of the diagram is unstable (the arrows head “away” from it), meaning small excursions are not counteracted. Instead, once the system leaves this equilibrium, it does not return and instead heads toward one of the two corners. …

Formally, the unstable equilibrium represents the boundary between two basins of attraction. …. This boundary, or tipping point, plays a critical role in determining the system’s behavior because it is the point at which the positive loop changes direction. If the system starts in the desirable execution mode and then is perturbed, if the shock is large enough to push the system over the tipping point, it does not return to its initial equilibrium and desired execution mode. Instead, the system follows a new downward trajectory and eventually becomes trapped in the fire fighting equilibrium.

You’ll have to read the papers to get the interesting prescriptions for improvement, plus some additional dynamics of manager perceptions that accentuate the trap.

Stay tuned for a part II on this topic.

There's more than one way to aggregate cats

After getting past the provocative title, Robert Axtell’s presentation on the pitfalls of aggregation proved to be very interesting. The slides are posted here:

http://winforms.chapter.informs.org/presentation/Pathologies_of_System_Dynamics_Models-Axtell-20101021.pdf

A comment on my last post on this summed things up pretty well:

… the presentation really focused on the challenges that aggregation brings to the modeling disciplines. Axtell presents some interesting mathematical constructs that could and should form the basis for conversations, thinking, and research in the SD and other aggregate modeling arenas.

It’s worth a look.

Also, as I linked before, check out Hazhir Rahmandad’s work on agent vs. aggregate models of an infection process. His models and articles with John Sterman are here. His thesis is here.

Hazhir’s work explores two extremes – an aggregate model of infection (which is the analog of typical Bass diffusion models in marketing science) compared to agent based versions of the same process. The key difference is that the aggregate model assumes well-mixed victims, while the agent versions explicitly model contacts across various network topologies. The well-mixed assumption is often unrealistic, because it matters who is infected, not just how many. In the real world, the gain of an infection process can vary with the depth of penetration of the social network, and only the agent model can capture this in all circumstances.

However, in modeling there’s often a middle road: an aggregation approach that captures the essence of a granular process at a higher level. That’s fortunate, because otherwise we’d always be building model-maps as big as the territory. I just ran across an interesting example.

A new article in PLoS Computational Biology models obesity as a social process:

Many behavioral phenomena have been found to spread interpersonally through social networks, in a manner similar to infectious diseases. An important difference between social contagion and traditional infectious diseases, however, is that behavioral phenomena can be acquired by non-social mechanisms as well as through social transmission. We introduce a novel theoretical framework for studying these phenomena (the SISa model) by adapting a classic disease model to include the possibility for ‘automatic’ (or ‘spontaneous’) non-social infection. We provide an example of the use of this framework by examining the spread of obesity in the Framingham Heart Study Network. … We find that since the 1970s, the rate of recovery from obesity has remained relatively constant, while the rates of both spontaneous infection and transmission have steadily increased over time. This suggests that the obesity epidemic may be driven by increasing rates of becoming obese, both spontaneously and transmissively, rather than by decreasing rates of losing weight. A key feature of the SISa model is its ability to characterize the relative importance of social transmission by quantitatively comparing rates of spontaneous versus contagious infection. It provides a theoretical framework for studying the interpersonal spread of any state that may also arise spontaneously, such as emotions, behaviors, health states, ideas or diseases with reservoirs.

The very idea of modeling obesity as an infectious social process is interesting in itself. But from a technical standpoint, the interesting innovation is that they capture some of the flavor of a disaggregate representation of the population by introducing an approximation, Continue reading “There's more than one way to aggregate cats”

Positively pathological

When I see oscillatory behavior, I instinctively think “delayed negative feedback.” Normally, that’s a good guess, but not always. Sometimes it’s a limit cycle or chaos, involving nonlinearity and a blend of positive and negative feedback, but today it’s something simpler, yet weirder.

oscillation

Mohammad Mojtahedzadeh just sent me a classic model, replicated from Alan Graham’s thesis on Principles on the Relationship Between Structure and Behavior of Dynamic Systems. It’s a single positive feedback loop that doesn’t yield exponential growth, but oscillates.

What’s the trick? The loop is composed of pure integrations. The rate of change of each stock is the value of the previous stock in the loop multiplied by a constant. The pure integrations each add 90 degrees of phase lag (i.e. delay), so by the time a disturbance transits the loop, it arrives at its origin ready for a repeat performance.

The same thing occurs in a frictionless spring-mass system (think of an idealized hanging slinky), which oscillates because it is an undamped second order negative feedback loop. The states in the loop are position and momentum of the mass. Position is the integral of velocity, and momentum integrates the force that is a linear function of position. Each link is a pure integration (as long as there’s no friction, which adds a minor first-order negative loop).

So far so good, but the 4th order system is still a positive loop, so why doesn’t it grow? The trick is to initialize the system in such a way as to suppress the growth mode. To do that, we just have to initialize the system in a state that contains no component of the eigenvector corresponding with the growth mode, which is the positive real eigenvalue.

Continue reading “Positively pathological”

Return of the Afghan spaghetti

The Afghanistan counterinsurgency causal loop diagram makes another appearance in this TED talk, in which Eric Berlow shows the hypnotized chickens the light:
https://www.ted.com/talks/eric_berlow_simplifying_complexity/transcript?language=en

I’m of two minds about this talk. I love that it embraces complexity rather than reacting with the knee-jerk “eeewww … gross” espoused by so many NYT commenters. The network view of the system highlights some interesting relationships, particularly when colored by the flavor of each sphere (military, ethnic, religious … ). Also, the generic categorization of variables that are actionable (unlike terrain) is useful. The insights from ecosystem simplification are potentially quite interesting, though we really only get a tantalizing hint at what might lie beneath.

However, I think the fundamental analogy between the system CLD and a food web or other network may only partially hold. That means that the insight, that influence typically lies within a few degrees of connectivity of the concept of interest, may not be generalizable. Generically, a dynamic model is a network of gains among state variables, and there are perhaps some reasons to think that, due to signal attenuation and so forth, that most influences are local. However, there are some important differences between the Afghan CLD and typical network diagrams.

In a food web, the nodes are all similar agents (species) which have a few generic relationships (eat or be eaten) with associated flows of information or resources. In a CLD, the nodes are a varied mix of agents, concepts, and resources. As a result, their interactions may differ wildly: the interaction between “relative popularity of insurgents” and “funding for insurgents” (from the diagram) is qualitatively different from that between “targeted strikes” and “perceived damages.” I suspect that in many models, the important behavior modes are driven by dynamics that span most of the diagram or model. That may be deliberate, because we’d like to construct models that describe a dynamic hypothesis, without a lot of extraneous material.

Probably the best way to confirm or deny my hypothesis would be to look at eigenvalue analysis of existing models. I don’t have time to dig into this, but Kampmann & Oliva’s analysis of Mass’ economic model is an interesting case study. In that model, the dominant structures responsible for oscillatory modes in the economy are a real mixed bag, with important contributions from both short and longish loops.

This bears further thought … please share yours, especially if you have a chance to look at Berlow’s PNAS article on food webs.

Cheese is Murder

Needlessly provocative title notwithstanding, the dairy industry has to be one of the most spectacular illustrations of the battle for control of system leverage points. In yesterday’s NYT:

Domino’s Pizza was hurting early last year. Domestic sales had fallen, and a survey of big pizza chain customers left the company tied for the worst tasting pies.

Then help arrived from an organization called Dairy Management. It teamed up with Domino’s to develop a new line of pizzas with 40 percent more cheese, and proceeded to devise and pay for a $12 million marketing campaign.

Consumers devoured the cheesier pizza, and sales soared by double digits. “This partnership is clearly working,” Brandon Solano, the Domino’s vice president for brand innovation, said in a statement to The New York Times.

But as healthy as this pizza has been for Domino’s, one slice contains as much as two-thirds of a day’s maximum recommended amount of saturated fat, which has been linked to heart disease and is high in calories.

And Dairy Management, which has made cheese its cause, is not a private business consultant. It is a marketing creation of the United States Department of Agriculture — the same agency at the center of a federal anti-obesity drive that discourages over-consumption of some of the very foods Dairy Management is vigorously promoting.

Urged on by government warnings about saturated fat, Americans have been moving toward low-fat milk for decades, leaving a surplus of whole milk and milk fat. Yet the government, through Dairy Management, is engaged in an effort to find ways to get dairy back into Americans’ diets, primarily through cheese.

Now recall Donella Meadows’ list of system leverage points:

Leverage points to intervene in a system (in increasing order of effectiveness)
12. Constants, parameters, numbers (such as subsidies, taxes, standards)
11. The size of buffers and other stabilizing stocks, relative to their flows
10. The structure of material stocks and flows (such as transport network, population age structures)
9. The length of delays, relative to the rate of system changes
8. The strength of negative feedback loops, relative to the effect they are trying to correct against
7. The gain around driving positive feedback loops
6. The structure of information flow (who does and does not have access to what kinds of information)
5. The rules of the system (such as incentives, punishment, constraints)
4. The power to add, change, evolve, or self-organize system structure
3. The goal of the system
2. The mindset or paradigm that the system – its goals, structure, rules, delays, parameters – arises out of
1. The power to transcend paradigms

The dairy industry has become a master at exercising these points, in particular using #4 and #5 to influence #6, resulting in interesting conflicts about #3.

Specifically, Dairy Management is funded by a “checkoff” (effectively a tax) on dairy output. That money basically goes to marketing of dairy products. A fair amount of that is done in stealth mode, through programs and information that appear to be generic nutrition advice, but happen to be funded by the NDC, CNFI, or other arms of Dairy Management. For example, there’s http://www.nutritionexplorations.org/ – for kids, they serve up pizza:

nutritionexplorations

That slice of “combination food” doesn’t look very nutritious to me, especially if it’s from the new Dominos line DM helped create. Notice that it’s cheese pizza, devoid of toppings. And what’s the gratuitous bowl of mac & cheese doing there? Elsewhere, their graphics reweight the food pyramid (already a grotesque product of lobbying science), to give all components equal visual weight. This systematic slanting of nutrition information is a nice example of my first deadly sin of complex system management.

A conspicuous target of dubious dairy information is school nutrition programs. Consider this, from GotMilk:

Flavored milk contributes only small amounts of added sugars to children ‘s diets. Sodas and fruit drinks are the number one source of added sugars in the diets of U.S. children and adolescents, while flavored milk provides only a small fraction (< 2%) of the total added sugars consumed.

It’s tough to fact-check this, because the citation doesn’t match the journal. But it seems likely that the statement that flavored milk provides only a small fraction of sugars is a red herring, i.e. that it arises because flavored milk is a small share of intake, rather than because the marginal contribution of sugar per unit flavored milk is small. Much of the rest of the information provided is a similar riot of conflated correlation and causation and dairy-sponsored research. I have to wonder whether innovations like flavored milk are helpful, because they displace sugary soda, or just one more trip around a big eroding goals loop that results in kids who won’t eat anything without sugar in it.

Elsewhere in the dairy system, there are price supports for producers at one end of the supply chain. At the consumer end, their are price ceilings, meant to preserve the affordability of dairy products. It’s unclear what this bizarre system of incentives at cross-purposes really delivers, other than confusion.

The fundamental problem, I think, is that there’s no transparency: no immediate feedback from eating patterns to health outcomes, and little visibility of the convoluted system of rules and subsidies. That leaves marketers and politicians free to push whatever they want.

So, how to close the loop? Unfortunately, many eaters appear to be uninterested in closing the loop themselves by actively seeking unbiased information, or even actively resist information contrary to their current patterns as the product of some kind of conspiracy. That leaves only natural selection to close the loop. Not wanting to experience that personally, I implemented my own negative feedback loop. I bought a cholesterol meter and modified my diet until I routinely tested OK. Sadly, that meant no more dairy.

Election Reflection

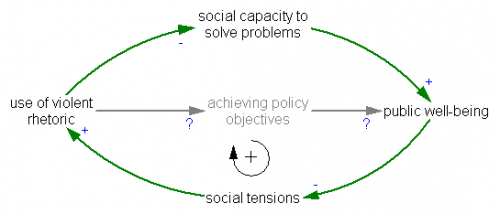
Jay Forrester’s 1971 Counter Intuitive Behavior of Social Systems sums up this election pretty well for me.

… social systems are inherently insensitive to most policy changes that people choose in an effort to alter the behavior of systems. In fact, social systems draw attention to the very points at which an attempt to intervene will fail. Human intuition develops from exposure to simple systems. In simple systems, the cause of a trouble is close in both time and space to symptoms of the trouble. If one touches a hot stove, the burn occurs here and now; the cause is obvious. However, in complex dynamic systems, causes are often far removed in both time and space from the symptoms. True causes may lie far back in time and arise from an entirely different part of the system from when and where the symptoms occur. However, the complex system can mislead in devious ways by presenting an apparent cause that meets the expectations derived from simple systems. A person will observe what appear to be causes that lie close to the symptoms in both time and space—shortly before in time and close to the symptoms. However, the apparent causes are usually coincident occurrences that, like the trouble symptom itself, are being produced by the feedback-loop dynamics of a larger system.

Translation: economy collapses under a Republican administration. Democrats fail to fix it, partly for lack of knowledge of correct action but primarily because it’s unfixable on a two-year time scale. Voters who elected the Dems by a large margin forget the origins of the problem, become dissatisfied and throw the bums out, but replace them with more clueless bums.

… social systems seem to have a few sensitive influence points through which behavior can be changed. These high-influence points are not where most people expect. Furthermore, when a high-influence policy is identified, the chances are great that a person guided by intuition and judgment will alter the system in the wrong direction.

Translation: everyone suddenly becomes a deficit hawk at the worst possible time, even though they don’t know whether Obama is a Keynesian.

The root of the problem:

Mental models are fuzzy, incomplete, and imprecisely stated. Furthermore, within a single individual, mental models change with time, even during the flow of a single conversation. The human mind assembles a few relationships to fit the context of a discussion. As debate shifts, so do the mental models. Even when only a single topic is being discussed, each participant in a conversation employs a different mental model to interpret the subject. Fundamental assumptions differ but are never brought into the open. Goals are different but left unstated.

It is little wonder that compromise takes so long. And even when consensus is reached, the underlying assumptions may be fallacies that lead to laws and programs that fail.

Still,

… there is hope. It is now possible to gain a better understanding of dynamic behavior in social systems. Progress will be slow. There are many cross-currents in the social sciences which will cause confusion and delay. … If we proceed expeditiously but thoughtfully, there is a basis for optimism.