Encouraging Moderation

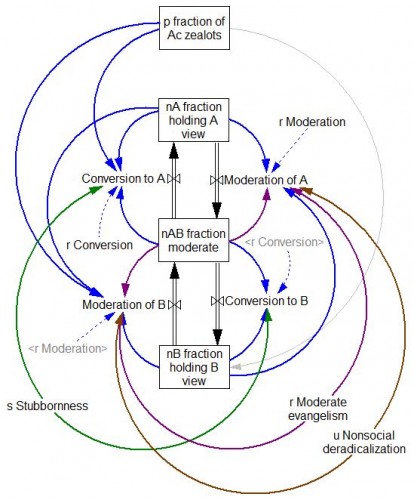
An interesting paper on Arxiv caught my eye the other day. It uses a simple model of a bipolar debate to explore policies that encourage moderation.

Some of the most pivotal moments in intellectual history occur when a new ideology sweeps through a society, supplanting an established system of beliefs in a rapid revolution of thought. Yet in many cases the new ideology is as extreme as the old. Why is it then that moderate positions so rarely prevail? Here, in the context of a simple model of opinion spreading, we test seven plausible strategies for deradicalizing a society and find that only one of them significantly expands the moderate subpopulation without risking its extinction in the process.

This is a very simple and stylized model, but in the best tradition of model-based theorizing, it yields provocative counter-intuitive results and raises lots of interesting questions. Technology Review’s Arxiv Blog has a nice qualitative take on the work.

See also: Dynamics of Scientific Revolutions, Bifurcations & Filter Bubbles

The model runs in discrete time, but I’ve added implicit rate constants for dimensional consistency in continuous time.

commitment2.mdl & commitment2.vpm

These should be runnable with any Vensim version.

If you add the asymmetric generalizations in the paper’s Supplemental Material, add your name to the model diagram, forward a copy back to me, and I’ll post the update.

Vensim + data with ODBC

I haven’t had much time to write lately – too busy writing Vensim code, working on En-ROADS, and modeling the STEM workforce.

So, in the meantime, here’s a nice tutorial on the use of ODBC database links with Vensim DSS, from Mohammad Jalali:

This can be a powerful way to ingest a lot of data from diverse sources, and to share and archive simulations.

Big data is always a double-edged sword in consulting projects. Without it, you don’t know much. But with it, your time is consumed with discovering all the flaws of the data, which remain because most likely no one else ever looked at it seriously from a strategic/dynamic perspective before. It’s typically transactionally correct, because people verify that they get their orders and paychecks. But at an aggregate level it’s often rife with categorization mismatches across organizational boundaries and other pathologies.

Social network valuation with logistic models

This is a logistic growth model for Facebook’s user base, with a very simple financial projection attached. It’s inspired by:

Quis pendit ipsa pretia: facebook valuation and diagnostic of a bubble based on nonlinear demographic dynamics

Peter Cauwels, Didier Sornette

We present a novel methodology to determine the fundamental value of firms in the social-networking sector based on two ingredients: (i) revenues and profits are inherently linked to its user basis through a direct channel that has no equivalent in other sectors; (ii) the growth of the number of users can be calibrated with standard logistic growth models and allows for reliable extrapolations of the size of the business at long time horizons. We illustrate the methodology with a detailed analysis of facebook, one of the biggest of the social-media giants. There is a clear signature of a change of regime that occurred in 2010 on the growth of the number of users, from a pure exponential behavior (a paradigm for unlimited growth) to a logistic function with asymptotic plateau (a paradigm for growth in competition). We consider three different scenarios, a base case, a high growth and an extreme growth scenario. Using a discount factor of 5%, a profit margin of 29% and 3.5 USD of revenues per user per year yields a value of facebook of 15.3 billion USD in the base case scenario, 20.2 billion USD in the high growth scenario and 32.9 billion USD in the extreme growth scenario. According to our methodology, this would imply that facebook would need to increase its profit per user before the IPO by a factor of 3 to 6 in the base case scenario, 2.5 to 5 in the high growth scenario and 1.5 to 3 in the extreme growth scenario in order to meet the current, widespread, high expectations. …

(via the arXiv blog)

This is not an exact replication of the model (though you can plug in the parameters from C&S’ paper to replicate their results). I used slightly different estimation methods, a generalization of the logistic (for saturation exponent <> 1), and variable revenues and interest rates in the projections (also optional).

This is a good illustration of how calibration payoffs work. The payoff in this model is actually a policy payoff, because the weighted sum-squared-error is calculated explicitly in the model. That makes it possible to generate Monte Carlo samples and filter them by SSE, and also makes it easier to estimate the scale and variation in the standard error of user base reports.

The model is connected to input data in a spreadsheet. Most is drawn from the paper, but I updated users and revenues with the latest estimates I could find.

A command script replicates optimization runs that fit the model to data for various values of the user carrying capacity K.

Note that there are two views, one for users, and one for financial projections.

See my accompanying blog post for some reflections on the outcome.

This model requires Vensim DSS, Pro, or the Model Reader. facebook 3.vpm or facebook3.zip (The .zip is probably easier if you have DSS or Pro and want to work with the supplementary control files.)

Update: I’ve added another set of models for Groupon: groupon 1.vpmgroupon 2.vpm and groupon.zip groupon3.zip

See my latest blog post for details.


Forest Cover Tipping Points

This is a model of forest stability and transitions, inspired by:

Global Resilience of Tropical Forest and Savanna to Critical Transitions

Marina Hirota, Milena Holmgren, Egbert H. Van Nes, Marten Scheffer

It has been suggested that tropical forest and savanna could represent alternative stable states, implying critical transitions at tipping points in response to altered climate or other drivers. So far, evidence for this idea has remained elusive, and integrated climate models assume smooth vegetation responses. We analyzed data on the distribution of tree cover in Africa, Australia, and South America to reveal strong evidence for the existence of three distinct attractors: forest, savanna, and a treeless state. Empirical reconstruction of the basins of attraction indicates that the resilience of the states varies in a universal way with precipitation. These results allow the identification of regions where forest or savanna may most easily tip into an alternative state, and they pave the way to a new generation of coupled climate models.

The paper is worth a read. It doesn’t present an explicit simulation model, but it does describe the concept nicely. I built the following toy model as a loose interpretation of the dynamics.

Some things to try:

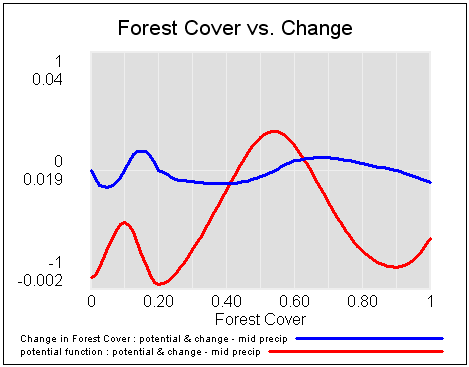
Use a Synthesim override to replace Forest Cover with a ramp from 0 to 1 to see potentials and vector fields (rates of change), then vary the precipitation index to see how the stability of the forest, savanna and treeless states changes:


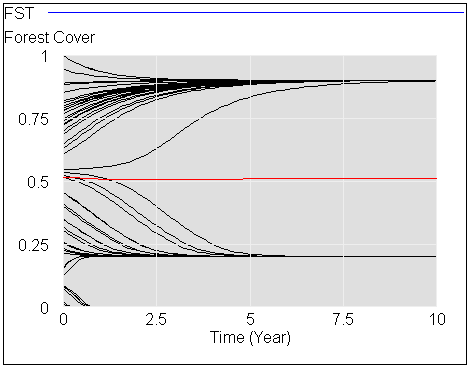
Start the system at different levels of forest cover (varying init forest cover), with default precipitation, to see the three stable attractors at zero trees, savanna (20% tree cover) and forest (90% tree cover):

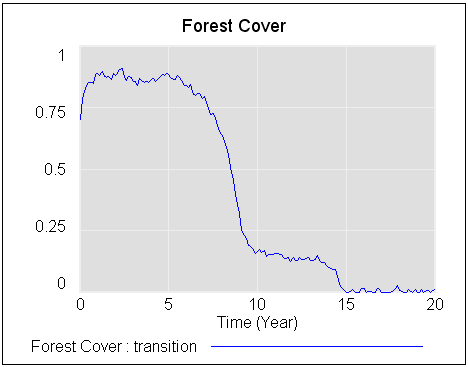
Start with a stable forest, and a bit of noise (noise sd = .2 to .3), then gradually reduce precipitation (override the precipitation index with a ramp from 1 to 0) to see abrupt transitions in state:

There’s a more detailed discussion on my blog.

forest savanna treeless 1f.mdl (requires an advanced version of Vensim, or the free Model Reader)

forest savanna treeless 1f.vpm (ditto; includes a sensitivity file for varying the initial forest cover)

Stochastic Processes

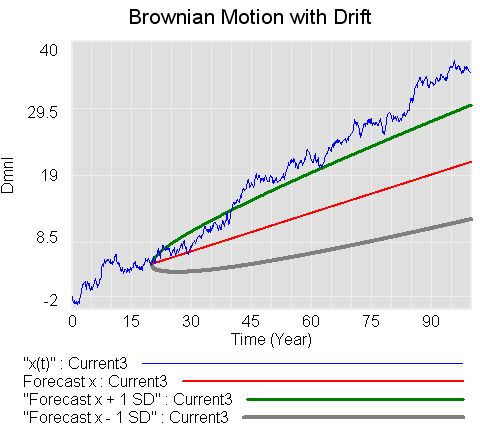
This model replicates a number of the stochastic processes from Dixit & Pindyck’s Investment Under Uncertainty. It includes Brownian motion (Wiener process), geometric Brownian motion, mean-reverting and jump processes, plus forecast confidence bounds for some variations.

Units balance, but after updating this model I’ve decided that there may be a conceptual issue, related to the interpretation of units in parameters of the Brownian process variants. This arises due to the fact that the parameter sigma represents the standard deviation at unit time, and that some of the derivations gloss over units associated with substitutions of dz=epsilon*SQRT(dt). I don’t think these are of practical importance, but will revisit the question in the future. This is what happens when you let economists get hold of engineers’ math. 🙂

These structures would be handy if made into :MACRO:s for reuse.

stochastic processes 3.mdl (requires an advanced version of Vensim)

stochastic processes 3.vpm (published package; includes a sensitivity setup for varying NOISE SEED)

stochastic processes 3 PLE.mdl (Runs in PLE, omits only one equation of low importance)

Vensim Model Documentation Tool

Ignacio Martinez (U Chicago/Argonne, Vensim distributor, and all around nice guy) has developed a nifty tool that exploits Vensim’s open text file format and .dll to make very thorough, browsable model documentation.

It’s incredibly simple to use. Just unzip the archive, fire up the .exe, and point it at a model (.mdl format; it’ll also read some information out of an accompanying published .vpm, if there is one, but that’s not needed):

Continue reading “Vensim Model Documentation Tool”

Bifurcations from Strogatz’ Nonlinear Dynamics and Chaos

The following models are replicated from Steven Strogatz’ excellent text, Nonlinear Dynamics and Chaos.

These are just a few of the many models in the text. They illustrate bifurcations in one-dimensional systems (saddle node, transcritical, pitchfork) and one two-dimensional system (Hopf). The pitchfork bifurcation is closely related to the cusp catastrophe in the climate model recently posted.

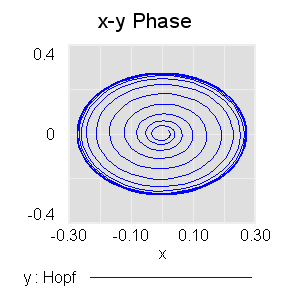
Spiral from a point near the unstable fixed point at the origin to a stable limit cycle after a Hopf bifurcation (mu=.075, r0 = .025)

These are in support of an upcoming post on bifurcations and tipping points, so I won’t say more at the moment. I encourage you to read the book. If you replicate more of the models in it, I’d love to have copies here.

These are systems in normal form and therefore dimensionless and lacking in physical interpretation, though they certainly crop up in many real-world systems.

3-1 saddle node bifurcation.mdl

3-2 transcritical bifurcation.mdl

3-4 pitchfork bifurcation.mdl

8.2 Hopf bifurcation.mdl

Update: A related generic model illustrating critical slowing down:

critical slowing.mdl

Climate Catastrophe

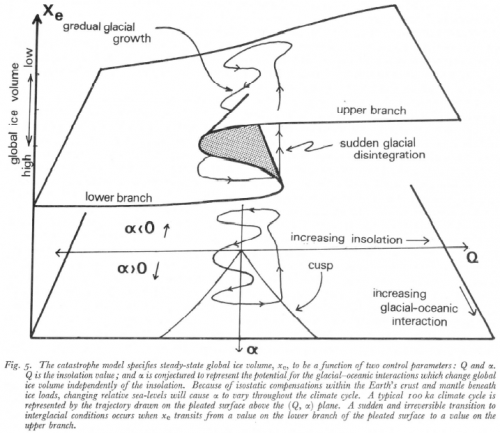
This is an interesting, simple model of global ice age dynamics, from:

“A Catastrophe Model of the Paleoclimate”, Douglas R MacAyeal, Journal of Glaciology, Vol 24 No 90, 1979

It illustrates a pitchfork bifurcation as a slice through a cusp catastrophe. It’s conceptually related to earlier models by Budyko and Weertmans that demonstrated hysteresis in temperature and ice sheet dynamics.

The model is used qualitatively in the paper. I’ve assigned units of measure and parameter values that reveal the behavior of the catastrophe, but there’s no guarantee that they are physically realistic.

The .vpm package includes several .cin (changes) files that reproduce interesting tests on the model. The model runs in PLE, but you may want to use the Model Reader to access the .cin files in SyntheSim.

Catastrophe.vpm


Gumowski-Mira Attractor

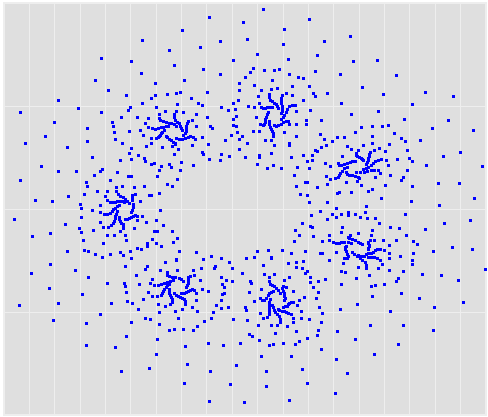
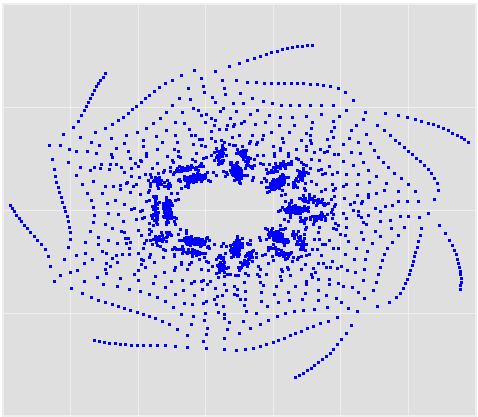
I became aware of this neat model via the Vensim forum. I have no idea what the physical basis is, but the diverse and beautiful output it generates is quite amazing.

Interestingly, if you only looked at time series of this sequence, you’d probably never notice it.

This runs in any version of Vensim. gumowski mira.mdl