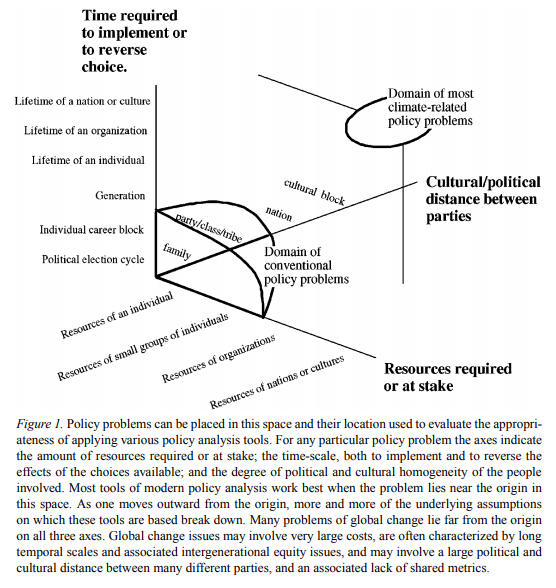
It’s all in this one picture, by M. Granger Morgan, Milind Kandlikar, James Risbey & Hadi Dowlatabadi:

Don't just do something, stand there! Reflections on the counterintuitive behavior of complex systems, seen through the eyes of System Dynamics, Systems Thinking and simulation.
If you’re interested in modeling the opioid epidemic, this New Yorker article is a must-read:
The Family That Built an Empire of Pain
The Sackler dynasty’s ruthless marketing of painkillers has generated billions of dollars—and millions of addicts.
Most systems thinkers are familiar with the parable of the blind men and the elephant.
Composer Kenji Bunch has set it to music:
There are two ways to go about building a model.
Ideally, both approaches converge to the same point.
Plan B is attractive, for several reasons. It helps you to explore a wide range of ideas. It gives a satisfying illusion of rapid progress. And, most importantly, it’s satisfying for stakeholders, who typically have a voracious appetite for detail and a limited appreciation of dynamics.
The trouble is, Plan B does not really exist. When you build a lot of structure quickly, the sacrifice you have to make is ignoring lots of potential interactions, consistency checks, and other relationships between components. You’re creating a large backlog of undiscovered rework, which the extensive SD literature on projects tells us is fatal. So, you’re really on Path C, which leads to disaster: a large, incomprehensible, low-quality model.

In addition, you rarely have as much time as you think you do. When your work gets cut short, only Path A gives you an end product that you can be proud of.
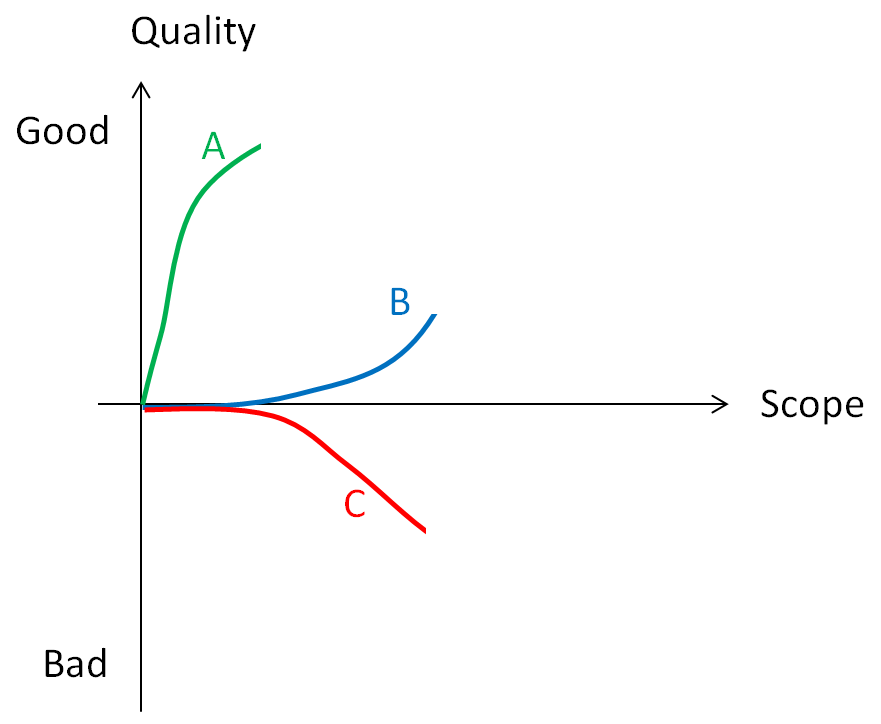
So, resist pressures to include every detail. Embrace elegant simplicity and rich feedback. Check your units regularly, test often, and “always be done” (as Jim Hines puts it). Your life will be easier, and you’ll solve more problems in the long run.
Related: How to critique a model (and build a model that withstands critique)
I’ve been working with pharma brand tracking data, used to calibrate a part of an integrated model of prescriptions in a disease class. Understanding docs’ perceptions of drugs is pretty important, because it’s the major driver of rx. Drug companies spend a lot of money collecting this data; vendors work hard to collect it by conducting quarterly interviews with doctors in a variety of specialties.
Unfortunately, most of the data is poorly targeted for dynamic modeling. It seems to be collected to track and guide ad messaging, but that leads to turbulence that prevents drawing any long term conclusions from the data. That’s likely to lead to reactive decision making. Here’s how to minimize strategic information content:
On the other hand, please don’t! A few consistent, well-quantified questions are pure gold if you want to untangle causality that plays out over more than a quarter.
As a few people nearly guessed, the left side is “things a linear system can do” and the right side is “(additional) things a nonlinear system can do.”
On the left:
On the right:
Bongard problems test visual pattern recognition, but there’s no reason to be strict about that. Here’s a slightly nontraditional Bongard problem:
The six on the left conform to a pattern or rule, and your task is to discover it. As an aid, the six boxes on the right do not conform to the same pattern. They might conform to a different pattern, or simply reflect the negation of the rule on the left. It’s possible that more than one rule discriminates between the sets, but the one that I have in mind is not strictly visual (that’s a hint).
The NY Times has a terrific obituary of economist Kenneth Arrow, who died yesterday at age 95. It’s a great read, from the discussion of the Impossibility Theorem and General Equilibrium to the personal anecdote at the end.
Paul Romer (of endogenous growth fame) has a new, scathing critique of macroeconomics.
For more than three decades, macroeconomics has gone backwards. The treatment of identification now is no more credible than in the early 1970s but escapes challenge because it is so much more opaque. Macroeconomic theorists dismiss mere facts by feigning an obtuse ignorance about such simple assertions as “tight monetary policy can cause a recession.” Their models attribute fluctuations in aggregate variables to imaginary causal forces that are not influenced by the action that any person takes. A parallel with string theory from physics hints at a general failure mode of science that is triggered when respect for highly regarded leaders evolves into a deference to authority that displaces objective fact from its position as the ultimate determinant of scientific truth.
Notice the Kuhnian finish: “a deference to authority that displaces objective fact from its position as the ultimate determinant of scientific truth.” This is one of the key features of Sterman & Wittenberg’s model of Path Dependence, Competition, and Succession in the Dynamics of Scientific Revolution:
The focal point of the model is a construct called “confidence.” Confidence captures the basic beliefs of practitioners regarding the epistemological status of their paradigm—is it seen as a provisional model or revealed truth? Encompassing logical, cultural, and emotional factors, confidence influences how anomalies are perceived, how practitioners allocate research effort to different activities (puzzle solving versus anomaly resolution, for example), and recruitment to and defection from the paradigm. …. Confidence rises when puzzle-solving progress is high and when anomalies are low. The impact of anomalies and progress is mediated by the level of confidence itself. Extreme levels of confidence hinder rapid changes in confidence because practitioners, utterly certain of the truth, dismiss any evidence contrary to their beliefs. ….
The external factors affecting confidence encompass the way in which practitioners in one paradigm view the accomplishments and claims of other paradigms against which they may be competing. We distinguish between the dominant paradigm, defined as the school of thought that has set the norms of inquiry and commands the allegiance of the most practitioners, and alternative paradigms, the upstart contenders. The confidence of practitioners in a new paradigm tends to increase if its anomalies are less than those of the dominant paradigm, or if it has greater explanatory power, as measured by cumulative solved puzzles. Confidence tends to decrease if the dominant paradigm has fewer anomalies or more solved puzzles. Practitioners in alternative paradigms assess their paradigms against one another as well as against the dominant paradigm. Confidence in an alternative paradigm tends to decrease (increase) if it has more (fewer) anomalies or fewer (more) solved puzzles than the most successful of its competitors.
In spite of its serious content, Romer’s paper is really quite fun, particularly if you get a little Schadenfreude from watching Real Business Cycles and Dynamic Stochastic General Equilibrium take a beating:
To allow for the possibility that monetary policy could matter, empirical DSGE models put sticky-price lipstick on this RBC pig.
But let me not indulge too much in hubris. Every field is subject to the same dynamics, and could benefit from Romer’s closing advice.
A norm that places an authority above criticism helps people cooperate as members of a belief field that pursues political, moral, or religious objectives. As Jonathan Haidt (2012) observes, this type of norm had survival value because it helped members of one group mount a coordinated defense when they were attacked by another group. It is supported by two innate moral senses, one that encourages us to defer to authority, another which compels self-sacrifice to defend the purity of the sacred.
Science, and all the other research fields spawned by the enlightenment, survive by “turning the dial to zero” on these innate moral senses. Members cultivate the conviction that nothing is sacred and that authority should always be challenged. In this sense, Voltaire is more important to the intellectual foundation of the research fields of the enlightenment than Descartes or Newton.
Trump pledges 4%/yr economic growth (but says his economists don’t want him to). His economists are right – political tinkering with growth is a fantasy:

Source: Maddison
The growth rate of real per capita GDP in the US, and all leading industrial nations, has been nearly constant since the industrial revolution, at about 2% per year. Over that time, marginal tax rates, infrastructure investments and a host of other policies have varied dramatically, without causing the slightest blip.
On the other hand, there are ways you can screw up, like having a war or revolution, or failing to provide rule of law and functioning markets. The key is to preserve the conditions that allow the engine of growth – innovation – to function. Trump seems utterly clueless about innovation. His view of the economy is zero-sum: that value is something you extract from your suppliers and customers, not something you create. That view, plus an affinity for authoritarianism and conflict and neglect of the Constitution, bodes ill for a Trump economy.