Facebook Reloaded 2013

Facebook has climbed out of its 2012 doldrums to a market cap of $115 billion today. So, I’ve updated my user tracking and valuation model, just for kicks.

As in my last update, user growth continues to modestly exceed the original estimates. The user “carrying capacity” now is about 1.35 billion users, vs. .95 originally (K950 on graph) and 1.07 in 2012 – within the range of scenarios I originally ran, but well above the “best guess”. My guess is that the model will continue to underpredict for a while, because this is an inevitable pitfall of using a single diffusion process to represent what is surely the aggregate of several processes – stationary vs. mobile, different regions and demographics, etc. Of course, in the long run, users could also go down, which the basic logistic model can’t represent.

You can see what’s going on if you plot growth against users -the right tail doesn’t go to 0 as fast as the logistic assumes:

User growth probably isn’t a huge component of valuation, because these are modest differences on a percentage basis. Marginal users may be less valuable as well.

With revenue per user at a constant $7/user/year, and 30% margins, and the current best-guess model, FB is now worth $35 billion. What does it take to get to the ballpark of current market capitalization? Here’s one way:

  • The carrying capacity ceiling for users continues to grow to 2 billion, and
  • revenue per user rises to $25/user/year

This preserves some optimistic base case assumptions,

  • The risk-free interest rate takes 5 more years to rise substantially above 0 to a (still low) long term rate of 3%
  • Margins stay at 30% as in 2009-2011 (vs. 18% y.t.d.)

Think it’ll happen?

facebook 3 update 2.vpm

Summary for Suckers

The NIPCC critique is, ironically, a compelling argument in favor of the IPCC assessment. Why? Well, science is about evaluation of competing hypotheses. The NIPCC report collects a bunch of alternatives to mainstream climate science in one place, where it’s easy to see how pathetic they are. If this is the best climate skeptics can muster, their science must be exceedingly weak.

The NIPCC (Nongovernmental International Panel on Climate Change, a.k.a. Not IPCC) is the Heartland Institute’s rebuttal of the IPCC assessments. Apparently the latest NIPCC report has been mailed to zillions of teachers. As a homeschooling dad, I’m disappointed that I didn’t get mine. Well, not really.

It would probably take more pages to debunk the NIPCC report than it occupies, but others are chipping away at it. Some aspects, like temperature cherry-picking, are like shooting fish in a barrel.

The SPM, and presumably the entire report that it summarizes, seems to labor under the misapprehension that the IPCC is itself a body that conducts science. In fact, the IPCC assessments are basically a giant literature review. So, when the Heartland panel writes,

In contradiction of the scientific method, the IPCC assumes its implicit hypothesis is correct and that its only duty is to collect evidence and make plausible arguments in the hypothesis’s favor.

we must remember that “the IPCC” is shorthand for a vast conspiracy of scientists, coordinated by an invisible hand.

The report organizes the IPPC argument into 3 categories: “Global Climate Model (GCM) projections,” “postulates,” and “circumstantial evidence.” This is a fairly ridiculous caricature of the actual body of work. Most of what is dismissed as postulates could better be described as, “things we’re too lazy to explore properly,” for example. But my eye strays straight to the report’s misconceptions about modeling.

First, the NIPCC seems to have missed the fact that GCMs are not the only models in use. There are EMICS (models of intermediate complexity) and low-order energy balance models as well.

The NIPCC has taken George Box’s “all models are wrong, some are useful” and run with it:

… Global climate models produce meaningful results only if we assume we already know perfectly how the global climate works, and most climate scientists say we do not (Bray and von Storch, 2010).

How are we to read this … all models are useless, unless they’re perfect? Of course, no models are perfect, therefore all models are useless. Now that’s science!

NIPCC trots out a von Neumann quote that’s almost as tired as Box:

with four parameters I can fit an elephant, and with five I can make him wiggle his trunk

In models with lots of reality checks available (i.e. laws of physics), it just isn’t that easy. And the earth is a very big elephant, which means that there’s a rather vast array of data to be fit.

The NIPCC seems to be aware of only a few temperature series, but the AR5 report devotes 200 pages (Chapter 9) to model evaluation, with results against a wide variety of spatial and temporal distributions of physical quantities. Models are obviously far from perfect, but a lot of the results look good, in ways that exceed the wildest dreams of social system modelers.

NIPCC doesn’t seem to understand how this whole “fit” thing works.

Model calibration is faulty as it assumes all temperature rise since the start of the industrial revolution has resulted from human CO2 emissions.

This is blatantly false, not only because it contradicts the actual practice of attribution, but because there is no such parameter as “fraction of temp rise due to anthro CO2.” One can’t assume the answer to the attribution question without passing through a lot of intermediate checks, like conforming to physics and data other than global temperature. In complex models, where the contribution of any individual parameter to the outcome is likely to be unknown to the modeler, and the model is too big to calibrate by brute force, the vast majority of parameters must be established bottom up, from physics or submodels, which makes it extremely difficult for the modeler to impose preconceptions on the complete model.

Similarly,

IPCC models stress the importance of positive feedback from increasing water vapor and thereby project warming of ~3-6°C, whereas empirical data indicate an order of magnitude less warming of ~0.3-1.0°C.

Data by itself doesn’t “indicate” anything. Data only speaks insofar as it refutes (or fails to refute) a model. So where is the NIPCC model that fits available data and yields very low climate sensitivity?

The bottom line is that, if it were really true that models have little predictive power and admit many alternative calibrations (a la the elephant), it should be easy for skeptics to show model runs that fit the data as well as mainstream results, with assumptions that are consistent with low climate sensitivity. They wouldn’t necessarily need a GCM and a supercomputer; modest EBMs or EMICs should suffice. This they have utterly failed to demonstrate.
 

What's your favorite cognitive bias?

Business Insider has a nifty compilation of cognitive biases, extracted from wikipedia’s huge list.

It would be cool to identify the ones that involve dynamics, and identify a small conceptual model illustrating each one.

In SD, we often call these misperceptions of feedback, though one might also include failures to mentally simulate accumulation, which doesn’t require feedback. Some samples that jump to mind:

Not only the tragedy of the commons: misperceptions of feedback and policies for sustainable development

Drunker than intended: Misperceptions and information treatments

Capability traps and self-confirming attribution errors in the dynamics of process improvement

Modeling managerial behavior: Misperceptions of feedback in a dynamic decision making experiment

Explaining capacity overshoot and price war: misperceptions of feedback in competitive growth markets

Bathtub dynamics: initial results of a systems thinking inventory

What’s your favorite foible?

Is happiness bimodal? Why?

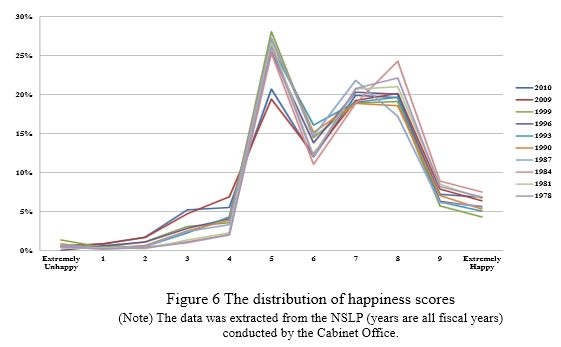
At the Balaton meeting, I picked up a report on happiness in Japan, Measuring National Well-Being – Proposed Indicators. There’s a lot of interesting material in it, but a figure on page 14 stopped me in my tracks:

The distribution of happiness scores is rather strongly bimodal, and has been stable that way for 30+ years.

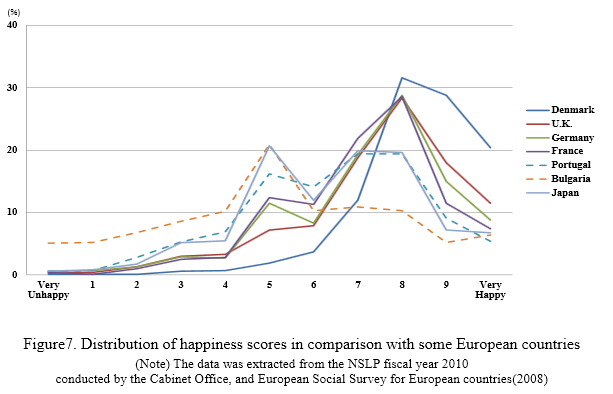
There might be an obvious explanation: heterogeneity – perhaps women are happy, and men aren’t, or the reverse, or maybe a lot of people just like to answer “5”. But the same thing appears in some European countries:

Denmark is obscenely happy (time to look for an apartment in Copenhagen) but several other countries display the same dual peaks as Japan. I wouldn’t expect the same cultural dynamics, so what’s going on?

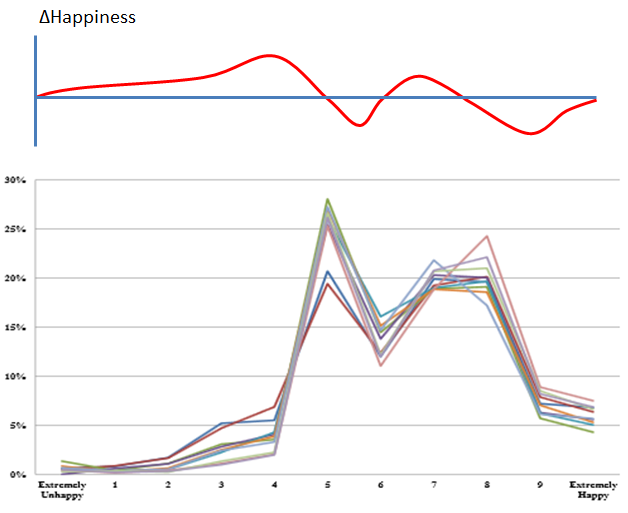
A tantalizing possibility is that this is the product of a dynamic system. But if so, it’s 1D representation would have to look something like,

That’s really rather weird, so perhaps it’s just an artifact (after all, bimodality doesn’t appear everywhere). But since happiness is largely a social phenomenon, it’s certainly plausible that the intersection of several feedbacks yields this behavior.

I find it rather remarkable that no one has noted this – at least, google scholar fails me on the notion of bimodal happiness or subjective well being. A similar phenomenon appears in text analysis of twitter and other media.

Any theories?

Environmental Homeostasis

Replicated from

The Emergence of Environmental Homeostasis in Complex Ecosystems

The Earth, with its core-driven magnetic field, convective mantle, mobile lid tectonics, oceans of liquid water, dynamic climate and abundant life is arguably the most complex system in the known universe. This system has exhibited stability in the sense of, bar a number of notable exceptions, surface temperature remaining within the bounds required for liquid water and so a significant biosphere. Explanations for this range from anthropic principles in which the Earth was essentially lucky, to homeostatic Gaia in which the abiotic and biotic components of the Earth system self-organise into homeostatic states that are robust to a wide range of external perturbations. Here we present results from a conceptual model that demonstrates the emergence of homeostasis as a consequence of the feedback loop operating between life and its environment. Formulating the model in terms of Gaussian processes allows the development of novel computational methods in order to provide solutions. We find that the stability of this system will typically increase then remain constant with an increase in biological diversity and that the number of attractors within the phase space exponentially increases with the number of environmental variables while the probability of the system being in an attractor that lies within prescribed boundaries decreases approximately linearly. We argue that the cybernetic concept of rein control provides insights into how this model system, and potentially any system that is comprised of biological to environmental feedback loops, self-organises into homeostatic states.

See my related blog post for details.

Continue reading “Environmental Homeostasis”

Random rein control

An interesting article in PLOS one explores the consequences of a system of random feedbacks:

The Emergence of Environmental Homeostasis in Complex Ecosystems

The Earth, with its core-driven magnetic field, convective mantle, mobile lid tectonics, oceans of liquid water, dynamic climate and abundant life is arguably the most complex system in the known universe. This system has exhibited stability in the sense of, bar a number of notable exceptions, surface temperature remaining within the bounds required for liquid water and so a significant biosphere. Explanations for this range from anthropic principles in which the Earth was essentially lucky, to homeostatic Gaia in which the abiotic and biotic components of the Earth system self-organise into homeostatic states that are robust to a wide range of external perturbations. Here we present results from a conceptual model that demonstrates the emergence of homeostasis as a consequence of the feedback loop operating between life and its environment. Formulating the model in terms of Gaussian processes allows the development of novel computational methods in order to provide solutions. We find that the stability of this system will typically increase then remain constant with an increase in biological diversity and that the number of attractors within the phase space exponentially increases with the number of environmental variables while the probability of the system being in an attractor that lies within prescribed boundaries decreases approximately linearly. We argue that the cybernetic concept of rein control provides insights into how this model system, and potentially any system that is comprised of biological to environmental feedback loops, self-organises into homeostatic states.

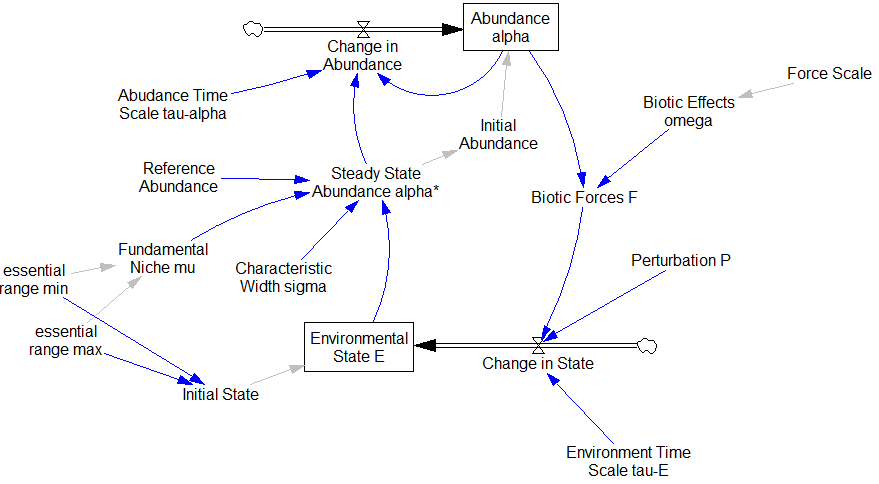
To get a handle on how this works, I replicated the model (see my library).

The basic mechanism of the model is rein control, in which multiple unidirectional forces on a system act together to yield bidirectional feedback control. By analogy, the reins on a horse can only pull in one direction, but with a pair of reins, it’s possible to turn both left and right.

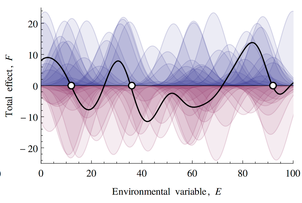
In the model, there’s a large random array of reins, consisting of biotic feedbacks that occur near a particular system state. In the simple one-dimensional case, when you add a bunch of these up, you get a 1D vector field that looks like this:

If this looks familiar, there’s a reason. What’s happening along the E dimension is a lot like what happens along the time dimension in pink noise: at any given point, the sum of a lot of random impulses yield a wiggly net response, with a characteristic scale yielded by the time constant (pink noise) or niche width of biotic components (rein control).
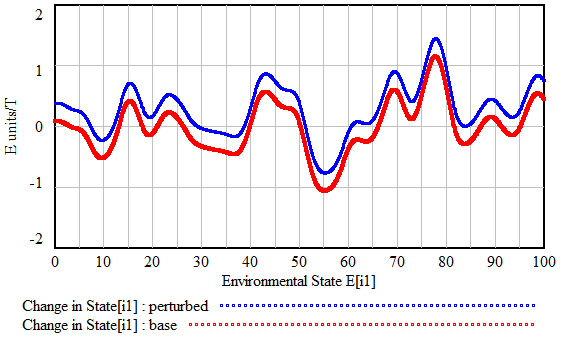
What this yields is an alternating series of unstable (tipping) points and stable equilibria. When the system is perturbed by some external force, the disturbance shifts the aggregate response, as below. Generally, a few stable points may disappear, but the large features of the landscape are preserved, so the system resists the disturbance.

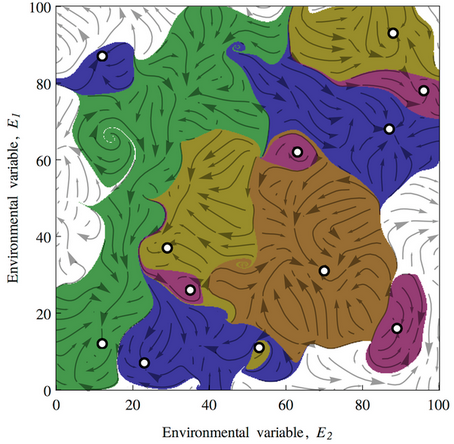
With a higher-dimensional environmental state, this creates convoluted basins of attraction:

This leads to a variety of conclusions about ecological stability, for which I encourage you to have a look at the full paper. It’s interesting to ponder the applicability and implications of this conceptual model for social systems.

GDP's … something?

While the government is shut down, it seems like a good time for a rousing round of Alan Atkisson‘s GDP Song:

The shutdown means GDP measurements are on ice, which is not all bad, though we can expect a 15 basis point drag on GDP per week to include some real harm.

Shutting down our measurement systems strikes me as alarmingly close to turning off the instruments on the flight deck of a plane, due to a route dispute between the pilot and copilot.

Equity, equality and positive feedback

I’m reflecting on Deborah Rogers‘ presentation on equity/equality at the Balaton Group meeting, concerning the apparent evolutionary drivers of the transition from a long human prehistory of egalitarian societies to today’s extreme inequity. A key point of terminology is that equity and equality are not quite the same thing – equality implies similar wealth or resource access, while equity implies something more like Rawlsian justice. But you can’t have one without the other, because inequality leads the haves to tilt the tables of justice against the have-nots.

This might not be a deliberate choice to exploit the masses. It could occur as an evolutionary consequence of the inability to predict the outcome of dynamically complex decisions.

I once described a complex theory of the emergence of inequality to Donella Meadows. I no longer remember the details, but perhaps it was the ancestor of this. Her answer was characteristically simple and insightful, to the effect of, “it doesn’t matter what the specific dynamics are, because the rich control the decisions, so the question boils down to how much inequ(al)ity the elite will tolerate.”

Evidence indicates that high inequality is bad for growth, so a possible irony is that policies that transfer wealth to the wealthy in the short run are bad for them in the long run, because growth eventually dominates allocation, even for the richest.

So, for me, the key question for society is, how much positive feedback should a civilization build into its social organization?

A bit of positive feedback can be helpful, if it creates a gradient that guides individuals who aren’t making the best decisions to imitate the habits of their more successful peers.

However, this probably requires a relatively low level of inequality. As soon as there’s stronger positive feedback, it’s likely that dysfunctional feedbacks take hold, as the wealthiest institutions use their market power to block innovation and good governance in service of maintaining their exalted positions.

I think the evidence that this occurs today is probably fairly simple. Look at the distribution of IQs or any other metric that might be an input to productivity in the economy. It’ll be relatively Normal (Gaussian). But the distributions of wealth and power are heavy tailed (Zipf or Double Laplace). That’s a pretty clear indication that there’s a lot of reinforcing feedback at work.

Fixed and Variable Limits

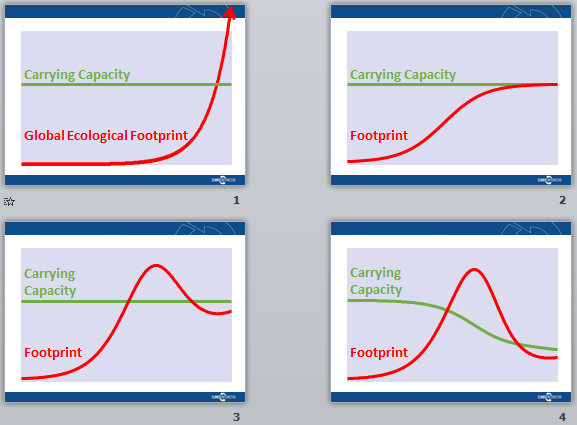
After I wrote my last post, it occurred to me that perhaps I should cut Ellis some slack. I still don’t think most people who ponder limits think of them as fixed. But, as a kind of shorthand, we sometimes talk about them that way. Consider my slides from the latest SD conference, in which I reflected on World Dynamics,

It would be easy to get the wrong impression here.

Of course, I was talking about World Dynamics, which doesn’t have an explicit technology stock – Forrester considered technology to be part of the capital accumulation process. That glosses over an important point, by fixing the ratios of economic activity to resource consumption and pollution. World3 shares this limitation, except in some specific technology experiments.

So, it’s really no wonder that, in 1973, it was hard to talk to economists, who were operating with exogenous technical progress (the Solow residual) and substitution along continuous production functions in mind.

Unlimited or exogenous technology doesn’t really make any more sense than no technology, so who’s right?

As I said last time, the answer boils down to whether technology proceeds faster than growth or not. That in turn depends on what you mean by “technology”. Narrowly, there’s fairly abundant evidence that the intensity (per capita or GDP) of use of a variety of materials is going down more slowly than growth. As a result, resource consumption (fossil fuels, metals, phosphorus, gravel, etc.) and persistent pollution (CO2, for example) are increasing steadily. By these metrics, sustainability requires a reversal in growth/tech trend magnitudes.

But taking a broad view of technology, including product scope expansions and lifestyle, what does that mean? The consequences of these material trends don’t matter if we can upload ourselves into computers or escape to space fast enough. Space doesn’t look very exponential yet, and I haven’t really seen credible singularity metrics. This is really the problem with the Marchetti paper that Ellis links, describing a global carrying capacity of 1 trillion humans, with more room for nature than today, living in floating cities. The question we face is not, can we imagine some future global equilibrium with spectacular performance, but, can we get there from here?

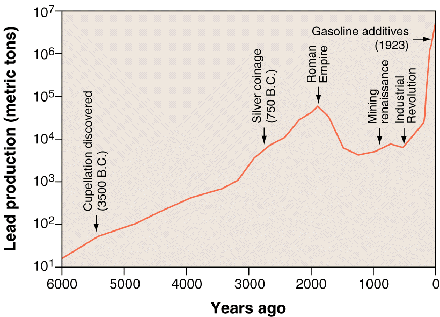
Nriagu, Tales Told in Lead, Science

For the Romans, there was undoubtedly a more technologically advanced  future state (modern Europe), but they failed to realize it, because social and environmental feedbacks bit first. So, while technology was important then as now, the possibility of a high tech future state does not guarantee its achievement.

For Ellis, I think this means that he has to specify much more clearly what he means by future technology and adaptive capacity. Will we geoengineer our way out of climate constraints, for example? For proponents of limits, I think we need to be clearer in our communication about the technical aspects of limits.

For all sides of the debate, models need to improve. Many aspects of technology remain inadequately formulated, and therefore many mysteries remain. Why does the diminishing adoption time for new technologies not translate to increasing GDP growth? What do technical trends look like when measured by welfare indices rather than GDP? To what extent does social IT change the game, vs. serving as the icing on a classical material cake?