Timothy Clancy, Saeed P. Langarudi and Raafat Zaini have an interesting new commentary in the SDR.
Never the strongest: reconciling the four schools of thought in system dynamics in the debate on quality
…
With the passing of Jay Forrester, the field of system dynamics exists at a similar crossroads. Debates of implicit, if not explicit, inheritance and future direction are already breaking out among competing generals. Who owns Forrester’s legacy? Will we proceed down the reference mode of the Macedonian and Mughal Empires—or will we instead seek an alternative reference mode of Alexandria: integration, reconciliation, and mutually recognized coexistence of different schools within the broader field of system dynamics?
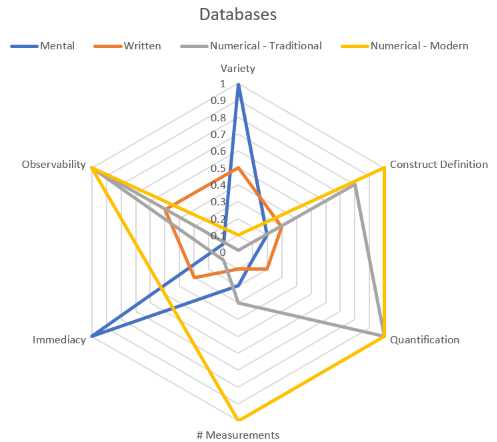
We suggest the latter path—and that begins by recognizing at least four, if not more, distinct schools of thought on how to approach system dynamics and the study of complex systems. We believe these schools arise from differing mental models in the field and the consequences that arise in practice from these differences.
I haven’t really absorbed it yet, so I’ll refrain from direct comment, but it did spur me to finish off a draft of some similar thoughts on these questions.
I personally lean very much toward the hard science, data-driven side of the field: what the authors call the Empirical school of thought. But as a policy, I lean toward a big tent view of the field that includes work with low model content (which I don’t equate with low quality).
I think the central tension in the debate has already been posed by JWF and others long ago – all the way back to Industrial Dynamics really. In Some Basic Concepts in System Dynamics (2009), Forrester summarized,
The basic feedback loop in Figure 4 is too simple to represent real-world situations. But simple loops have more serious shortcomings—they are misleading and teach the wrong lessons. Most of our intuitive learning comes from very simple systems. The truths learned from simple systems are often completely opposite from the behavior of more complex systems. A person understands filling a water glass, as in Figure 3. But, if we go to a system that is only five times as complicated, as in Figure 5, intuition fails. A person cannot look at Figure 5 and anticipate the behavior of the pictured system.
Figure 5 from World Dynamics is five times more complicated than Figure 4 in the sense that it has five stocks—the rectangles in the figure. The figure shows how rapidly apparent complexity increases as more system stocks are added.
Mathematicians would describe Figure 5 as a fifth-order, nonlinear, dynamic system. No one can predict the behavior by studying the diagram or its underlying equations. Only by using computer simulation can the implied behavior be revealed.
I think the message is pretty clear here. To solve complex problems, you must formally simulate the system because mental simulations are treacherous. I’d go even one step further, and argue that it’s not sufficient to simulate the system once, figure out where the leverage point is, implement the solution, and toss out the model when you’re done. The simulation needs to become an ongoing part of the loop for model predictive control.
If that’s the ideal, why settle for anything less? I think there are a number of possible answers.
- Even in a perfect world where it’s easy to construct the model-in-the-loop, you need buy-in from the participants in the system to implement the model, and that requires a skillset that’s quite distinct.
- While it’s true that no one can intuit the behavior of a 10th order system, there might be a lot of value in managing low-order components of the system that are amenable to mental simulation or simple decision rules. There might be two reasons for this:
- The complex system is dominated by a few key parameters (as in sloppy systems).
- Risking global suboptimization by improving locally is better than optimizing nothing (though this might be a matter of luck).
- Often no single stakeholder in the system has the resources or authority to implement needed changes. But exposing the connectivity of the system, even if you can’t predict exactly how it works, is sometimes enough to catalyze creation of higher-level structures that enable change in the future.
- Not everyone is, or wants to be, a modeler. Moreover some participants in the system may reject models, data, and pretty much everything else since the Enlightenment, but you still have to include them.
- The non-modelers, as participants in the system, hold key knowledge that the modelers need.
- A qualitative map of a system is a good start towards an eventual quantitative model.
- Not every problem is big enough to model.
I’m sure you can probably think of more. I think these are good reasons to embrace non-model-based work on systems, as long as one refrains from making strong predictions about behavior from incomplete descriptions of behavior. Fortunately that leaves a lot of interesting things to think about.
I think the opposite perspective, that nothing is worth doing without a model and data, requires some counterexamples. Are there instances in which a group mapping exercise, playing a dynamic game, or engaging in cross-functional dialog led to reduced performance? I’m not aware of good examples of this, and certainly not of good diagnoses of the outcome. Attribution in complex systems is notoriously difficult. I think what this suggests is that we need stronger links to the evaluation research community, because we don’t really know what works and what doesn’t. We already have some strength in this area from the dynamic decision making experiment thread of SD, but … physician heal thyself.
There is one thing that troubles me though, just beyond the boundaries of our field. It’s climate policy (and related global issues). Most climate policy advocates are in some sense systems thinkers. Many build nice diagrams or use other systemic tools. If you don’t care about systems, it’s hard to see why you’d care about climate to begin with.
Yet … it seems that a substantial fraction of people who are pro-climate policy favor policies that are counterproductive or insufficient. They like low-carbon fuel standards that are unstable, inefficient, and can even increase emissions. They like standards that allocate more property rights to bigger polluters, or simply make it harder to change. They like to impose constraints on new fossil supply that work exactly like OPEC to increase prices and profits for incumbent producers. They subsidize EVs and solar, increasing the incentive to consume energy and congest roads, with benefits accruing to the rich who can afford the capital outlay.
What this means is that my reason #2, “Risking global suboptimization by improving locally is better than optimizing nothing,” isn’t working out too well. I think this is exactly the kind of counterintuitive behavior of social systems that JWF was referring too. I don’t believe you can sort these things out with CLDs or other qualitative methods, except perhaps when they are used as explanatory tools for underlying formal models.
I think the bottom line is that, inside the big tent, the tall pole must remain construction and validation of robust behavioral dynamic models.

