Reality-free Cap and Trade?

Over at Prometheus, Roger Pielke picks on Nancy Pelosi:

Speaker Nancy Pelosi (D-CA) adds to a long series of comments by Democrats that emphasize cost as a crucial criterion for evaluating cap and trade legislation, and specifically, that there should be no costs:

‘There should be no cost to the consumer,’ House Speaker Nancy Pelosi (D., Calif.) said Wednesday. She vowed the legislation would ‘make good on that’ pledge.

Of course, cost-free cap and trade defeats the purpose of cap and trade which is to raise the costs of energy, …

Pelosi’s comment sounds like fantasy, but it’s out of context. If you read the preceding paragraph in the linked article, it prefaces the quote with:

Top House Democrats are also considering a proposal to create a second consumer rebate to help lower- and middle-income families offset the higher energy costs of the cap-and-trade program.

It sounds to me like Pelosi could be talking specifically about net cost to low- and middle-income consumers. It’s hard to get a handle on what people are really talking about because the language used is so imprecise. “Cost” gets used to mean net cost of climate policy, outlays for mitigation capital, net consumer budget effects, energy or energy service expenditures, and energy or GHG prices.  So, “no cost” cap and trade could mean a variety of things:
Continue reading “Reality-free Cap and Trade?”

Aerosols and the Climate Bathtub

From RealClimate:

Over the mid-20th century, sulfate precursor emissions appear to have been so large that they more then compensated for greenhouse gases, leading to a slight cooling in the Northern Hemisphere. During the last 3 decades, the reduction in sulfate has reversed that cooling, and allowed the effects of greenhouse gases to clearly show. In addition, black carbon aerosols lead to warming, and these have increased during the last 3 decades.

For an analogy, picture a reservoir. Say that around the 1930s, rainfall into the watershed supplying the reservoir began to increase. However, around the same time, a leak developed in the dam. The lake level stayed fairly constant as the rainfall increased at about the same rate the leak grew over the next few decades. Finally, the leak was patched (in the early 70s). Over the next few decades, the lake level increased rapidly. Now, what’s the cause of that increase? Is it fair to say that lake level went up because the leak was fixed? Remember that if the rainfall hadn’t been steadily increasing, then the leak would have led to a drop in lake levels whereas fixing it would have brought the levels back to normal. However, it’s also incomplete to ignore the leak, because then it seems puzzling that the lake levels were flat despite the increased rain during the first few decades and that, were you to compare the increased rain with the lake level rise, you’d find the rise was more rapid during the past three decades than you could explain by the rain changes during that period. You need both factors to understand what happened, as you need both greenhouse gases and aerosols to explain the surface temperature observations (and the situation is more complex than this simple analogy due to the presence of both cooling and warming types of aerosols).

Read the rest: Yet More Aerosols

Bonn – Are Developing Countries Asking For the Wrong Thing?

Yesterday’s news:

BONN, Germany (Reuters) – China, India and other developing nations joined forces on Wednesday to urge rich countries to make far deeper cuts in greenhouse gas emissions than planned by 2020 to slow global warming.

I’m sure that the mental model behind this runs something like, “the developed world created most of the problem up to this point, and they’re rich, so they should get busy making deep cuts, while we grow a little more to catch up.” Regardless of fairness considerations, that approach ignores the physics of the situation. If developing countries continue to increase emissions, it hardly matters how deep cuts are in the rich world. Either everyone plays along, or mitigation doesn’t work.

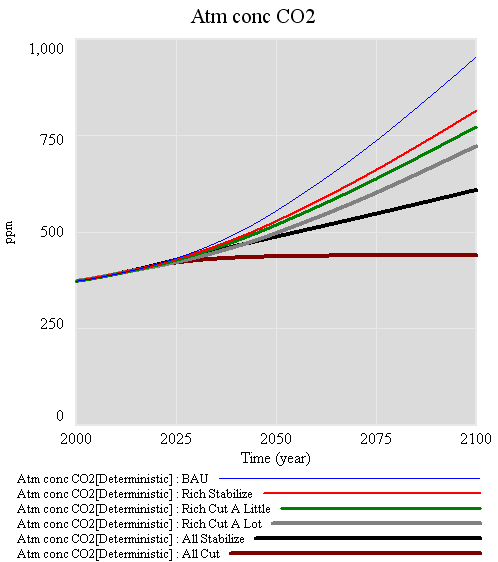
I fired up C-ROADS and ran a few scenarios to illustrate:

C-ROADS reduction scenarios

The top blue line is the AIFI business-as-usual, with rapid emissions growth. If rich nations stabilize emissions as of today, you get the red line – still much more than 2x CO2 at the end of the century. Whether the rich start cutting emissions a little (1%/yr, green) or a lot (5%/yr, green) after that makes relatively little difference, because emissions from the rich world quickly become a small share of the total. Getting everyone to merely stabilize emissions (at 2009 levels for the rich, 2020 for developing countries, black) makes a substantially bigger difference than deep cuts by the rich alone. Stabilizing CO2 in the atmosphere at a low level requires deep cuts by everyone (here 4%/year, brown).

If we’re serious about stabilization, it doesn’t make sense for the rich to decarbonize faster, so that the developing world can construct more carbon-dependent capital that will ultimately have to be deconstructed. It may sound “fair” in carbon-per-capita terms, but I don’t think that’s a very good measure of human welfare, and it’s unlikely to end up with a fair distribution of damages.

If the developing countries are really concerned about climate impacts (as they should be), they should be looking to the rich world for help getting onto a low-carbon path today, not in 20 years. They should also be willing to impose a carbon price on themselves. It won’t collapse their economies any more than it will ours. Without a price on carbon, rebound effects and leakage will eat up most gains, as the private sector responds to the real signal: “go green (but the price of carbon is zero, wink wink nudge nudge).” Their request to the rich should be about the transfers, property rights, and other changes it takes to get the job done with some measure of distributional fairness (a topic that won’t be popular in some circles).

Reactions to Waxman Markey

My take: It’s a noble effort, but flawed. The best thing about it is the broad, upstream coverage of >85% of emissions. However, there are too many extraneous pieces operating alongside the cap. Those create possible inefficiencies, where the price of carbon is nonuniform across the economy, and create a huge design task and administrative burden for EPA. It would be better to get a carbon price in place, then fiddle with RPS, LCFS, and other standards and programs as needed later. The deep cuts in emissions reflect what it takes to change the climate trajectory, but I’m concerned that the trajectory is too rigid to cope with uncertainty, even with the compliance period, banking, borrowing, and strategic reserve provisions. So-called environmental certainty isn’t helpful if it causes price volatility that leads to the undoing of the program. As always, I’d rather see a carbon tax, but I think we could work with this framework if we have to. Allowance allocation is, of course, the big wrestling match to come.

The WSJ has a quick look

Joe Romm gives it a B+

GreenPeace says it’s a good first step

USCAP likes it (they should, a lot of it is their ideas):

USCAP hails the discussion draft released by Chairmen Waxman and Markey as a strong starting point for enacting legislation to reduce greenhouse gas emissions. The discussion draft provides a solid foundation to create a climate strategy that both protects our economy and achieves the nation’s environmental goals. It recognizes that many of these issues are tightly linked and must be dealt with simultaneously. We appreciate the thoughtful approach reflected in the draft and the priority the Chairmen are placing on this important issue.

The draft addresses most of the core issues identified by USCAP in our Blueprint for Legislative Action and reflects many of our policy recommendations. Any climate program must promote private sector investment in vital low-carbon technologies that will create new jobs and provide a foundation for economic recovery. Legislation must also protect consumers, vulnerable communities and businesses while ensuring economic sustainability and environmental effectiveness.

The API hasn’t reacted, but the IPAA has coverage on its blog

CEI hates it.

Rush Limbaugh says it’ll finish us off,

RUSH: Henry Waxman’s just about finished his global warming energy bill, 648 pages, as the Democrats prepare to finish off what’s left of the United States. Folks, we have got to drive these people out of office. We have to start now. The Republicans in Congress need to start throwing every possible tactic in front of everything the Democrats are trying to do. This is getting absurd. Listen to this. Henry Waxman and Edward Markey are putting the finishing touches on a 648-page global warming and energy bill that will certainly finish this country off. They’re circulating the bill today. The text of the bill ought to be up soon at a website called globalwarming.org. The bill contains everything you’d expect from an Algore wish list. Reading this, I don’t know how this will not raise energy prices to crippling levels and finish off the auto industry as we know it. (More here)

Al Gore Armageddon

Time points out that the Senate could be a dealbreaker:

The effects of the already-intense lobbying around the issue were being felt across the Capitol, where the Senate the same afternoon passed by an overwhelming margin an amendment resolving that any energy legislation should not increase electricity or gas prices.

That’ll make it tough to get 60 votes.

Draft Climate Bill Out

AP has the story. The House Committee on Energy and Commerce has the draft. From the summary:

The legislation has four titles: (1) a ‘clean energy’ title that promotes renewable sources of energy and carbon capture and sequestration technologies, low-carbon transportation fuels, clean electric vehicles, and the smart grid and electricity transmission; (2) an ‘energy efficiency’ title that increases energy efficiency across all sectors of the economy, including buildings, appliances, transportation, and industry; (3) a ‘global warming’ title that places limits on the emissions of heat-trapping pollutants; and (4) a ‘transitioning’ title that protects U.S. consumers and industry and promotes green jobs during the transition to a clean energy economy.

One key issue that the discussion draft does not address is how to allocate the tradable emission allowances that restrict the amount of global warming pollution emitted by electric utilities, oil companies, and other sources. This issue will be addressed through discussions among Committee members.

A few quick observations, drawing on the committee summary (the full text is 648 pages and I don’t have the appetite): Continue reading “Draft Climate Bill Out”

Carbon Confusion

Lately I’ve noticed a lot of misconceptions about how various policy instruments for GHG control actually work. Take this one, from Richard Rood in the AMS climate policy blog:

The success of a market relies on liquidity of transactions, which requires availability of choices of emission controls and abatements. The control of the amount of pollution requires that the emission controls and abatement choices represent, quantifiably and verifiably, mass of pollutant. In the sulfur market, there are technology-based choices for abatement and a number of choices of fuel that have higher and lower sulfur content. Similar choices do not exist for carbon dioxide; therefore, the fundamental elements of the carbon dioxide market do not exist.

On the emission side, the cost of alternative sources of energy is high relative to the cost of energy provided by fossil fuels. Also sources of low-carbon dioxide energy are not adequate to replace the energy from fossil fuel combustion.

The development of technology requires directed, sustained government investment. This is best achieved by a tax (or fee) system that generates the needed flow of money. At the same time the tax should assign valuation to carbon dioxide emissions and encourage efficiency. Increased efficiency is the best near-term strategy to reduce carbon dioxide emissions.

I think this would make an economist cringe. Liquidity has to do with the ease of finding counterparties to transactions, not the existence of an elastic aggregate supply of abatement. What’s really bizarre, though, is to argue that somehow “technology-based choices for abatement and a number of choices of fuel that have higher and lower [GHG] content” don’t exist. Ever heard of gas and coal, Prius and Hummer, CFL and incandescent, biking and driving, … ? Your cup has to be really half empty to think that the price elasticity of GHGs is zero, absent government investment in technology, or you have to be tilting at a strawman (reducing carbon allowances in the market to some infeasible level, overnight). The fact that any one alternative (say, wind power) can’t do the job is not an argument against a market; in fact it’s a good argument for a market – to let a pervasive price signal find mitigation options throughout the economy.

There is an underlying risk with carbon trading, that setting the cap too tight will lead to short-term price volatility. Given proposals so far, there’s not much risk of that happening. If there were, there’s a simple solution, that has nothing to do with technology: switch to a carbon tax, or give the market a safety valve so that it behaves like one.

Continue reading “Carbon Confusion”

Friendly Climate Science & Policy Models

Beth Sawin just presented our C-ROADS work in Copenhagen. The model will soon be available online and in other forms, for decision support and educational purposes. It helps people to understand the basic dynamics of the carbon cycle and climate, and to add up diverse regional proposals for emissions reductions, to see what they imply for the globe. It’s a small model, yet there are those who love it. No model can do everything, so I thought I’d point out a few other tools that are available online, fairly easy to use, and serve similar purposes.

FAIR

From MNP, Netherlands. Like C-ROADS, runs interactively. The downloadable demo version is quite sophisticated, but emphasizes discovery of emissions trajectories that meet goals and constraints, rather than characterization of proposals on the table. The full research version, with sector/fuel detail and marginal abatement costs, is available on a case-by-case basis. Backed up by some excellent publications.

JCM

Ben Matthews’ Java Climate Model. Another interactive tool. Generates visually stunning output in realtime, which is remarkable given the scale and sophistication of the underlying model. Very rich; it helps to know what you’re after when you start to get into the deeper levels.

MAGICC

The tool used in AR4 to summarize the behavior of 19 GCMs, facilitating more rapid scenario experimentation and sensitivity analysis. Its companion SCENGEN does nice regional maps, which I haven’t really explored. MAGICC takes a few seconds to run, and while it has a GUI, detailed input and output is buried in text files, so I’m stretching the term “friendly” here.

I think these are the premier accessible tools out there, but I’m sure I’ve forgotten a few, so I’ll violate my normal editing rules and update this post as needed.

MIT Updates Greenhouse Gamble

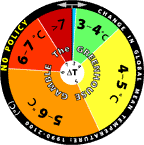
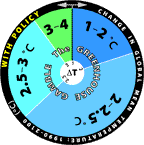
For some time, the MIT Joint Program has been using roulette wheels to communicate climate uncertainty. They’ve recently updated the wheels, based on new model projections:

No Policy Policy
New No policy Policy
Old Old no policy Old policy

The changes are rather dramatic, as you can see. The no-policy wheel looks like the old joke about playing Russian Roulette with an automatic. A tiny part of the difference is a baseline change, but most is not, as the report on the underlying modeling explains:

The new projections are considerably warmer than the 2003 projections, e.g., the median surface warming in 2091 to 2100 is 5.1°C compared to 2.4°C in the earlier study. Many changes contribute to the stronger warming; among the more important ones are taking into account the cooling in the second half of the 20th century due to volcanic eruptions for input parameter estimation and a more sophisticated method for projecting GDP growth which eliminated many low emission scenarios. However, if recently published data, suggesting stronger 20th century ocean warming, are used to determine the input climate parameters, the median projected warning at the end of the 21st century is only 4.1°C. Nevertheless all our simulations have a very small probability of warming less than 2.4°C, the lower bound of the IPCC AR4 projected likely range for the A1FI scenario, which has forcing very similar to our median projection.

I think the wheels are a cool idea, but I’d be curious to know how users respond to it. Do they cheat, and spin to get the outcome they hope for? Perhaps MIT should spice things up a bit, by programming an online version that gives users’ computers the BSOD if they roll a >7C world.

Hat tip to Travis Franck for pointing this out.

Sea Level Rise – VI – The Bottom Line (Almost)

The pretty pictures look rather compelling, but we’re not quite done. A little QC is needed on the results. It turns out that there’s trouble in paradise:

  1. the residuals (modeled vs. measured sea level) are noticeably autocorrelated. That means that the model’s assumed error structure (a white disturbance integrated into sea level, plus white measurement error) doesn’t capture what’s really going on. Either disturbances to sea level are correlated, or sea level measurements are subject to correlated errors, or both.
  2. attempts to estimate the driving noise on sea level (as opposed to specifying it a priori) yield near-zero values.

#1 is not really a surprise; G discusses the sea level error structure at length and explicitly address it through a correlation matrix. (It’s not clear to me how they handle the flip side of the problem, state estimation with correlated driving noise – I think they ignore that.)

#2 might be a consequence of #1, but I haven’t wrapped my head around the result yet. A little experimentation shows the following:

driving noise SD equilibrium sensitivity (a, mm/C) time constant (tau, years) sensitivity (a/tau, mm/yr/C)
~ 0 (1e-12) 94,000 30,000 3.2
1 14,000 4400 3.2
10 1600 420 3.8

Intermediate values yield values consistent with the above. Shorter time constants are consistent with expectations given higher driving noise (in effect, the model is getting estimated over shorter intervals), but the real point is that they’re all long, and all yield about the same sensitivity.

The obvious solution is to augment the model structure to include states representing persistent errors. At the moment, I’m out of time, so I’ll have to just speculate what that might show. Generally, autocorrelation of the errors is going to reduce the power of these results. That is, because there’s less information in the data than meets the eye (because the measurements aren’t fully independent), one will be less able to discriminate among parameters. In this model, I seriously doubt that the fundamental banana-ridge of the payoff surface is going to change. Its sides will be less steep, reflecting the diminished power, but that’s about it.

Assuming I’m right, where does that leave us? Basically, my hypotheses in Part IV were right. The likelihood surface for this model and data doesn’t permit much discrimination among time constants, other than ruling out short ones. R’s very-long-term paleo constraint for a (about 19,500 mm/C) and corresponding long tau is perfectly plausible. If anything, it’s more plausible than the short time constant for G’s Moberg experiment (in spite of a priori reasons to like G’s argument for dominance of short time constants in the transient response). The large variance among G’s experiment (estimated time constants of 208 to 1193 years) is not really surprising, given that large movements along the a/tau axis are possible without degrading fit to data. The one thing I really can’t replicate is G’s high sensitivities (6.3 and 8.2 mm/yr/C for the Moberg and Jones/Mann experiments, respectively). These seem to me to lie well off the a/tau ridgeline.

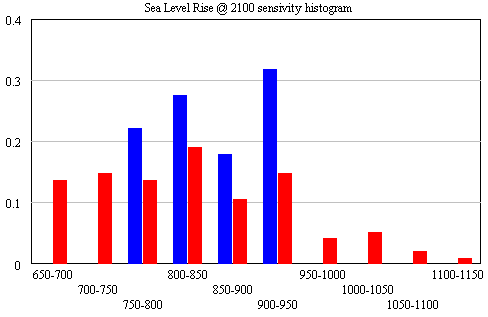
The conclusion that IPCC WG1 sea level rise is an underestimate is robust. I converted Part V’s random search experiment (using the optimizer) into sensitivity files, permitting Monte Carlo simulations forward to 2100, using the joint a-tau-T0 distribution as input. (See the setup in k-grid-sensi.vsc and k-grid-sensi-4x.vsc for details). I tried it two ways: the 21 points with a deviation of less than 2 in the payoff (corresponding with a 95% confidence interval), and the 94 points corresponding with a deviation of less than 8 (i.e., assuming that fixing the error structure would make things 4x less selective). Sea level in 2100 is distributed as follows:

Sea level distribution in 2100

The sample would have to be bigger to reveal the true distribution (particularly for the “overconfident” version in blue), but the qualitative result is unlikely to change. All runs lie above the IPCC range (.26-.59), which excludes ice dynamics.

Continue reading “Sea Level Rise – VI – The Bottom Line (Almost)”

Sea Level Rise Models – V

To take a look at the payoff surface, we need to do more than the naive calibrations I’ve used so far. Those were adequate for choosing constant terms that aligned the model trajectory with the data, given a priori values of a and tau. But that approach could give flawed estimates and confidence bounds when used to estimate the full system.

Elaborating on my comment on estimation at the end of Part II, consider a simplified description of our model, in discrete time:

(1) sea_level(t) = f(sea_level(t-1), temperature, parameters) + driving_noise(t)

(2) measured_sea_level(t) = sea_level(t) + measurement_noise(t)

The driving noise reflects disturbances to the system state: in this case, random perturbations to sea level. Measurement noise is simply errors in assessing the true state of global sea level, which could arise from insufficient coverage or accuracy of instruments. In the simple case, where driving and measurement noise are both zero, measured and actual sea level are the same, so we have the following system:

(3) sea_level(t) = f(sea_level(t-1), temperature, parameters)

In this case, which is essentially what we’ve assumed so far, we can simply initialize the model, feed it temperature, and simulate forward in time. We can estimate the parameters by adjusting them to get a good fit. However, if there’s driving noise, as in (1), we could be making a big mistake, because the noise may move the real-world state of sea level far from the model trajectory, in which case we’d be using the wrong value of sea_level(t-1) on the right hand side of (1). In effect, the model would blunder ahead, ignoring most of the data.

In this situation, it’s better to use ordinary least squares (OLS), which we can implement by replacing modeled sea level in (1) with measured sea level:

(4) sea_level(t) = f(measured_sea_level(t-1), temperature, parameters)

In (4), we’re ignoring the model rather than the data. But that could be a bad move too, because if measurement noise is nonzero, the sea level data could be quite different from true sea level at any point in time.

The point of the Kalman Filter is to combine the model and data estimates of the true state of the system. To do that, we simulate the model forward in time. Each time we encounter a data point, we update the model state, taking account of the relative magnitude of the noise streams. If we think that measurement error is small and driving noise is large, the best bet is to move the model dramatically towards the data. On the other hand, if measurements are very noisy and driving noise is small, better to stick with the model trajectory, and move only a little bit towards the data. You can test this in the model by varying the driving noise and measurement error parameters in SyntheSim, and watching how the model trajectory varies.

The discussion above is adapted from David Peterson’s thesis, which has a more complete mathematical treatment. The approach is laid out in Fred Schweppe’s book, Uncertain Dynamic Systems, which is unfortunately out of print and pricey. As a substitute, I like Stengel’s Optimal Control and Estimation.

An example of Kalman Filtering in everyday devices is GPS. A GPS unit is designed to estimate the state of a system (its location in space) using noisy measurements (satellite signals). As I understand it, GPS units maintain a simple model of the dynamics of motion: my expected position in the future equals my current perceived position, plus perceived velocity times time elapsed. It then corrects its predictions as measurements allow. With a good view of four satellites, it can move quickly toward the data. In a heavily-treed valley, it’s better to update the predicted state slowly, rather than giving jumpy predictions. I don’t know whether handheld GPS units implement it, but it’s possible to estimate the noise variances from the data and model, and adapt the filter corrections on the fly as conditions change.

Continue reading “Sea Level Rise Models – V”