Data Science should be about more than data

There are lots of “top 10 skills” lists for data science and analytics. The ones I’ve seen are all missing something huge.

Here’s an example:

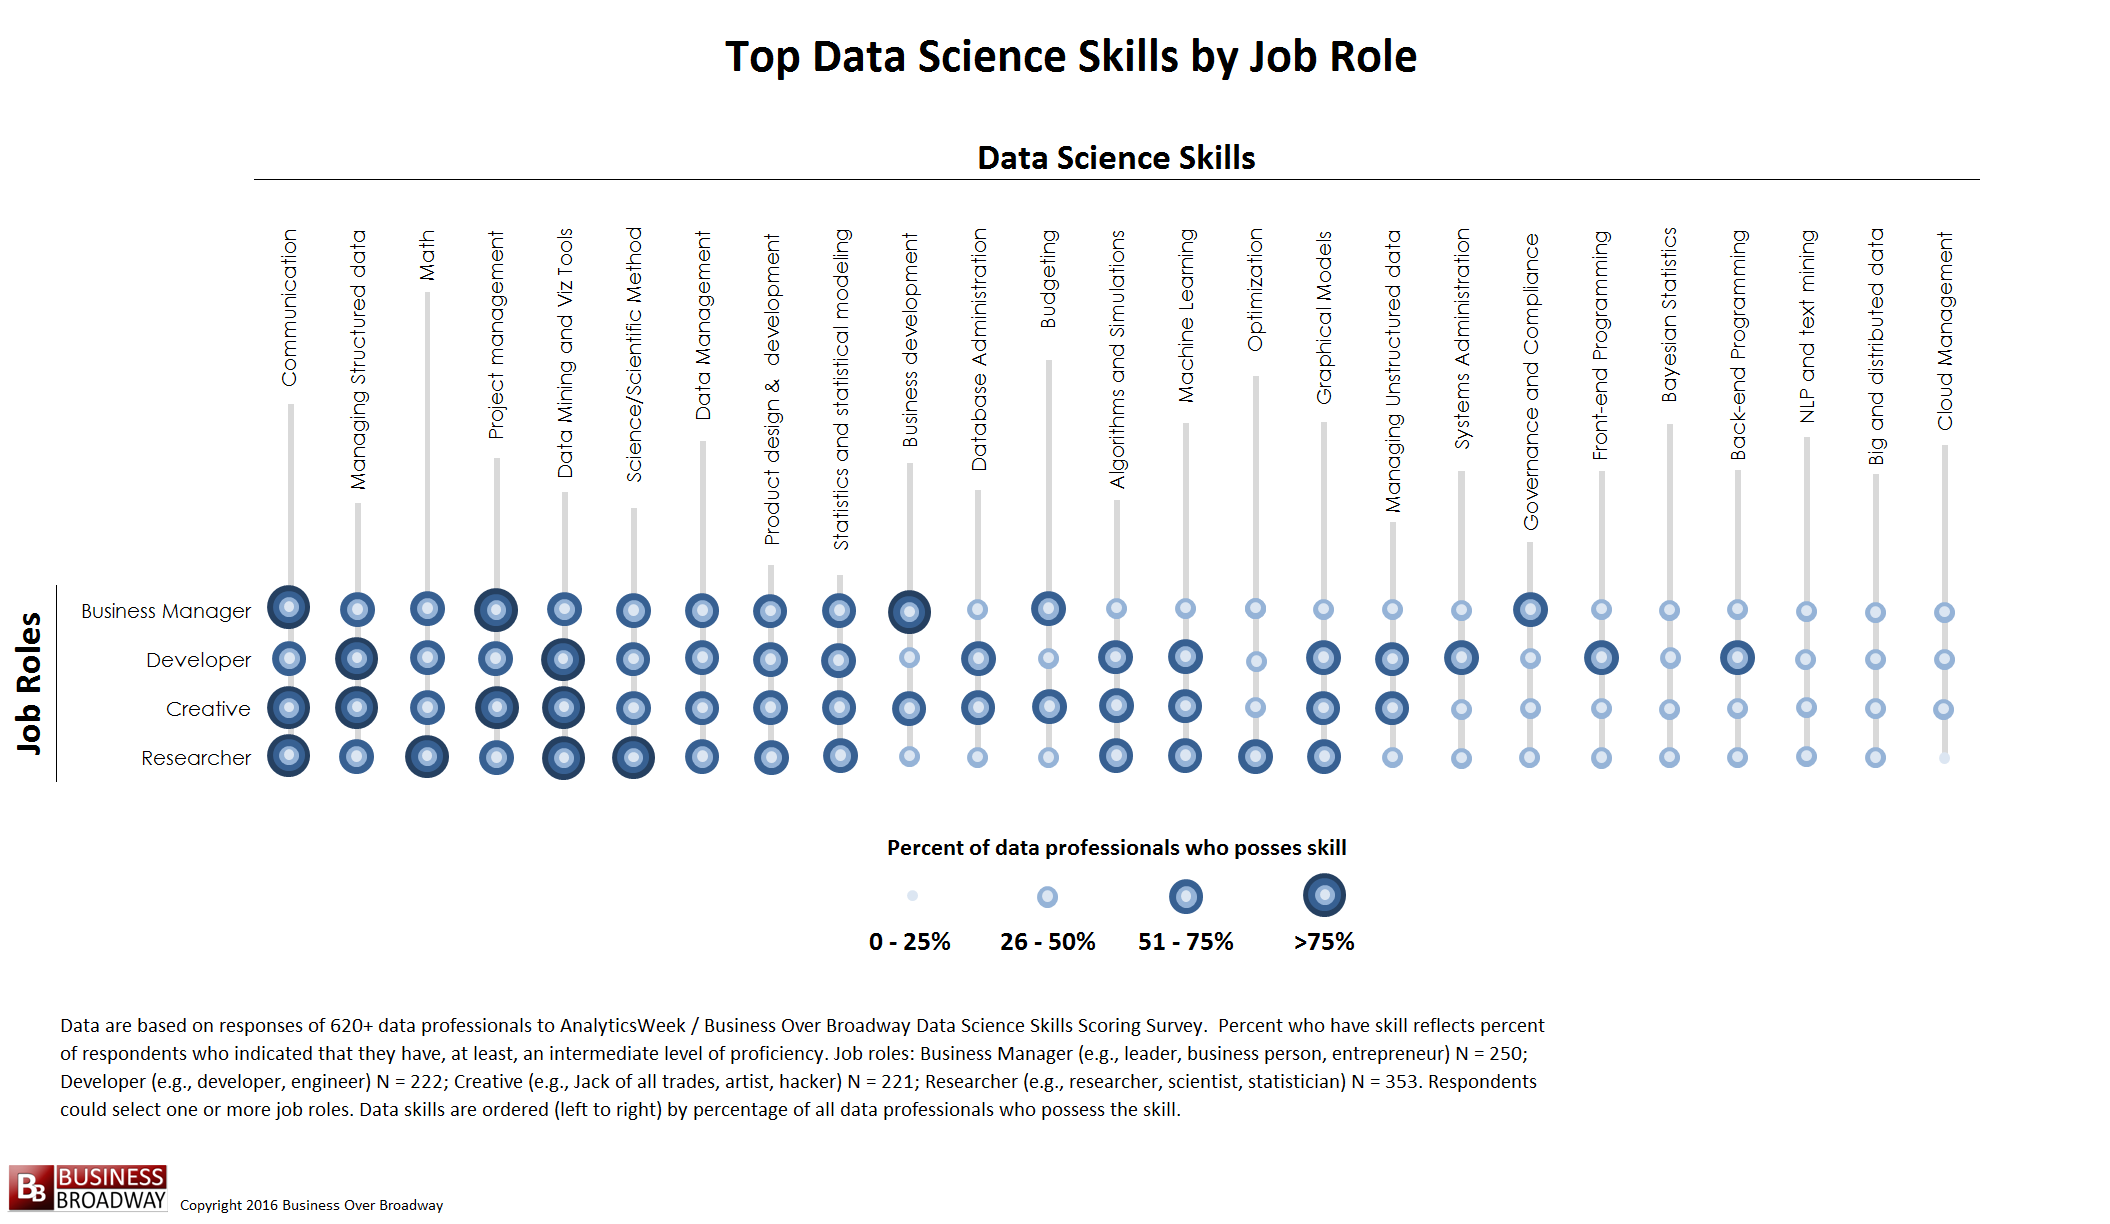
Business Broadway – Top 10 Skills in Data Science

Modeling barely appears here. Almost all the items concern the collection and analysis of data (no surprise there). Just imagine for a moment what it would be like if science consisted purely of observation, with no theorizing.

What are you doing with all those data points and the algorithms that sift through them? At some point, you have to understand whether the relationships that emerge from your data make any sense and answer relevant questions. For that, you need ways of thinking and talking about the structure of the phenomena you’re looking at and the problems you’re trying to solve.

I’d argue that one’s literacy in data science is greatly enhanced by knowledge of mathematical modeling and simulation. That could be system dynamics, control theory, physics, economics, discrete event simulation, agent based modeling, or something similar. The exact discipline probably doesn’t matter, so long as you learn to formalize operational thinking about a problem, and pick up some good habits (like balancing units) along the way.

Data science meets the bottom line

A view from simulation & System Dynamics

I come to data science from simulation and System Dynamics, which originated in control engineering, rather than from the statistics and database world. For much of my career, I’ve been working on problems in strategy and public policy, where we have some access to mental models and other a priori information, but little formal data. The attribution of success is tough, due to the ambiguity, long time horizons and diverse stakeholders.

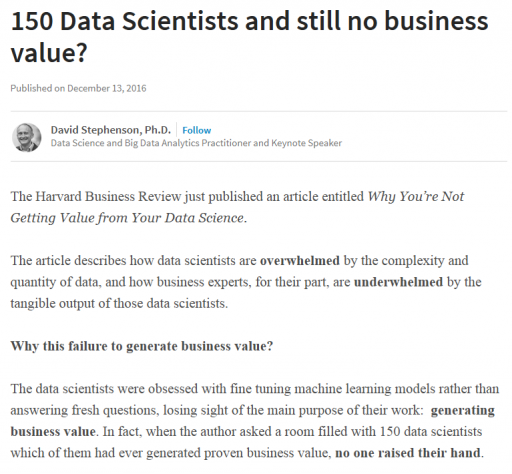
I’ve always looked over the fence into the big data pasture with a bit of envy, because it seemed that most projects were more tactical, and establishing value based on immediate operational improvements would be fairly simple. So, I was surprised to see data scientists’ angst over establishing business value for their work:
One part of solving the business value problem comes naturally when you approach things from the engineering point of view. It’s second nature to include an objective function in our models, whether it’s the cash flow NPV for a firm, a project’s duration, or delta-V for a rocket. When you start with an abstract statistical model, you have to be a little more deliberate about representing the goal after the model is estimated (a simulation model may be the delivery vehicle that’s needed).

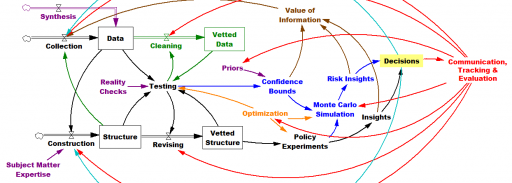
You can solve a problem whether you start with the model or start with the data, but I think your preferred approach does shape your world view. Here’s my vision of the simulation-centric universe:

The more your aspirations cross organizational silos, the more you need the engineering mindset, because you’ll have data gaps at the boundaries – variations in source, frequency, aggregation and interpretation. You can backfill those gaps with structural knowledge, so that the model-data combination yields good indirect measurements of system state. A machine learning algorithm doesn’t know about dimensional consistency, conservation of people, or accounting identities unless the data reveals such structure, but you probably do. On the other hand, when your problem is local, data is plentiful and your prior knowledge is weak, an algorithm can explore more possibilities than you can dream up in a given amount of time. (Combining the two approaches, by using prior knowledge of structure as “free data” constraints for automated model construction, is an area of active research here at Ventana.)

I think all approaches have a lot in common. We’re all trying to improve performance with systems science, we all have to deal with messy data that’s expensive to process, and we all face challenges formulating problems and staying connected to decision makers. Simulations need better connectivity to data and users, and purely data driven approaches aren’t going to solve our biggest problems without some strategic context, so maybe the big data and simulation worlds should be working with each other more.

Cross-posted from LinkedIn
Rats leaving a sinking Sears

Sears Roebuck & Co. was a big part of my extended family at one time. My wife’s grandfather started in the mail room and worked his way up to executive, through the introduction of computers and the firebombing in Caracas. Sadly, its demise appears imminent.

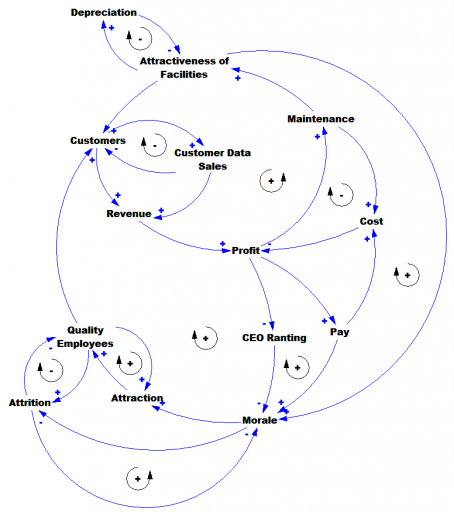
Business Insider has an interesting article on the dynamics of Sears’ decline. Here’s a quick causal loop diagram summarizing some of the many positive feedbacks that once drove growth, but now are vicious cycles:

sears_rats_sinking_ships_corr

h/t @johnrodat

CLD corrected, 1/9/17.

Exponential Epi Pens

Mylan Pharmaceuticals is in the news for taking the price of EpiPens, which contain about $1 of active ingredient, to stratospheric levels. I think Bloomberg broke the story, and the NY Times has the latest.

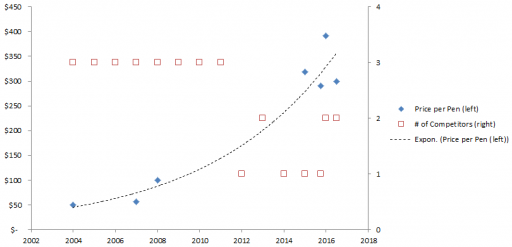
Here’s the price trajectory:

epiPen

epi pen data.xlsx

The rate of increase is not that far from the health care inflation rate in general, except that in this case, there’s no obvious underlying cost driver, hence the allegations of gouging.

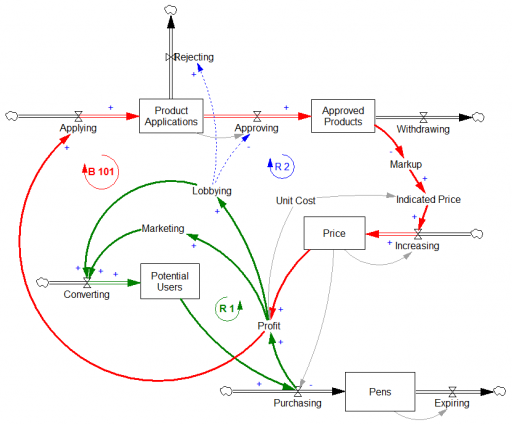
Here’s a first cut at the structure of the problem:

epi_dynamic

Econ 101 says that high profits should attract competition, putting downward pressure on prices (loop B 101). However, that’s not happening, because the FDA is the gatekeeper on product approval. It’s not clear to me whether the FDA just makes the approval delay systematically long and uncertain, or that it’s actually captive to Mylan lobbyists and holding new entrants to higher standards, as some hint (that would be a reinforcing loop, R2). Either way, the only loop that’s functioning is Mylan’s reinvestment in marketing and lobbying to create demand (R 1).

This reminds me of California’s electricity market deregulation debacle, which created a wholesale power market without corresponding retail price elasticity. Utilities were stranded between hammer (floating generation prices) and anvil (fixed demand). The resulting mess was worse than might have occurred in either a more or less deregulated market.

Similarly, to bring this market under control, you’d either have to get the FDA out of the way, restoring the balancing loop, or regulate the price side of the market, constraining the reinforcing loop. In this case, it may be the court of public opinion that puts the brakes on, adding a balancing loop of bad press that has so far cost Mylan dearly in investor confidence, if nothing else.

Mylan responds to gouging allegations rather unconvincingly, I think. Their CEO argues that the problem is multiple markups in the supply chain, subsidization of Europe, and R&D. It’s hard to square those external-cause arguments with Mylan’s financials.

Self-generated seasonal cycles

This time of year, systems thinkers should eschew sugar plum fairies and instead dream of Industrial Dynamics, Appendix N:

Self-generated Seasonal Cycles

Industrial policies adopted in recognition of seasonal sales patterns may often accentuate the very seasonality from which they arise. A seasonal forecast can lead to action that may cause fulfillment of the forecast. In closed-loop systems this is a likely possibility. The analysis of sales data in search of seasonality is fraught with many dangers. As discussed in Appendix F, random-noise disturbances contain a broad band of component frequencies. This means that any effort toward statistical isolation of a seasonal sales component will find some seasonality in the random disturbances. Should the seasonality so located lead to decisions that create actual seasonality, the process can become self-regenerative.

Self-induced seasonality appears to occur many places in American industry. Sometimes it is obvious and clearly recognized, and perhaps little can be done about it. An example of the obvious is the strong seasonality in items such as cameras sold in the Christmas trade. By bringing out new models and by advertising and other sales promotion in anticipation of Christmas purchases, the industry tends to concentrate its sales at this particular time of year.

Other kinds of seasonality are much less clear. Almost always when seasonality is expected, explanations can be found to justify whatever one believes to be true. A tradition can be established that a particular item sells better at a certain time of year. As this “fact” becomes more and more widely believed, it may tend to concentrate sales effort at the time when the customers are believed to wish to buy. This in turn still further heightens the sales at that particular time.

Retailer sales & e-commerce sales, from FRED


Facebook Reloaded 2013

Facebook has climbed out of its 2012 doldrums to a market cap of $115 billion today. So, I’ve updated my user tracking and valuation model, just for kicks.

As in my last update, user growth continues to modestly exceed the original estimates. The user “carrying capacity” now is about 1.35 billion users, vs. .95 originally (K950 on graph) and 1.07 in 2012 – within the range of scenarios I originally ran, but well above the “best guess”. My guess is that the model will continue to underpredict for a while, because this is an inevitable pitfall of using a single diffusion process to represent what is surely the aggregate of several processes – stationary vs. mobile, different regions and demographics, etc. Of course, in the long run, users could also go down, which the basic logistic model can’t represent.

You can see what’s going on if you plot growth against users -the right tail doesn’t go to 0 as fast as the logistic assumes:

User growth probably isn’t a huge component of valuation, because these are modest differences on a percentage basis. Marginal users may be less valuable as well.

With revenue per user at a constant $7/user/year, and 30% margins, and the current best-guess model, FB is now worth $35 billion. What does it take to get to the ballpark of current market capitalization? Here’s one way:

  • The carrying capacity ceiling for users continues to grow to 2 billion, and
  • revenue per user rises to $25/user/year

This preserves some optimistic base case assumptions,

  • The risk-free interest rate takes 5 more years to rise substantially above 0 to a (still low) long term rate of 3%
  • Margins stay at 30% as in 2009-2011 (vs. 18% y.t.d.)

Think it’ll happen?

facebook 3 update 2.vpm

Facebook reloaded

Facebook trading opened with it’s IPO and closed at $105 billion market capitalization.

I wondered how my model tracked reality over the last six months.

Facebook stats put users at 901 million at the end of March. My maximum likelihood run was rather lower than that – it corresponds with the K950 run in my last post (saturation users of 950 million), and predicted 840M users for end of Q1 2012. The latest data point corresponds with my K1250 run. I’m not sure if it’s interesting or not, but the new data point is a bit of an outlier. For one thing, it’s reported to the nearest million at a precise time, not with aggressive rounding as in earlier numbers I’d found. Re-estimating the model with the new, precise data point, it’s necessary to pass on the high size over most of the data from 2008-2011. That seems a bit fishy – perhaps a change in reporting methods has occurred.

In any case, it hardly matters whether the user carrying capacity is a bit over or under a billion. Either way, the valuation with current revenue per user is on the order of $20 billion. I had picked $5/user/year based on past performance, which turned out to be very close to the 2011 actuals. It would take a 10-year ramp to 7x current revenue/user to justify current pricing, or very low interest rates and risk premiums.

So the real question is, can Facebook increase its revenue per user dramatically?

Another short sell opportunity?

“I have no interest in shorting a cultural phenomenon,” hedge fund manager Jeffrey Matthews of Ram Partners in Greenwich, Connecticut, told Reuters in an email interview.

Asked if this was because such stocks trade without regard to normal market valuation, he wrote back, “Bingo.”

Self-generated Seasonal Cycles

Why is Black Friday the biggest shopping day of the year? Back in 1961, Jay Forrester identified an endogenous cause in Appendix N of Industrial Dynamics, Self-generated Seasonal Cycles:

Industrial policies adopted in recognition of seasonal sales patterns may often accentuate the very seasonality from which they arise. A seasonal forecast can lead to action that may cause fulfillment of the forecast. In closed-loop systems this is a likely possibility. … any effort toward statistical isolation of a seasonal sales component will find some seasonality in the random disturbances. Should the seasonality so located lead to decisions that create actual seasonality, the process can become self-regenerative.

I think there are actually quite a few reinforcing feedback mechanisms, some of which cross consumer-business stovepipes and therefore are difficult to address.

Before heading to the mall, it’s a good day to think about stuff.

Update: another interesting take.

Et tu, Groupon?

Is Groupon overvalued too? Modeling Groupon actually proved a bit more challenging than my last post on Facebook.

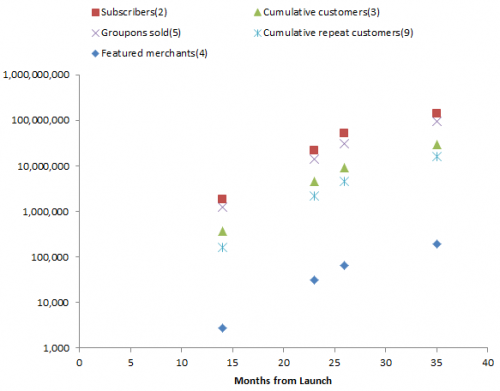
Again, I followed in the footsteps of Cauwels & Sornette, starting with the SEC filing data they used, with an update via google. C&S fit a logistic to Groupon’s cumulative repeat sales. That’s actually the end of a cascade of participation metrics, all of which show logistic growth:

The variable of greatest interest with respect to revenue is Groupons sold. But the others also play a role in determining costs – it takes money to acquire and retain customers. Also, there are actually two populations growing logistically – users and merchants. Growth is presumably a function of the interaction between these two populations. The attractiveness of Groupon to customers depends on having good deals on offer, and the attractiveness to merchants depends on having a large customer pool.

I decided to start with the customer side. The customer supply chain looks something like this:

Subscribers data includes all three stocks, cumulative customers is the right two, and cumulative repeat customers is just the rightmost.

Continue reading “Et tu, Groupon?”

Firefighting and other project dynamics

The tipping loop, a positive feedback that drives sequential or concurrent projects into permanent firefighting mode, is actually just one of a number of positive feedbacks that create project management traps. Here are some others:

  • Rework – the rework cycle is central to project dynamics. Rework arises when things aren’t done right the first time. When errors are discovered, tasks have to be reworked, and there’s no guarantee that they’ll be done right the second time either. This creates a reinforcing loop that bloats project tasks beyond what’s expected with perfect execution.
  • Brooks’ Law – adding resources to a late project makes it later. There are actually several feedback loops involved:
    • Rookie effects: new resources take time to get up to speed. Until they do, they eat up the time of senior staff, decreasing output. Also, they’re likely to be more error prone, creating more rework to be dealt with downstream.
    • Diseconomies of scale from communication overhead.
  • Burnout – under schedule pressure, it’s tempting to work harder and longer. That works briefly, but sustained overtime is likely to be counterproductive, due to decreases in productivity, turnover, and increases in error rates.
  • Congestion – in construction or assembly, a delay in early phases may not delay the arrival of materials from suppliers. Unused materials stack up, congesting the work site and slowing progress further.
  • Dilution – trying to overcome stalled phases by tackling too many tasks in parallel thins resources to the point that overhead consumes all available time, and progress grinds to a halt.
  • Hopelessness – death marches are no fun, and the mere fact that a project is going astray hurts morale, leading to decreased productivity and loss of resources as rats leave the sinking ship.

Any number of things can contribute to schedule pressure that triggers these traps. Often the trigger is external, such as late-breaking change orders or regulatory mandates. However, it can also arise internally through scope creep. As long as it appears that a project is on schedule (a supposition that’s likely to prove false in hindsight), it’s hard to resist additional feature requests and suppress gold-plating urges of developers.

Taylor & Ford integrate a number of these dynamics into a simple model of single-project tipping points. They generically characterize the “ripple effect” via a few parameters: one characterizes “the amount of impact that reworked portions of the project have on the total work required to complete the project” and another captures the effect of schedule pressure on generation of rework. They suggest a robust design approach that keeps projects out of trouble, by ensuring that the vicious cycles created by these loops do not become dominant.

Because projects are complicated nests of feedback, it’s not surprising that we manage them poorly. Cognitive biases and learned heuristics can exacerbate the effect of vicious cycles arising from the structure of the work itself. For example,

… many organizations reward and promote engineers based on their ability to save troubled projects. Consider, for example, one senior manager’s reflection on how developers in his organizations were rewarded:

Occasionally there is a superstar of an engineer or a manager that can take one of these late changes and run through the gauntlet of all the possible ways that it could screw up and make it a success. And then we make a hero out of that person. And everybody else who wants to be a hero says “Oh, that is what is valued around here.” It is not valued to do the routine work months in advance and do the testing and eliminate all the problems before they become problems. …

… allowing managers to “save” troubled projects, and therefore receive accolades and benefits, creates a situation in which, for those interested in advancement, there is little incentive to execute a project properly from start to finish. While allowing such heroics may help in the short run, the long run health of the development system is better served by not rewarding them.

Repenning, Gonçalves & Black (2001) CMR

… much of the complexity of concurrent development—and the implementation failures that plague many organizations—arises from interactions between the technical and behavioral dimensions. We use a dynamic project model that explicitly represents these interactions to investigate how a ‘‘Liar’s Club’’—concealing known rework requirements from managers and colleagues—can aggravate the ‘‘90% syndrome,’’ a common form of schedule failure, and disproportionately degrade schedule performance and project quality.

Sterman & Ford (2003) Concurrent Engineering

Once caught in a downward spiral, managers must make some attribution of cause. The psychology literature also contains ample evidence suggesting that managers are more likely to attribute the cause of low performance to the attitudes and dispositions of people working within the process rather than to the structure of the process itself …. Thus, as performance begins to decline due to the downward spiral of fire fighting, managers are not only unlikely to learn to manage the system better, they are also likely to blame participants in the process. To make matters even worse, the system provides little evidence to discredit this hypothesis. Once fire fighting starts, system performance continues to decline even if the workload returns to its initial level. Further, managers will observe engineers spending a decreasing fraction of their time on up-front activities like concept development, providing powerful evidence confirming the managers’ mistaken belief that engineers are to blame for the declining performance.

Finally, having blamed the cause of low performance on those who work within the process, what actions do managers then take? Two are likely. First, managers may be tempted to increase their control over the process via additional surveillance, more detailed reporting requirements, and increasingly bureaucratic procedures. Second, managers may increase the demands on the development process in the hope of forcing the staff to be more efficient. The insidious feature of these actions is that each amounts to increasing resource utilization and makes the system more prone to the downward spiral. Thus, if managers incorrectly attribute the cause of low performance, the actions they take both confirm their faulty attribution and make the situation worse rather than better. The end result of this dynamic is a management team that becomes increasingly frustrated with an engineering staff that they perceive as lazy, undisciplined, and unwilling to follow a pre-specified development process, and an engineering staff that becomes increasingly frustrated with managers that they feel do not understand the realities of the system and, consequently, set unachievable objectives.

Repenning (2001) JPIM

There’s a long history of the use of SD models to solve these problems, or to resolve conflicts over attribution after the fact.