
Stumbled upon while searching for a reference: Richard Tol Changes Tune, Talks Carbon Tax. From what I’ve read, Tol is too much of a nonconformist to club with the professional skeptics, and has probably always preferred a Hotelling-style carbon price trajectory, so I’m not convinced that this is really a change, but it’s intriguing.
Category: Climate
Questioning Imbalance
Nature has a review, by economist Dieter Helm, of William Nordhaus’ new book, A Question of Balance. I don’t have the book yet, but I’ll certainly check it out. I like the conclusion of the review:
But it may be naive to assume that substituting for environmental systems is so easy. Feedbacks in the system may be such that as climate change unfolds, the return on capital and hence the discount rate falls. Environmental damage may slow or stop economic growth; if that were the case, we would not be much better off in the future. And if we are not so well off in growth terms, Nordhaus’s slower and more measured policy approach may not be so favourable over taking rapid action now. In other words, Stern’s conclusion might be correct, but not his derivation of it ’” right answer, wrong analysis.
This is a crucial point. Richard Tol pointed out the substitutability problem back in 1994 but it hasn’t really found its way into formalization in mainstream IAMs. The issue of slowing or stopping growth isn’t limited to climate feedback; oil and gas depletion, the ever-present possibility of conflict, and degradation of other resources also impose constraints.
I have to take issue with one part of the review:
Where A Question of Balance has most power is where it is most controversial. Nordhaus tackles Stern head on. Stern’s case for urgent action, which the DICE model shows would be excessively expensive in the short term, rests upon his radical assumption that the time discount rate should be close to zero. This means that we should value people’s consumption equally regardless of whether they live now or in the future. Nordhaus has little time for this moral philosophy: he takes a much more positivistic position, grounded in market evidence and what people actually do, as reflected in market interest rates. The difference between Nordhaus’s optimal climate change policy and Stern’s policy based on a zero discount rate translates into a tenfold difference in the price of carbon. Stern’s discounting approach, Nordhaus argues, gives too low a rate of return and too big a savings rate on climate-stabilizing investments compared with actual macroeconomic data. Not surprisingly, then, his verdict is damning. [emphasis added]
The Stern discounting critique has been done to death. I recently discussed some of the issues here (in particular, see the presentation on discounting and welfare in integrated assessment modeling, based on the primer I wrote for last year’s Balaton meeting). In a nutshell, the discount rate can be decomposed into two terms: pure time preference and inequality aversion. Ramsey showed that, along an optimal growth path,
- interest rate = pure time preference + inequality aversion x growth rate
Stern has been criticized for choosing discounting parameters that aren’t consistent with observed interest and growth rates. That’s true, but let’s not confuse the map with the territory. Stern’s choice is inconsistent with the optimal growth framework, but is the optimal growth framework consistent with reality? Clearly, market interest rates reflect what people actually do in some sense, but they do it in a rather complex institutional setting, rife with opportunities for biases and misperceptions of feedback. Do market interest rates reflect what people actually want? Unfortunately, the micro foundation of macroeconomics is too wobbly to say.
Notice also that the equation above is underdetermined. That is, for realistic growth and interest rates, a variety of pure time preference and inequality aversion assumptions yield equality. Nordhaus, in his original DICE work, preferred 3%/yr pure time preference (no interest in the grandkids) and unit inequality aversion (doubling my income yields the same increment in happiness as doubling a poor African farmer’s income). Dasgupta prefers zero time preference on ethical grounds (as did Ramsey) and higher inequality aversion. The trouble with Nordhaus’ approach is that, unless the new book cites new research, there is no empirical basis for rates of time preference that heavily discount the future. It is difficult to create a realistic simulated context for such long term decisions, but the experimental evidence I’ve seen suggests quite the opposite, that people express some concern for even the distant future.
Thus it’s a mistake to call Nordhaus’ approach “positivistic.” That lends undue authority to what should be recognized as an ethical choice. (Again, this is subject to the caveat that Nordhaus might have new evidence. I await the book.)
Aviation Pontification
Last week I presented in an INFORMS 2008 panel, Role Reversal: The Impact of Climate Change on Aviation. My slides are here (you’ll miss a model demo using a carbon cycle/climate model, but that wasn’t central). I got challenged on one assertion – that participation in regional initiatives is meaningful – on the grounds that federal preemption definitively assigns aviation regulation to the national level. That may be so, but I suspect that mental models formed through regional experimentation will still shape what happens nationally. Without early involvement, aviation could find itself getting pounded into the nearest available policy pigeonhole, regardless of fit. Avaitors joke that, “gravity never loses; the best you can hope for is a draw.” The same could perhaps be said of aviation’s chance of withstanding the inexorable consequences of GHG accumulation.
The Deal We Ain't Got
Today, Drew Jones and I presented a simple model as part of the Tällberg Forum’s Washington Conversation, ‘The climate deal we need.’ Our goal was to build from some simple points about the bathtub dynamics of the carbon cycle and climate to yield some insights about what’s needed. Our aspirational list of insights to get across included,
- stabilizing emissions near current levels fails to stabilize atmospheric concentrations any time soon (because emissions now exceed uptake of carbon; stabilization continues that condition, and the residual accumulates in the atmosphere)
- achieving stabilization of atmospheric CO2 at low levels (Hansen et al.’s 350 ppm) requires very aggressive cuts (for the same reason; if carbon cycle feedbacks from temperature kick in, negative emissions could be needed)
- current policies are not on track to meaningful reductions (duh)
- nevertheless, there is a path (Hansen et al.’s “where should humanity aim” paper lays out one option, and there are others)
- starting soon is essential (the bathtub continues to fill while we delay – a costly gamble)
- international negotiation dynamics are tricky due to diversity of interests, coupled problem spaces, and difficulty of transfers (simulations shadow this)
- but everyone has to be on board or little happens (any one major region or sector, uncontrolled, can blow the deal by emitting above natural uptake)
A good moment came when someone asked, “Why should we care about staying below some temperature threshold?” (I think a scenario with about 3.5C was on the screen at the time). Jim Hansen answered, “because that would be a different planet.”
The conversation didn’t lead to specification of “the deal we need” but it explored a number of interesting facets, which I’ll relate in a few follow-on posts.
There's always something more pressing …
One reason long-term environmental issues like climate change are so hard to solve is that there’s always something else to do that seems more immediately pressing. War? Energy crisis? Financial meltdown? Those grab headlines, leaving the long-term problems for the slow news days:
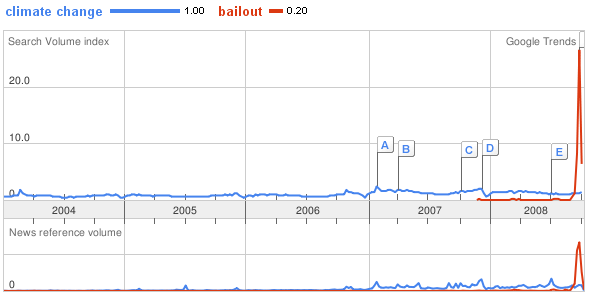
In this case, I don’t think slow and steady wins the race. The financial sector gets a trillion dollars in one year, and climate policy gets the Copenhagen Consensus.
Three climate negotiators walk into a bar …
Analogies can be dangerous when you don’t know their limitations, but they can be a good way of distilling a lot of technical details into a central point. A flurry of emails last week resulted in this story at Climate Interactive, about some inebriated decision makers who can’t predict the consequences of their actions. It reminds me of another favorite, cited in Cloudy Skies:
The article gives a fascinating insight into the way international politics struggles with complex technical issues. I was inspired to set up an experiment to test some of the ideas, and hit upon the analogy of using my bath instead of the Earth and taking the water as carbon dioxide. I jammed the plug firmly, and turned one tap to full. I observed that the bath was filling with water. I turned the flow down to 80% – a massive 20% reduction – only to discover that it was still filling but slightly more slowly. At this point I was joined by my neighbour, an American. He pointed out that reducing the flow by 20% was out of the question; we haggled for a bit before agreeing on a reduction to 94.8%. We thought the 5.2% reduction had a nice ring to it. Oddly, the bath was still filling up with water at almost the same rate that it had been initially. My friend then gave me a five pound note to turn the tap down by another 20%. I did so. He then turned on the other tap to exactly counter the 20% saving. I complained, only to be told that he had bought my credits, whatever that means. He then rushed out, returning with a bucket which he put under the second tap. I was so impressed that I did not notice for a moment that the bath was still filling up and that the bucket would soon overflow. We decided we had experimented enough for one day and went off to the pub. We were on our third pint when we remembered that the experiment was still running.
Letter to The Chemical Engineer from A. Lodge (1999)
Unfortunately, even in simple systems, intuition often deserts us. The fact that mental models fail to capture the essence of climate dynamics is but one symptom of this. This Thursday, Drew Jones and I will present a simple model designed to close the gap at the Tällberg Forum’s Washington Conversation, “the climate deal we need.”
WCI Design Recommendations
Yesterday the WCI announced its design recommendations.
Update 9/26: WorldChanging has another take on the WCI here.
I haven’t read the whole thing, but here’s my initial impression based on the executive summary:
Scope
Major gases, including CO2, methane, nitrous oxide, hydrofluorocarbons, perfluorocarbons and sulfur hexafluoride.
| What? | In scope? | How/where? |
| Large Industrial & Commercial, >25,000 MTCO2eq/yr | ||
|
Combustion Emissions |
Yes | Point of emission |
|
Process Emissions |
Yes | Point of emission |
| Electricity | Yes | “First Jurisdictional Deliverer” – includes power generated outside WCI |
| Small Industrial, Commercial, Residential | Second Compliance Period (2015-2017) | Upstream (“where fuels enter commerce in the WCI Partner jurisdictions, generally at a distributor. The precise point is TBD and may vary by jurisdiction”) |
| Transportation | ||
|
Gasoline & Diesel |
Second Compliance Period (2015-2017) | Upstream (“where fuels enter commerce in the WCI Partner jurisdictions, generally at a terminal rack, final blender, or distributor. The precise point is TBD and may vary by jurisdiction”) |
|
Biofuel combustion |
No | |
| Biofuel & fossil fuel upstream | To be determined | ? |
| Biomass combustion | No, if determined to be carbon neutral | |
| Agriculture & Forestry | No | |
(See an earlier Midwestern Accord matrix here.)
How To Fix A Carbon Tax
Imagine that you and I live in a place that has just implemented a carbon tax. I, being a little greener than you, complain that the tax isn’t high enough, in that it’s not causing emissions to stabilize or fall. As a remedy, I propose the following:
- At intervals, a board will set targets for emissions, and announce them in advance for the next three years.
- On a daily basis, the board will review current emissions to see if they’re on track to meet the annual target.
- The daily review will take account of such things as expectations about growth, the business cycle, weather (as it affects electric power and heating demand), and changing fuel prices.
- Based on its review, the board will post a daily value for the carbon tax, to ensure that the target is met.
Sound crazy? Welcome to cap and trade. The only difference is that the board’s daily review is distributed via a market. The presence of a market doesn’t change the fact that emissions trading has its gains backwards: rapid adjustment of prices to achieve an emissions target that can only be modified infrequently (the latter due to the need to set stable quantity expectations). Willingness to set a cap at a level below whatever a tax achieves is equivalent to accepting a higher price of carbon. Why not just raise the tax, and have lower transaction costs, broader sector coverage, and less volatility to boot?
Certainly cap and trade is a viable second-best policy, especially if augmented with a safety valve or a variable-quantity auction providing some supply-side elasticity. However, I find the scenario playing out in BC quite bizarre.
Update: more detailed thoughts on taxes and trading in this article.
The GAO's Panel of Economists on Climate
I just ran across a May 2008 GAO report, detailing the findings of a panel of economists convened to consider US climate policy. The panel used a modified Delphi method, which can be good or evil. The eighteen panelists are fairly neoclassical, with the exception of Richard Howarth, who speaks the language but doesn’t drink the Kool-aid.
First, it’s interesting what the panelists agree on. All of the panelists supported establishing a price on greenhouse gas emissions, and a majority were fairly certain that there would be a net benefit from doing so. A majority also favored immediate action, regardless of the participation of other countries. The favored immediate action is rather fainthearted, though. One-third favored an initial price range under $10/tonCO2, and only three favored exceeding $20/tonCO. One panelist specified a safety valve price at 55 cents. Maybe the low prices are intended to rise rapidly (or at the interest rate, per Hotelling); otherwise I have a hard time seeing why one would bother with the whole endeavor. It’s quite interesting that panelists generally accept unilateral action, which by itself wouldn’t solve the climate problem. Clearly they are counting on setting an example, with imitation bringing more emissions under control, and perhaps also on first-mover advantages in innovation.
Regional Climate Initiatives – Model Roll Call – Part III
It seems like a good time for another installment to the regional climate initiative roll call.
Alaska signed on as a WCI observer in 2007.
Like many states, Alaska has completed inventories of GHG emissions and potential climate impacts and identified early action items. Impacts are addressed in a joint commission report. I’ve read or skimmed a number of similar efforts from other states, and I have to say that this is the least coherent. It summarizes,
As has been often repeated, the State of Alaska is at the leading edge of impacts resulting from a warming climate. The Commission has recognized many negative and expensive effects of anticipated climate change. There are potential, positive eventualities, as well. The Commission’s concern over a reduction in federal spending implies an increased level of state spending may be in demand.
The report then scrupulously focuses on the positives, and stuffs the negatives to the back of each section. Unlike some states’ efforts, early actions identified by Governor Palin’s climate subcabinet focus exclusively on adaptation.
A mitigation working group is just getting started on a catalog of policies. The group’s first meeting notes contain a statement of purpose from commissioner Hartig:
The Governor appointed this committee because:
- No debate on climate change, it’s now
- Relatively small changes in atmosphere have significant effect on the environment.
- Warming will have effects on habitats
o Less sea ice
o More intense forest fires, more insects
o Change in distribution of species
o Appearance of new species.- Our world shares one atmosphere ’“ there’s no opting out
- We can build strategy from ground up, without unintended consequences
- We all must take responsibility
- The inventory shows the effects Alaska can have are unique and shows opportunities
- Emissions reductions may not be difficult and there could be many ancillary benefits
- If we fail to act there could be repercussions in the market
- State lead-by-example will be an important part of state government leadership
- Governor wants info and analysis of cap-and-trade, how it affects residents of Alaska
Among other things, I think Alaska’s efforts illustrate a common difficulty in climate policy: complex instruments like a cap & trade system require a major market design effort, which is hard for a state of 670,000 inhabitants to sustain. Small states either need to pursue simpler instruments (like a carbon tax) or pool their resources.
Near and dear to me is another state, small in population and big in resources. Montana has followed the CCS framework, preparing a GHG inventory and action plan. As elsewhere, there’s lots of detailed analysis, but not much evidence of models to glue it all together.
The appendices of the action plan cite:
- EPA’s WaRM model, for tracking and reporting GHG emissions from waste management practices.
- EPA’s MOBILE6 model, for GHG and other pollutant emissions from vehicles.
- Lifecycle analyses, including GREET, examining the implications of a transition to coal-to-liquids transport fuel (CTL) – particularly relevant given Montana’s huge coal reserves (120 gigatons) and synfuel aspirations. The basic message, nicely discussed by Brandt & Farrell, is that use of CTL and other low-grade petroleum resources could lead to significant recarbonization of energy use, even with CCS.
RGGI
I took a brief look at RGGI in the first installment. Now trading is about to launch, with an initial auction on September 25. Individuals can bid if they have an account on the allowance tracking system (felons need not apply though). New York DEC has a useful brief explanation of the market. Significantly, NY is auctioning nearly 100% of allowances. However, it’s also one of four states that didn’t get their act together in time for the initial auction.
RGGI futures are now trading on the CCX, barely above minimums because the market is overallocated, with allowances above historic levels through 2014. As of yesterday, CCFE RGGI futures for ’08 to ’12 settled at $4.48 to $5.01 on low volume. Evidently RGGI can retire allowances that fail to meet the auction reserve price, but changing underlying allocations could take up to three years.