Opiod Epidemic Dynamics

I ran across an interesting dynamic model of the opioid epidemic that makes a good target for replication and critique:

Prevention of Prescription Opioid Misuse and Projected Overdose Deaths in the United States

Qiushi Chen; Marc R. Larochelle; Davis T. Weaver; et al.

Importance  Deaths due to opioid overdose have tripled in the last decade. Efforts to curb this trend have focused on restricting the prescription opioid supply; however, the near-term effects of such efforts are unknown.

Objective  To project effects of interventions to lower prescription opioid misuse on opioid overdose deaths from 2016 to 2025.

Design, Setting, and Participants  This system dynamics (mathematical) model of the US opioid epidemic projected outcomes of simulated individuals who engage in nonmedical prescription or illicit opioid use from 2016 to 2025. The analysis was performed in 2018 by retrospectively calibrating the model from 2002 to 2015 data from the National Survey on Drug Use and Health and the Centers for Disease Control and Prevention.

Conclusions and Relevance  This study’s findings suggest that interventions targeting prescription opioid misuse such as prescription monitoring programs may have a modest effect, at best, on the number of opioid overdose deaths in the near future. Additional policy interventions are urgently needed to change the course of the epidemic.

The model is fully described in supplementary content, but unfortunately it’s implemented in R and described in Greek letters, so it can’t be run directly:

That’s actually OK with me, because I think I learn more from implementing the equations myself than I do if someone hands me a working model.

While R gives you access to tremendous tools, I think it’s not a good environment for designing and testing dynamic models of significant size. You can’t easily inspect everything that’s going on, and there’s no easy facility for interactive testing. So, I was curious whether that would prove problematic in this case, because the model is small.

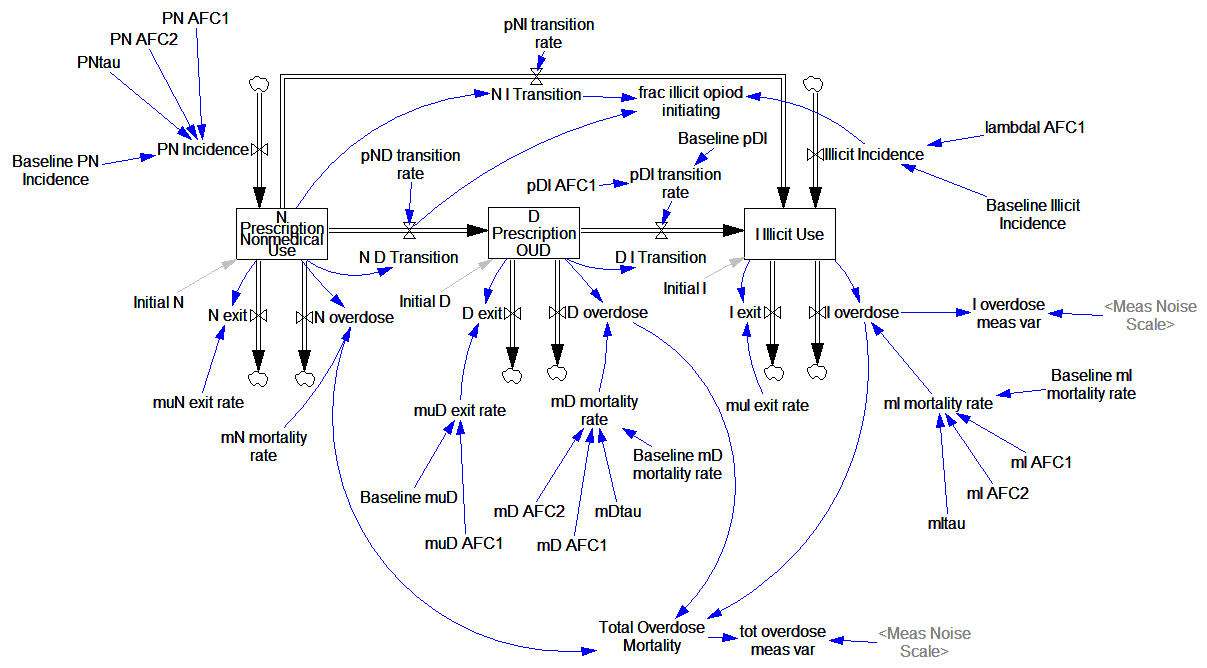
Here’s what it looks like, replicated in Vensim:

It looks complicated, but it’s not complex. It’s basically a cascade of first-order delay processes: the outflow from each stock is simply a fraction per time. There are no large-scale feedback loops. Continue reading “Opiod Epidemic Dynamics”

Modeling Investigations

538 had this cool visualization of the Russia investigation in the context of Watergate, Whitewater, and other historic investigations.

The original is fun to watch, but I found it hard to understand the time dynamics from the animation. For its maturity (660 days and counting), has the Russia investigation yielded more or fewer indictments than Watergate (1492 days total)? Are the indictments petering out, or accelerating?

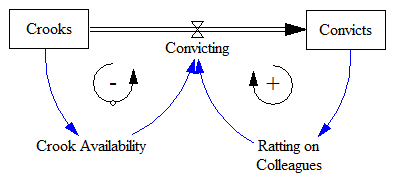
A simplified version of the problem looks a lot like an infection model (a.k.a. logistic growth or Bass diffusion):

So, the interesting question is whether we can – from partway through the history of the system – estimate the ultimate number of indictments and convictions it will yield. This is fraught with danger, especially when you have no independent information about the “physics” of the system, especially the population of potential crooks to be caught. Continue reading “Modeling Investigations”

Social network valuation with logistic models

This is a logistic growth model for Facebook’s user base, with a very simple financial projection attached. It’s inspired by:

Quis pendit ipsa pretia: facebook valuation and diagnostic of a bubble based on nonlinear demographic dynamics

Peter Cauwels, Didier Sornette

We present a novel methodology to determine the fundamental value of firms in the social-networking sector based on two ingredients: (i) revenues and profits are inherently linked to its user basis through a direct channel that has no equivalent in other sectors; (ii) the growth of the number of users can be calibrated with standard logistic growth models and allows for reliable extrapolations of the size of the business at long time horizons. We illustrate the methodology with a detailed analysis of facebook, one of the biggest of the social-media giants. There is a clear signature of a change of regime that occurred in 2010 on the growth of the number of users, from a pure exponential behavior (a paradigm for unlimited growth) to a logistic function with asymptotic plateau (a paradigm for growth in competition). We consider three different scenarios, a base case, a high growth and an extreme growth scenario. Using a discount factor of 5%, a profit margin of 29% and 3.5 USD of revenues per user per year yields a value of facebook of 15.3 billion USD in the base case scenario, 20.2 billion USD in the high growth scenario and 32.9 billion USD in the extreme growth scenario. According to our methodology, this would imply that facebook would need to increase its profit per user before the IPO by a factor of 3 to 6 in the base case scenario, 2.5 to 5 in the high growth scenario and 1.5 to 3 in the extreme growth scenario in order to meet the current, widespread, high expectations. …

(via the arXiv blog)

This is not an exact replication of the model (though you can plug in the parameters from C&S’ paper to replicate their results). I used slightly different estimation methods, a generalization of the logistic (for saturation exponent <> 1), and variable revenues and interest rates in the projections (also optional).

This is a good illustration of how calibration payoffs work. The payoff in this model is actually a policy payoff, because the weighted sum-squared-error is calculated explicitly in the model. That makes it possible to generate Monte Carlo samples and filter them by SSE, and also makes it easier to estimate the scale and variation in the standard error of user base reports.

The model is connected to input data in a spreadsheet. Most is drawn from the paper, but I updated users and revenues with the latest estimates I could find.

A command script replicates optimization runs that fit the model to data for various values of the user carrying capacity K.

Note that there are two views, one for users, and one for financial projections.

See my accompanying blog post for some reflections on the outcome.

This model requires Vensim DSS, Pro, or the Model Reader. facebook 3.vpm or facebook3.zip (The .zip is probably easier if you have DSS or Pro and want to work with the supplementary control files.)

Update: I’ve added another set of models for Groupon: groupon 1.vpmgroupon 2.vpm and groupon.zip groupon3.zip

See my latest blog post for details.


Theil Statistics

Source: Created by Rogelio Oliva, 1995; Updated by Tom Fiddaman, 2009 2011 – slight improvement to numerical robustness.

See Sterman, J. D. 1984. Appropriate Summary Statistics for Evaluating the Historical Fit of System Dynamics Models. Dynamica 10 (2): 51-66.

Units balance: Yes

Format: Vensim; requires an advanced version

Files:

D-4584 Theil Statistics documentation– D-memo documentation

Theil_2011.mdl – Theil Statistics model

Theil_2011.vpm – published binary version; includes data.vdf so it’ll run right out of the box

Dummy_data.mdl – dummy data generator creating input to Theil model

Sea Level Rise

Citations: Rahmstorf 2007, “A semi-empirical approach to projecting future sea level rise.” Science 315. Grinsted, Moore & Jevrejeva 2009. “Reconstructing sea level from paleo and projected temperatures 200 to 2100 AD.” Climate Dynamics [1]

Source: Replicated by Tom Fiddaman based on an earlier replication of Rahmstorf provided by John Sterman

Units balance: Yes

Format: Vensim; requires Model Reader or an advanced version

Notes: See discussion at metasd.

Files:

Grinsted_v3b‎ – first model; default calibration replicates Rahmstorf, and optimization is set up to adjust constant terms to fit Rahmstorf slope to data

Grinsted_v3c – second model; updated data and calibration, as in Part III

Grinsted_v3c-k2 – third model; set up for Kalman filtering, as in Part V