The energy economy consists of many tradeoffs. Some of these are captured in the IPAT framework:
Emissions
= Population x GDP per Capita x Energy per GDP x Emissions per Energy
IPAT shows that, to reduce emisisons, there are multiple points of intervention. One could, for example, promote lower energy intensity, or reduce the carbon intensity of energy, or both.
An ideal policy, or portfolio of policies, would:
- Cover all the bases – ensure that no major opportunity is left unaddressed.
- Balance the effort – an economist might express this as leveling the shadow prices across areas.
We have a lot of different ways to address each tradeoff: tradeable permits, taxes, subsidies, quantity standards, performance standards, command-and-control, voluntary limits, education, etc. So far, in the US, we have basically decided that taxes are a non-starter, and instead pursued subsidies and tax incentives, portfolio and performance standards, with limited use of tradeable permits.
Here’s the problem with that approach. You can decompose the economy a lot more than IPAT does, into thousands of decisions that have energy consequences. I’ve sampled a tiny fraction below.
Is there an incentive?
| Decision | Standards | Emissions Price |
| Should I move to the city or the suburbs? | No | Yes |
| Should I telecommute? | No | Yes |
| Drive, bike, bus or metro today? | No | Yes |
| Car, truck or SUV? | No (CAFE gets this wrong) | Yes |
| Big SUV or small SUV? | CAFE (again) | Yes |
| Gasoline, diesel, hybrid or electric? | ZEV, tax credits | Yes |
| Regular or biofuel? | LCFS, CAFE credits | Yes |
| Detached house or condo? | No | Yes |
| Big house or small? | No | Yes |
| Gas or heat pump? | No | Yes |
| High performance building envelope or granite countertops? | Building codes (lowest common denominator) | Yes |
| Incandescent or LED lighting? | Bulb Ban | Yes |
| LEDs are cheap – use more? | No | Yes |
| Get up to turn out an unused light? | No | Yes |
| Fridge: top freezer, bottom freezer or side by side? | No | Yes |
| Efficient appliances? | Energy Star (badly) | Yes |
| Solar panels? | Building codes, net metering, tax credits, cap & trade | Yes |
| Green electricity? | Portfolio standards | Yes |
| 2 kids or 8? | No | Yes |
The beauty of an emissions price – preferably charged at the minemouth and wellhead – is that it permeates every economic aspect of life. The extent to which it does so depends on the emissions intensity of the subject activity – when it’s high, there’s a strong price signal, and when it’s low, there’s a weak signal, leaving users free to decide on other criteria. But the signal is always there. Importantly, the signal can’t be cheated: you can fake your EPA mileage rating – for a while – but it’s hard to evade costs that arrive packaged with your inputs, be they fuel, capital, services or food.
The rules and standards we have, on the other hand, form a rather moth-eaten patchwork. They cover a few of the biggest energy decisions with policies like renewable portfolio standards for electricity. Some of those have been pretty successful at lowering emissions. But others, like CAFE and Energy Star, are deficient or perverse in a variety of ways. As a group, they leave out a number of decisions that are extremely consequential. Effort is by no means uniform – what is the marginal cost of a ton of carbon avoided by CAFE, relative to a state’s renewable energy portfolio? No one knows.
So, how is the patchwork working? Not too well, I’d say. Some, like the CAFE standard, have been diluted by loopholes and stalled due to lack of political will:
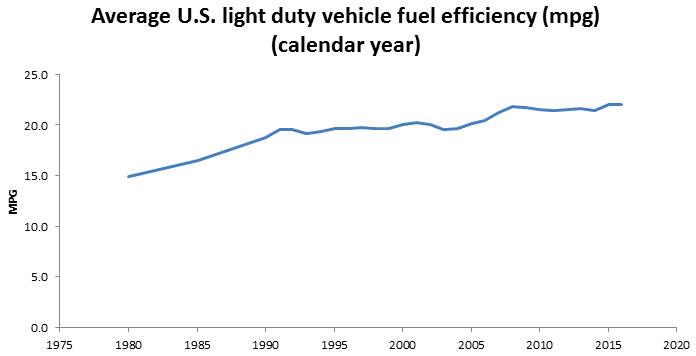 BTS
BTSOthers are making some local progress. The California LCFS, for example, has reduced carbon intensity of fuels 3.5% since authorization by AB32 in 2006:
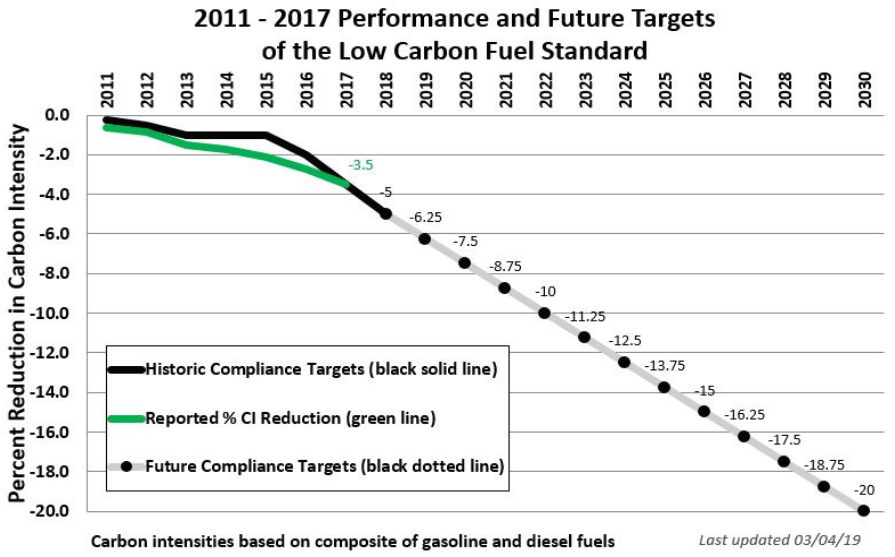 ARB
ARBBut the LCFS’ progress has been substantially undone by rising vehicle miles traveled (VMT). The only thing that put a real dent in driving was the financial crisis:
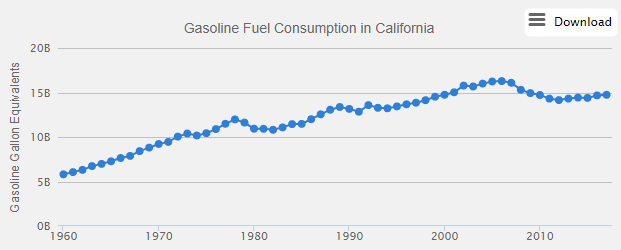 AFDC
AFDC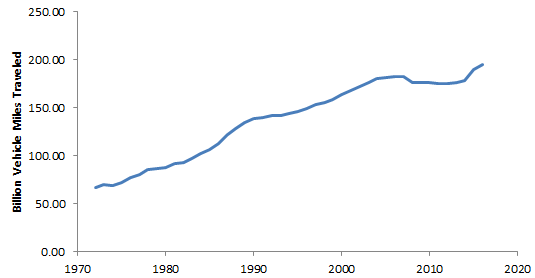 Caltrans
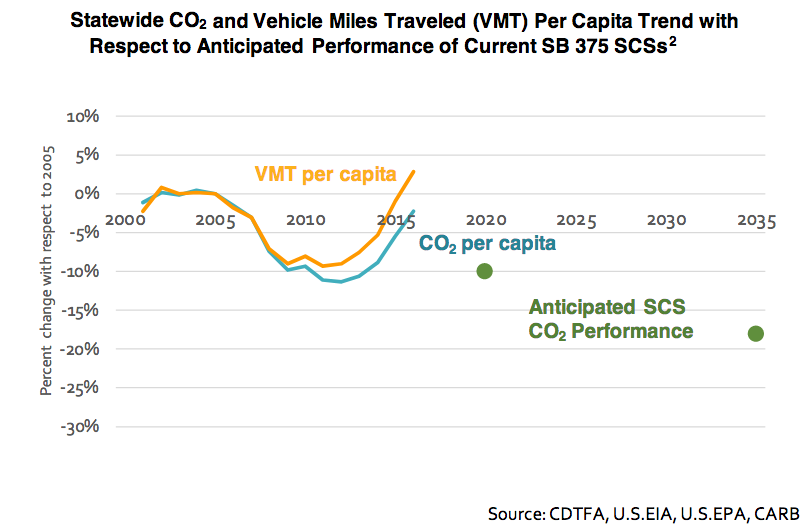
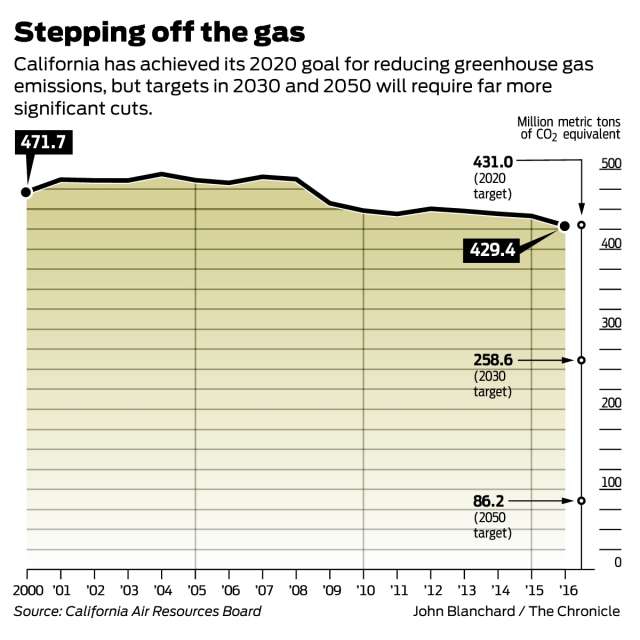
In spite of this, the California patchwork has worked – it has reached its GHG reduction target:
 SF Chronicle
This is almost entirely due to success in the electric power sector. Hopefully, there’s more to come, as renewables continue to ride down their learning curves. But how long can the power sector carry the full burden? Not long, I think.
The problem is that the electricity supply side is the “easy” part of the problem. There are relatively few technologies and actors to worry about. There’s a confluence of federal and state incentives. The technology landscape is favorable, with cost-effective emerging technologies.
The technology landscape for clean fuels is not easy. That’s why LCFS credits are trading at $195/ton while electricity cap & trade allowances are at $16/ton. The demand side has more flexibility, but it is technically diverse and organizationally fragmented (like the questions in my table above), making it harder to regulate. Problems are coupled: getting people out of their cars isn’t just a car problem; it’s a land use problem. Rebound effects abound: every LED light bulb is just begging to be left on all the time, because it’s so cheap to do so, and electricity subsidies make it even cheaper.
Command-and-control regulators face an unpleasant choice. They can push harder and harder in a few major areas, widening the performance gap – and the shadow price gap – between regulated and unregulated decisions. Or, they can proliferate regulations to cover more and more things, increasing administrative costs and making innovation harder.
As long as economic incentives scream that the price of carbon is zero, every performance standard, subsidy, or limit is fighting an uphill battle. People want to comply, but evolution selects for those who can figure out how to comply the least. Every idea that’s not covered by a standard faces a deep “valley of death” when it attempts to enter the market.
At present, we can’t let go of this patchwork of standards (wingwalker’s rule – don’t let go of one thing until you have hold of another). But in the long run, we need to start activating every possible tradeoff that improves emissions. That requires a uniform that pervades the economy. Then rules and standards can backfill the remaining market failures, resulting in a system of regulation that’s more effective and less intrusive.