Linear regression bathtub FAIL

I seldom run across an example of so many things that can go wrong with linear regression in one place, but one just crossed my reader.

A new paper examines the relationship between CO2 concentration and flooding in the US, and finds no significant impact:

Has the magnitude of floods across the USA changed with global CO2 levels?

R. M. Hirsch & K. R. Ryberg

Abstract

Statistical relationships between annual floods at 200 long-term (85–127 years of record) streamgauges in the coterminous United States and the global mean carbon dioxide concentration (GMCO2) record are explored. The streamgauge locations are limited to those with little or no regulation or urban development. The coterminous US is divided into four large regions and stationary bootstrapping is used to evaluate if the patterns of these statistical associations are significantly different from what would be expected under the null hypothesis that flood magnitudes are independent of GMCO2. In none of the four regions defined in this study is there strong statistical evidence for flood magnitudes increasing with increasing GMCO2. One region, the southwest, showed a statistically significant negative relationship between GMCO2 and flood magnitudes. The statistical methods applied compensate both for the inter-site correlation of flood magnitudes and the shorter-term (up to a few decades) serial correlation of floods.

There are several serious problems here.

First, it ignores bathtub dynamics. The authors describe causality from CO2 -> energy balance -> temperature & precipitation -> flooding. But they regress:

ln(peak streamflow) = beta0 + beta1 × global mean CO2 + error

That alone is a fatal gaffe, because temperature and precipitation depend on the integration of the global energy balance. Integration renders simple pattern matching of cause and effect invalid. For example, if A influences B, with B as the integral of A, and A grows linearly with time, B will grow quadratically with time. The situation is actually worse than that for climate, because the system is not first order; you need at least a second-order model to do a decent job of approximating the global dynamics, and much higher order models to even think about simulating regional effects. At the very least, the authors might have explored the usual approach of taking first differences to undo the integration, though it seems likely that the data are too noisy for this to reveal much.

Second, it ignores a lot of other influences. The global energy balance, temperature and precipitation are influenced by a lot of natural and anthropogenic forcings in addition to CO2. Aerosols are particularly problematic since they offset the warming effect of CO2 and influence cloud formation directly. Since data for total GHG loads (CO2eq), total forcing and temperature, which are more proximate in the causal chain to precipitation, are readily available, using CO2 alone seems like willful ignorance. The authors also discuss issues “downstream” in the causal chain, with difficult-to-assess changes due to human disturbance of watersheds; while these seem plausible (not my area), they are not a good argument for the use of CO2. The authors also test other factors by including oscillatory climate indices, the AMO, PDO and ENSO, but these don’t address the problem either.

Third, the hypothesis that streamflow depends on global mean CO2 is a strawman. Climate models don’t predict that the hydrologic cycle will accelerate uniformly everywhere. Rising global mean temperature and precipitation are merely aggregate indicators of a more complex regional fingerprint. If one wants to evaluate the hypothesis that CO2 affects streamflow, one ought to compare observed streamflow trends with something like the model-predicted spatial pattern of precipitation anomalies. Here’s North America in AR4 WG1 Fig. 11.12, with late-21st-century precipitation anomalies, for example:
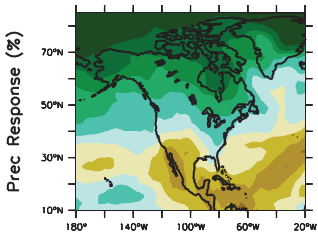
The pattern looks suspiciously like the paper’s spatial distribution of regression coefficients:
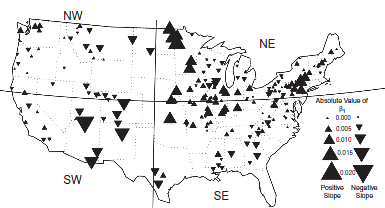
The eyeball correlation in itself doesn’t prove anything, but it’s suggestive that something has been missed.

Fourth, the treatment of nonlinearity and distributions is a bit fishy. The relationship between CO2 and forcing is logarithmic, which is captured in the regression equation, but I’m surprised that there aren’t other important nonlinearities or nonnormalities. Isn’t flooding heavy-tailed, for example? I’d like to see just a bit more physics in the model to handle such issues.

Fifth, I question the approach of estimating each watershed individually, then examining the distribution of results. The signal to noise ratio on any individual watershed is probably pretty horrible, so one ought to be able to do a lot better with some spatial pooling of the betas (which would also help with issue three above).

I think that it’s actually interesting to hold your nose and use linear regression as a simple screening tool, in spite of violated assumptions. If a relationship is strong, you may still find it. If you don’t find it, that may not tell you much, other than that you need better methods. The authors seem to hold to this philosophy in the conclusion, though it doesn’t come across that way in the abstract. Not everyone is as careful though; Roger Pielke Jr. picked up this paper and read it as,

Are US Floods Increasing? The Answer is Still No.

A new paper out today in the Hydrological Sciences Journal shows that flooding has not increased in the United States over records of 85 to 127 years. This adds to a pile of research that shows similar results around the world. This result is of course consistent with our work that shows that increasing damage related to weather extremes can be entirely explained by societal changes, such as more property in harm’s way. In fact, in the US flood damage has decreased dramatically as a fraction of GDP, which is exactly whet you get if GDP goes up and flooding does not.

Actually, the paper doesn’t even address whether floods are increasing or decreasing. It evaluates CO2 correlations, not temporal trends. To the extent that CO2 has increased monotonically, the regression will capture some trend in the betas on CO2, but it’s not the same thing.

Limits to bathtubs

Danger lurks in the bathtub – not just slips, falls, and Norman Bates, but also bad model formulations.

A while ago, after working with my kids to collect data on our bathtub, I wrote My bathtub is nonlinear.

We grabbed a sheet of graph paper, fat pens, a yardstick, and a stopwatch and headed for the bathtub. …

When the tub was full, we made a few guesses about how long it might take to empty, then started the clock and opened the drain. Every ten or twenty seconds, we’d stop the timer, take a depth reading, and plot the result on our graph. …

To my astonishment, the resulting plot showed a perfectly linear decline in water depth, all the way to zero (as best we could measure). In hindsight, it’s not all that strange, because the tub tapers at the bottom, so that a constant linear decline in the outflow rate corresponds with the declining volumetric flow rate you’d expect (from decreasing pressure at the outlet as the water gets shallower). Still, I find it rather amazing that the shape of the tub (and perhaps nonlinearity in the drain’s behavior) results in such a perfectly linear trajectory.

It turns out that my attribution of the linear time vs. depth profile was sloppy – the behavior has a little to do with tub shape, and a lot to do with nonlinearity in the draining behavior. In a nice brief from the SD conference, Pål Davidsen, Erling Moxnes, Mauricio Munera Sánchez and David Wheat explain why:

… in the 16th century the Italian scientist Evangelista Torricelli found the relationship between water height and outflow to be nonlinear.

… Torricelli may have reasoned as follows. Let a droplet of water fall frictionless outside the tank from the same height … as the surface of the water. Gravitation will make the droplet accelerate. As the droplet passes the bottom of the tank, its kinetic energy will equal the loss of potential energy … Reorganizing this equation Torricelli found the following nonlinear expression for speed as a function of height

v = SQRT(2*g*h)

Then Torricelli moved inside the tank and reasoned that the same must apply there. …

Assuming that the water tank is a cylinder with straight walls … The outflow is given by the square root of volume; it is not a linear function of volume.

– “A note on the bathtub analogy,” ISDC 2011; final proceedings aren’t online yet but presumably will be here eventually.

In hindsight, this ought to have been obvious to me, because bathtubs clearly don’t exhibit the heavy-right-tail behavior of a first order linear draining process. The difference matters:

The bathtub analogy has been used extensively to illustrate stock and flow relationships. Because this analogy is frequently used, System Dynamicists should be aware that the natural outflow of water from a bathtub is a nonlinear function of water volume. A questionnaire suggests that students with one year or more of System Dynamics training tend to assume a linear relationship when asked to model a water outflow driven by gravity. We present Torricelli’s law for the outflow and investigate the error caused by assuming linearity. We also construct an “inverted funnel” which does behave like a linear system. We conclude by pointing out that the nonlinearity is of no importance for the usefulness of bathtubs or funnels as analogies. On the other hand, simplified analogies could make modellers overconfident in linear formulations and not able to address critical remarks from physicists or other specialists.

I’ve been doing SD for over two decades, and have the physical science background to know better, but found it a little too easy to assume a linear bathtub as a mental model, without inquiring very deeply when confronted with disconfirming data. For me, this is a nice cautionary lesson, that we forget the roots of system dynamics in engineering at our own peril.

My implementation of the model is in my library.

A note on the bathtub analogy

Adapted from “A note on the bathtub analogy,” Pål Davidsen, Erling Moxnes, Mauricio Munera Sánchez, David Wheat, 2011 System Dynamics Conference.

Abstract

The bathtub analogy has been used extensively to illustrate stock and flow relationships. Because this analogy is frequently used, System Dynamicists should be aware that the natural outflow of water from a bathtub is a nonlinear function of water volume. A questionnaire suggests that students with one year or more of System Dynamics training tend to assume a linear relationship when asked to model a water outflow driven by gravity. We present Torricelli’s law for the outflow and investigate the error caused by assuming linearity. We also construct an “inverted funnel” which does behave like a linear system. We conclude by pointing out that the nonlinearity is of no importance for the usefulness of bathtubs or funnels as analogies. On the other hand, simplified analogies could make modellers overconfident in linear formulations and not able to address critical remarks from physicists or other specialists.

See my related blog post for details.

Units balance.

Runs in Vensim (any version): ToricelliBathtub.mdl ToricelliBathtub.vpm

Economists in the bathtub

Env-Econ is one of several econ sites to pick up on standupeconomist Yoram Bauman’s assessment, Grading Economics Textbooks on Climate Change.

Most point out the bad, but there’s also a lot of good. On Bauman’s curve, there are 4 As, 3 Bs, 5 Cs, 3 Ds, and one F. Still, the bad tends to be really bad. Bauman writes about one,

Overall, the book is not too bad if you ignore that it’s based on climate science that is almost 15 years out of date and that it has multiple errors that would make Wikipedia blush. The fact that this textbook has over 20 percent of the market shakes my faith in capitalism.

The interesting thing is that the worst textbooks go astray more on the science than on the economics. The worst cherry-pick outdated studies, distort the opinions of scientists, and toss in red herrings like “For Greenland, a warming climate is good economic news.”

I find the most egregious misrepresentation in Schiller’s The Economy Today (D+):

The earth’s climate is driven by solar radiation. The energy the sun absorbs must be balanced by outgoing radiation from the earth and the atmosphere. Scientists fear that a flow imbalance is developing. Of particular concern is a buildup of carbon dioxide (CO2) that might trap heat in the earth’s atmosphere, warming the planet. The natural release of CO2 dwarfs the emissions from human activities. But there’s a concern that the steady increase in man-made CO2 emissions—principally from burning fossil fuels like gasoline and coal—is tipping the balance….

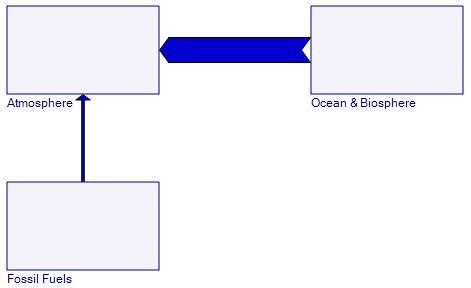
First, there’s no “might” about the fact that CO2 traps heat (infrared radiation); the only question is how much, when feedback effects come into play.  But the bigger issue is Schiller’s implication about the cause of atmospheric CO2 buildup. Here’s a picture of Schiller’s words, with arrow width scaled roughly to actual fluxes:

CO2flows1

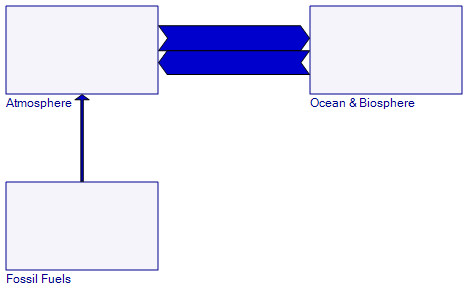
Apparently, nature is at fault for increasing atmospheric CO2. This is like worrying that the world will run out of air, because people are inhaling it all (Schiller may be inhaling something else). The reality is that the natural flux, while large, is a two way flow:

CO2flows2

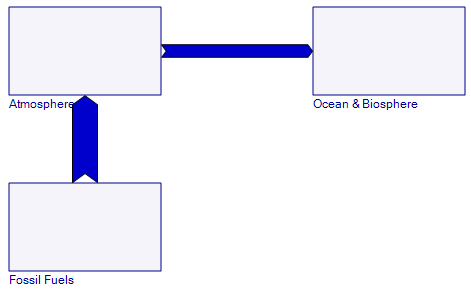
What goes into the ocean and biosphere generally comes out again. For the last hundred centuries, those flows were nearly equal (i.e. zero net flow). But now that humans are emitting a lot of carbon, the net flow is actually from the atmosphere into natural systems, like this:

CO2flows3

That’s quite a different situation. If an author can’t paint an accurate verbal picture of a simple stock-flow system like this, how can a text help students learn to manage resources, money or other stocks?

Other bathtubs – capital

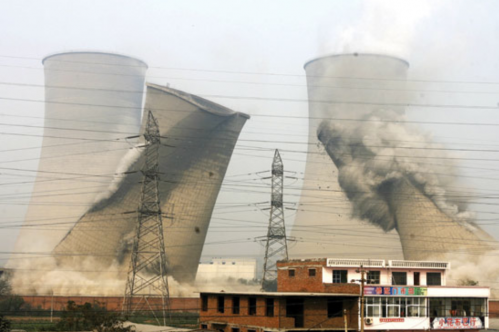
China is rapidly eliminating old coal generating capacity, according to Technology Review.

Draining Bathtub

Coal still meets 70 percent of China’s energy needs, but the country claims to have shut down 60 gigawatts’ worth of inefficient coal-fired plants since 2005. Among them is the one shown above, which was demolished in Henan province last year. China is also poised to take the lead in deploying carbon capture and storage (CCS) technology on a large scale. The gasifiers that China uses to turn coal into chemicals and fuel emit a pure stream of carbon dioxide that is cheap to capture, providing “an excellent opportunity to move CCS forward globally,” says Sarah Forbes of the World Resources Institute in Washington, DC.

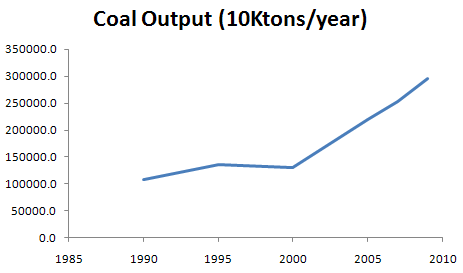
That’s laudable. However, the inflow of new coal capacity must be even greater. Here’s the latest on China’s coal output:

ChinaCoalOutput

China Statistical Yearbook 2009 & 2009 main statistical data update

That’s just a hair short of 3 billion tons in 2009, with 8%/yr growth from ’07-’09, in spite of the recession. On a per capita basis, US output and consumption is still higher, but at those staggering growth rates, it won’t take China long to catch up.

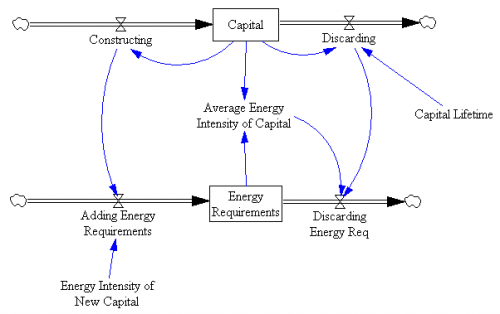
A simple model of capital turnover involves two parallel bathtubs, a “coflow” in SD lingo:

CapitalTurnover

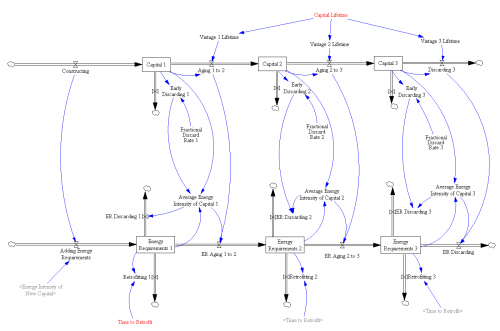
Every time you build some capital, you also commit to the energy needed to run it (unless you don’t run it, in which case why build it?). If you get fancy, you can consider 3rd order vintaging and retrofits, as here:

Capital Turnover 3o

To get fancier still, see the structure in John Sterman’s thesis, which provides for limited retrofit potential (that Gremlin just isn’t going to be a Prius, no matter what you do to the carburetor).

The basic challenge is that, while it helps to retire old dirty capital quickly (increasing the outflow from the energy requirements bathtub), energy requirements will go up as long as the inflow of new requirements is larger, which is likely when capital itself is growing and the energy intensity of new capital is well above zero. In addition, when capital is growing rapidly, there just isn’t much old stuff around (proportionally) to throw away, because the age structure of capital will be biased toward new vintages.

Hat tip: Travis Franck

Aerosols and the Climate Bathtub

From RealClimate:

Over the mid-20th century, sulfate precursor emissions appear to have been so large that they more then compensated for greenhouse gases, leading to a slight cooling in the Northern Hemisphere. During the last 3 decades, the reduction in sulfate has reversed that cooling, and allowed the effects of greenhouse gases to clearly show. In addition, black carbon aerosols lead to warming, and these have increased during the last 3 decades.

For an analogy, picture a reservoir. Say that around the 1930s, rainfall into the watershed supplying the reservoir began to increase. However, around the same time, a leak developed in the dam. The lake level stayed fairly constant as the rainfall increased at about the same rate the leak grew over the next few decades. Finally, the leak was patched (in the early 70s). Over the next few decades, the lake level increased rapidly. Now, what’s the cause of that increase? Is it fair to say that lake level went up because the leak was fixed? Remember that if the rainfall hadn’t been steadily increasing, then the leak would have led to a drop in lake levels whereas fixing it would have brought the levels back to normal. However, it’s also incomplete to ignore the leak, because then it seems puzzling that the lake levels were flat despite the increased rain during the first few decades and that, were you to compare the increased rain with the lake level rise, you’d find the rise was more rapid during the past three decades than you could explain by the rain changes during that period. You need both factors to understand what happened, as you need both greenhouse gases and aerosols to explain the surface temperature observations (and the situation is more complex than this simple analogy due to the presence of both cooling and warming types of aerosols).

Read the rest: Yet More Aerosols

The Acid Bathtub

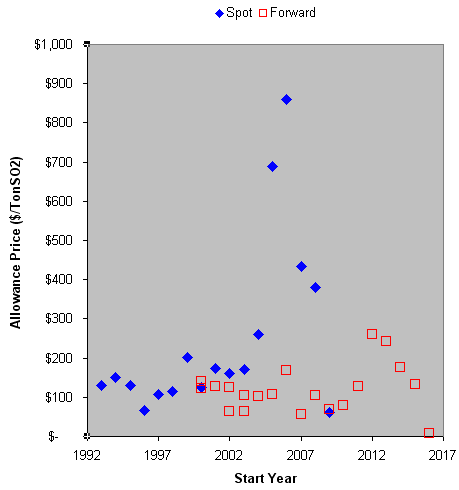
I noticed a few news items on the SO2 allowance market today, following up on the latest auction. Here’s the auction history:

SO2 allowance auction prices

The spot permit price has collapsed, from a high of $860/ton in the 2006 compliance stampede, to $62. That’s not surprising, given the economic situation. What is a little surprising is that the forward price (allowances for use starting in seven years) fell to $6.63 – a tenth of the previous low, spot or forward. What’s going on there? Do plants expect a seven-year recession? Are utilities hoarding cash? Do they expect the whole market to unravel, or to become irrelevant as climate policy imposes a more tightly-binding constraint?

Continue reading “The Acid Bathtub”

Climate War Game – Is 2050 Temperature Locked In?

This slide became known as “the Angry Red Future” at the war game:
The Angry Red Future

Source: ORNL & Pew via Nature In the Field

After seeing the presentation around it, Eli Kintisch of Science asked me whether it was realistic to assume that 2050 climate is already locked in. (Keep in mind that we were living in 2015.) I guessed yes, then quickly ran a few simulations to verify. Then I lost my train of thought and lost track of Eli. So, for what it’s still worth, here’s the answer.

Continue reading “Climate War Game – Is 2050 Temperature Locked In?”