The Chartjunk Pandemic

So much junk, so little time.

The ‘net is awash with questionable coronavirus memes. The most egregiously flawed offender I’ve seen is this one from visualcapitalist:

It’s interesting data, but the visualization really fails to put COVID19 in a proper perspective.


Exponential Growth

The biggest problem is obvious: the bottom of the curve is nothing like the peak for a quantity that grows exponentially.

Comparing the current death toll from COVID19, a few months old, to the final values from other epidemics over years to decades, is just spectacularly misleading. It beggars belief that anyone could produce such a comparison.

Perspective

Speaking of perspective, charts like this are rarely a good idea. This one gives the impression that 5M < 3M:

Reliance on our brains to map 2D to 3D is even more problematic when you consider the next problem.

2D or 3D?

Measuring the fur-blob sizes shows that the mapping of the data to the blobs is two-dimensional: the area of the blob on the page represents the magnitude. But the blobs are clearly rendered in 3D. That means the visual impression of the relationship between the Black Death (200M) and Japanese Smallpox (1M) is off by a factor of 15. The distortion is even more spectacular for COVID19.

You either have to go all the way with 3D, in which case COVID19 looks bigger, even with the other distortions unaddressed, or you need to make a less-sexy but more-informative flat 2D chart.

Stocks vs. Flows

The fourth problem here is that the chart neglects time. The disruption from an epidemic is not simply a matter of its cumulative death toll. The time distribution also matters: a large impact concentrated in a brief time frame has much greater ripple effects, as we are now experiencing.

Open Letter on Coronavirus

For all friends in the Bozone … this is letter I sent to a community list earlier today:

I appreciate the timely information from Chris Mehl. I’d like to emphasize a few points. I’m largely drawing on my thinking from an epidemic model that I posted here a few days ago, https://youtu.be/mxUsBI0Wr2M

It’s unfortunate that we now have our first confirmed COVID19 case, but we knew it was coming. One case likely means several more exposed asymptomatic are already here. Things could develop quickly: Italy went from 3 cases to 3858 in two weeks, although some of that is illusory due to the expansion of testing. However, that is not necessarily our fate – we may be luckier, and we definitely can change some things.

Two key points about this disease:
– The Covid-19 virus is transmissible before people become symptomatic. We therefore cannot wait to take action until there are confirmed or presumptive cases, or even people who have potentially been exposed, in our social networks, faith groups, communities, workplace, towns, or cities.
– This is not just about us individually. The disease disproportionately attacks older people, and people with compromised immune systems. The life you save through personal behavior may be your grandmother’s.

The response has a lot of moving parts.
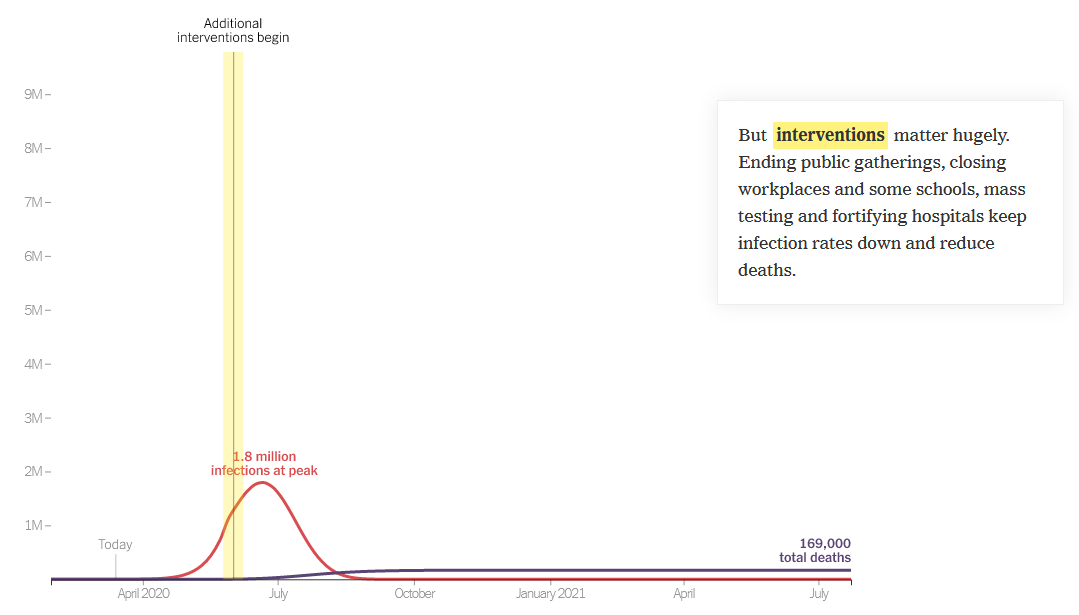
1. The end of the line is treatment for the severely ill. The flu peak is typically 5-6% of ER admissions in Montana, so something just as widespread and 10x more serious is an obvious threat. It’s critical to avoid overwhelming (and infecting) our precious and limited health care workers, because if we don’t, fatality rates go up, as happened in Italy and Wuhan.
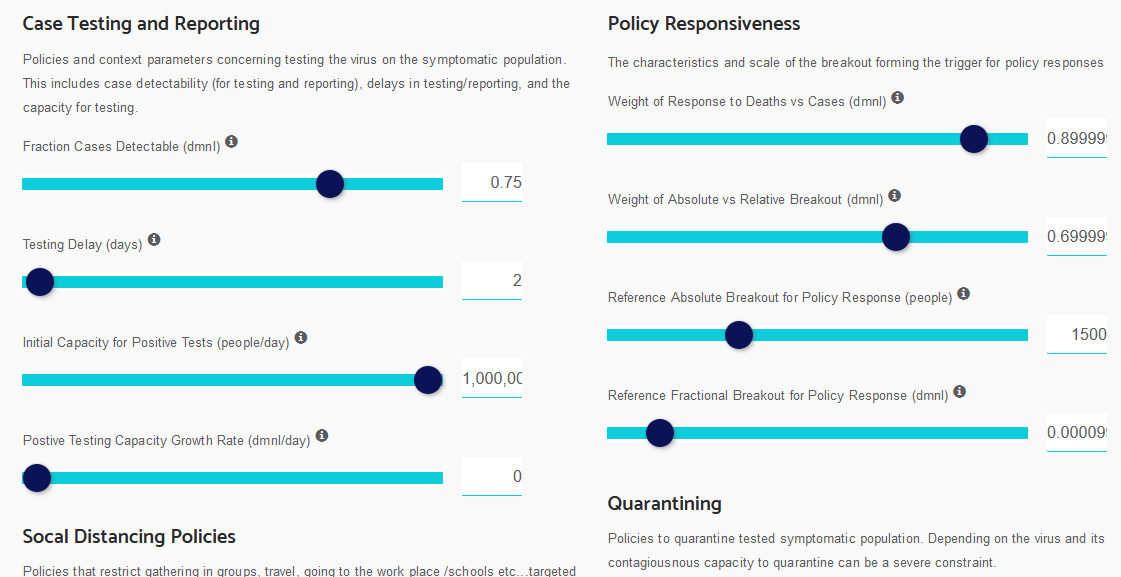
2. We can reduce contacts with the infected through monitoring, quarantine and isolation. This is the public health bailiwick, but I would expect that a large caseload could overwhelm them as well. I hope they’ll reach out to the community for help if needed. Independent of that, perhaps we can make it easy on people who are self-isolating, by organizing delivery of essential services? For employers, I hope that generous sick leave is a matter of enlightened self-interest: do you want 1 employee out for a week, or all of them out two weeks later?
We have two options that scale up well:
3. We can reduce the risk of each social contact by avoiding proximity and touching (elbow bumps instead of handshakes) and cleaning everything – handwashing, hard surfaces, etc. Lots of good info out there on this. (Sadly, hoarding sanitizers doesn’t contribute.)
4. Finally, we can reduce the number of contacts per person, aka social distancing. Cancelling nonessential group events, or moving them online, is very influential. One Biogen company meeting spawned 100 infections in Boston. The Atlantic has a nice discussion of the nuances: https://www.theatlantic.com/…/coronavirus-what-does…/607927/
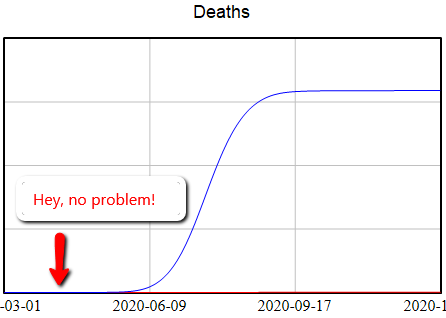
If half the infected are isolated, and we have half as many contacts, and those contacts are made 50% safer, then we’ve reduced the transmission of infection by 87.5%. That’s enough to slow the infection rate to less than the recovery rate, so the disease will die out.

If we do that, we’re not quite out of the woods. Social distancing is going to be hard to sustain. But if you stop to soon, the disease comes back. So we’ll need a plan for transitioning from more disruptive social distancing measures to things we can sustain.

When we have to close schools, which I think is likely, we will need to find ways to provide good nutrition and safe spaces for kids, without risk of infection. We can help.

Social distancing is also disruptive to the economy. Our tourism industry and performing arts, and surely other sectors I haven’t thought of, are going to have a rough time. We need to mitigate that.

It’s hard on our social fabric, so things like the Renewal Network’s recent links are important. We need to figure out how to support, comfort and play interact with each other … six feet apart, like the Italians singing from their balconies in the darkness of locked-down Siena.

Fortunately, some bad outcomes are very unlikely. There’s no reason for the food system to break down, for example. Inventories are large and the working-age population won’t have high mortality. So keeping a decent stock of food in case you’re sick is prudent, but panic buying of massive quantities is unproductive. This is not the zombie apocalypse.

There is a Cassandra’s curse here. If we succeed, the worst-case scenarios won’t come true, and some will accuse us of overreacting. That takes courage.

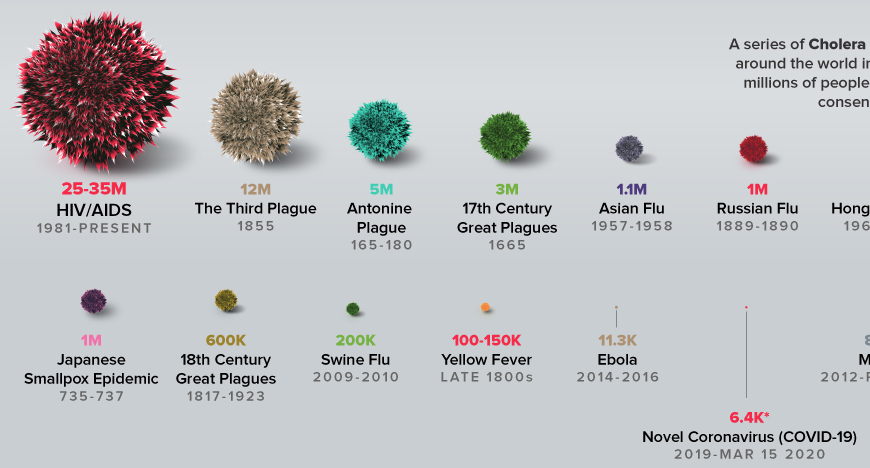
Finally, a personal note. David Brooks had a gloomy piece in the New York Times a day or two back, detailing social breakdown during historic plagues. I think that is not our fate. We have new tools at our disposal, i.e. the internet, that did not exist in previous pandemics. Incredibly, I know – by just one hop on social media – people involved in several of the defining events of this epidemic, including the Siena singers. W now have a powerful and non-infectious way for us to stay coordinated; we just have to be sure that we find ways to reach out to people who are not so digitally connected.

There’s a huge trove of digital resources here:
https://coronavirustechhandbook.com/

Tom Continue reading “Open Letter on Coronavirus”

Vensim SIR modeling primer

I’ve added an SIR modeling primer video to the Vensim coronavirus page, where you can download the models and the software.

This illustrates most of the foundations of the community coronavirus model. Feel free to adapt any of these tools for education or other purposes (but please respect the free Vensim PLE educational license and buy a paid copy if you’re doing commercial work).


More Interactive Coronavirus Models

Jeroen Struben has a nice interactive web simulation running online at Forio. It’s multiregion, with diffusion of infection across borders, and includes some of the interesting structures I excluded from my simple model, including explicit quarantine and vaccination, and testing and reporting lags.

The NYT has a very simple interactive simulation embedded in:

How Much Worse the
Coronavirus Could Get, in Charts

As always, I’m eager to know of more – please comment!

Dynamics of Hoarding

“I’m not hoarding, I’m just stocking up before the hoarders get here.”
Behavioral causes of phantom ordering in supply chains
John D. Sterman
Gokhan Dogan

When suppliers are unable to fill orders, delivery delays increase and customers receive less than they desire. Customers often respond by seeking larger safety stocks (hoarding) and by ordering more than they need to meet demand (phantom ordering). Such actions cause still longer delivery times, creating positive feedbacks that intensify scarcity and destabilize supply chains. Hoarding and phantom ordering can be rational when customers compete for limited supply in the presence of uncertainty or capacity constraints. But they may also be behavioral and emotional responses to scarcity. To address this question we extend Croson et al.’s (2014) experimental study with the Beer Distribution Game. Hoarding and phantom ordering are never rational in the experiment because there is no horizontal competition, randomness, or capacity constraint; further, customer demand is constant and participants have common knowledge of that fact. Nevertheless 22% of participants place orders more than 25 times greater than the known, constant demand. We generalize the ordering heuristic used in prior research to include the possibility of endogenous hoarding and phantom ordering. Estimation results strongly support the hypothesis, with hoarding and phantom ordering particularly strong for the outliers who placed extremely large orders. We discuss psychiatric and neuroanatomical evidence showing that environmental stressors can trigger the impulse to hoard, overwhelming rational decision‐making. We speculate that stressors such as large orders, backlogs or late deliveries trigger hoarding and phantom ordering for some participants even though these behaviors are irrational. We discuss implications for supply chain design and behavioral operations research.

A Community Coronavirus Model for Bozeman

This video explores a simple epidemic model for a community confronting coronavirus.

I built this to reflect my hometown, Bozeman MT and surrounding Gallatin County, with a population of 100,000 and no reported cases – yet. It shows the importance of an early, robust, multi-pronged approach to reducing infections. Because it’s simple, it can easily be adapted for other locations.

You can run the model using Vensim PLE or the Model Reader (or any higher version). Our getting started and running models videos provide a quick introduction to the software.

The model, in .mdl and .vpmx formats for any Vensim version:

community corona 7.zip

Update 3/12: community corona 8-mdl+vpmx.zip

There’s another copy at https://vensim.com/coronavirus/ along with links to the software.

Coronavirus – Really Simple Math

Why border control has limits, and mild cases don’t matter.

At the top, the US coronavirus response seems to be operating with (at least) two misperceptions. First, that border control works. Second, that a lower fatality rate means fewer deaths. Here’s how it really works.

Consider an extremely simplified SEIRD model. This is a generalization of the simple SIR framework to include asymptomatic, non-infective Exposed people and the Deceased:

The parameters are such that the disease takes about a week to incubate, and about a week to resolve. The transmission rate is such that cases double about once a week, if left uncontrolled.

Those fortuitous time constants make it really simple to model the spread in discrete time. First, abstract away the susceptible (who are abundant early in the epidemic) and the resolved cases (which are few and don’t participate further):

In this dirt-simple model,

  • This week’s infected will all resolve
  • This week’s exposed will advance to become next week’s infected
  • Next week’s exposed are the ones the current infected are infecting now.

If the disease is doubling weekly, then for every 1 infected person there must be 2 exposed people in the pipeline. And each of those infected people must expose 4 others. (Note that this is seemingly an R0 of 4, which is higher than what’s usually quoted, but the difference is partly due to discrete vs. continuous compounding. The R0 of 2.2 that’s currently common seems too low to fit the data though – more on that another time.)

What does this imply for control strategy? It means that, on the day you close the border, the infected arrivals you’ve captured and isolated understate the true problem. For every infected person, there are two exposed people on the loose, initiating domestic community spread. Because it’s doubling weekly, community infections very quickly replace the imports, even if a travel ban is 100% effective.

Mild Cases

Now consider the claim that the fatality rate is much lower than reported, because there are many unobserved mild cases:

In other words, the reported fatality rate is Deceased/(Recovered+Deceased), but the “real” fatality rate is Deceased/(Recovered+Deceased+Mild Recovered). That’s great, but where did all those mild cases come from? If they are sufficiently numerous to dilute the fatality rate by, say, a factor of 10, then there must also be 9 people with mild infections going undetected for every known infected case. That doesn’t help the prognosis for deaths a bit, because (one tenth the fatality rate) x (ten times the cases) yields the same outcome. Actually, this makes the border control and community containment problem much harder, because there are now 10x as many contacts to trace and isolate. Fortunately this appears to be pure speculation.

Coronavirus Containment Reference Mode

I ran across this twitter thread this morning, describing how a focus on border security and containment of existing cases has failed to prevent the takeoff of coronavirus.

Here’s the data on US confirmed cases that goes with it:

US confirmed coronavirus cases, as of 3/2/2019. Source: Johns Hopkins CSSE dashboard, https://gisanddata.maps.arcgis.com/apps/opsdashboard/index.html#/bda7594740fd40299423467b48e9ecf6

It’s easy to see how this behavior could lure managers into a self-confirming attributions trap. After a surge of imports, they close the borders. Cases flatten. Problem solved. Why go looking for trouble?

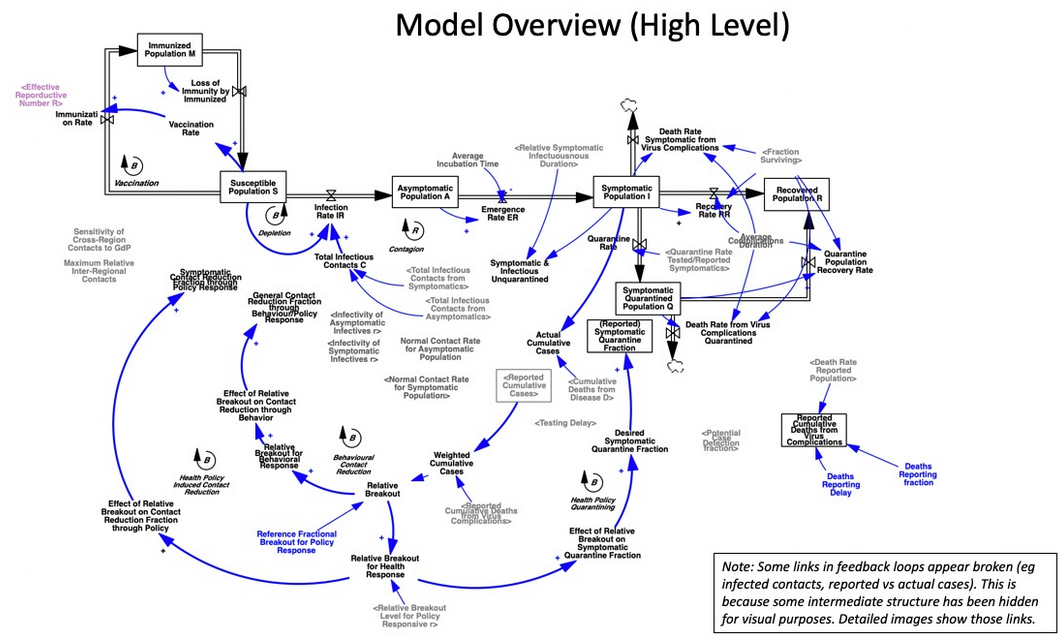
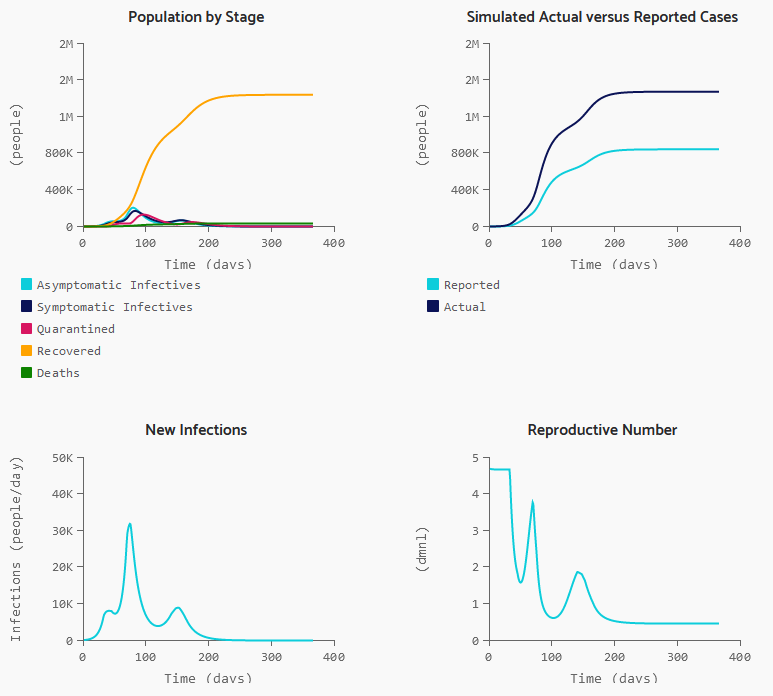
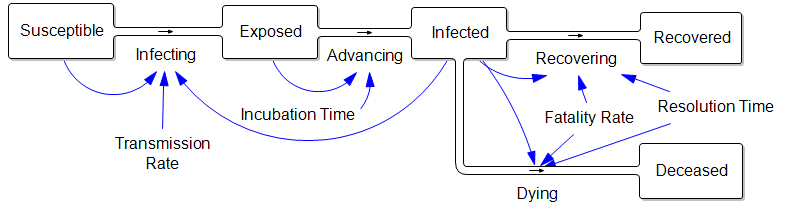
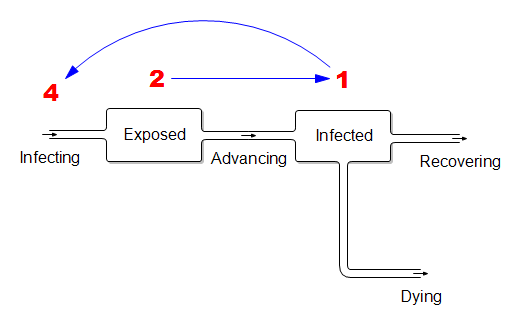
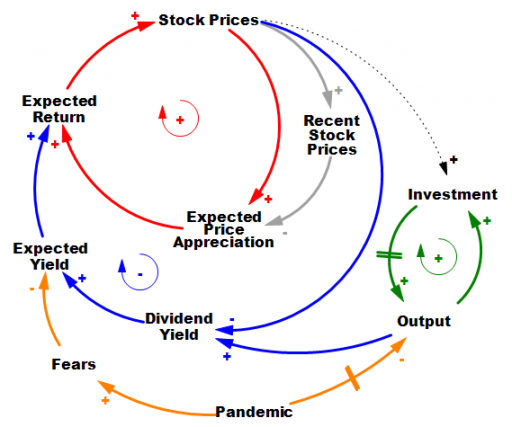
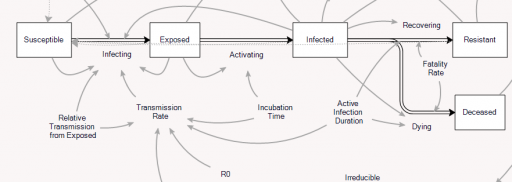
The problem is that containment alone doesn’t work, because the structure of the system defeats it. You can’t intercept every infected person, because some are exposed but not yet symptomatic, or have mild cases. As soon as a few of these people slip into the wild, the positive loops that drive infection operate as they always have. Once the virus is in the wild, it’s essential to change behavior enough to lower its reproduction below replacement.

Stock markets and coronavirus – an endogenous perspective

Markets collapse when they’re in a vulnerable state. Coronavirus might be the straw that broke the camel’s back – this time – but there’s no clear pandemic to stock price causality.

The predominant explanation for this week’s steep decline in the stock market is coronavirus. I take this as evidence that the pandemic of open-loop, event-based thinking is as strong as ever.

First, let’s look at some data. Here’s interest in coronavirus:

It was already pretty high at the end of January. Why didn’t the market collapse then? (In fact, it rose a little over February). Is there a magic threshold of disease, beyond which markets collapse?

How about other pandemics? Interest in pandemics was apparently higher in 2009, with the H1N1 outbreak:

Did the market collapse then? No. In fact, that was the start of the long climb out of the 2007 financial crisis. The same was true for SARS, in spring 2003, in the aftermath of the dotcom bust.

There are also lots of examples of market crashes, like 1987, that aren’t associated with pandemic fears at all. Corrections of this magnitude are actually fairly common (especially if you consider the percentage drop, not the inflated absolute drop):

Wilshire Associates, Wilshire 5000 Full Cap Price Index [WILL5000PRFC], retrieved from FRED, Federal Reserve Bank of St. Louis; https://fred.stlouisfed.org/series/WILL5000PRFC, February 28, 2020.
So clearly a pandemic is neither necessary nor sufficient for a market correction to occur.

I submit that the current attribution of the decline to coronavirus is primarily superstitious, and that the market is doing what it always does.

It’s hard to do it justice briefly, but the stock market is basically an overlay of a complicated allocation mechanism on top of the real economy. In the real economy (green positive loop) capital and technology accumulation increase output (thinking strictly of on-market effects). Growth in that loop proceeds steadily in the long run, but with bumps from business cycles. The stock market is sending signals to the real economy about how to invest, but that’s complicated, hence the dashed line.

In the stock market, prices reflect expectations about the future flow of dividends from the economy (blue negative loop). If that were the whole story, coronavirus (orange) would have to have induced fears of a drop in the NPV of future profits of about 10%. Hopefully that’s way outside any plausible scenario. So why the big drop? It’s due to the other half of the story. Expectations are formed partly on fundamentals, and partly on the expectation that the market will go up, because it’s been going up (red positive loop).

There are actually a number of mechanisms behind this: naive extrapolation, sophisticated exploitation of the greater fool, redirection of media attention to prognosticators of growth when they’re right, and so on. The specifics aren’t important; what matters is that they create a destabilizing reinforcing feedback loop that inflates bubbles. Then, when some shock sufficient to overcome the expectations of appreciation arrives, the red loop runs the other way, as a vicious cycle. Diminished expected returns spark selling, lowering prices, and further diminishing expectations of appreciation. If things get bad enough, liquidity problems and feedback to the real economy accentuate the problem, as in 1929.

Importantly, this structure makes the response of the market to bad news nonlinear and state-dependent. When SARS and H1N1 arrived, the market was already bottomed out. At such a point, the red loop is weak, because there’s not much speculative activity or enthusiasm. The fact that this pandemic is having a large impact, even while it’s still hypothetical, suggests that market expectations were already in a fragile state. If SARS-Cov-2 hadn’t come along to pop the bubble, some other sharp object would have done it soon: a bank bust, a crop failure, or maybe just a bad hot dog for an influential trader.

Coronavirus may indeed be the proximate cause of this week’s decline, in the same sense as the straw that broke the camel’s back. However, the magnitude of the decline is indicative of the fragility of the market state when the shock came along, and not necessarily of the magnitude of the shock itself. The root cause of the decline is that the structure of markets is prone to abrupt losses.

For a nice exploration of these dynamics, from the complexity/nonlinear dynamics thread of systems science, see Didier Sornette’s Why Stock Markets Crash: Critical Events in Complex Financial Systems.