A great discussion of risk, growth, the utility of panic, and the folly of naive empiricism:
h/t Tim in the comments!
The NECSI coronavirus page has the Jan 26 paper referenced.

Don't just do something, stand there! Reflections on the counterintuitive behavior of complex systems, seen through the eyes of System Dynamics, Systems Thinking and simulation.
A great discussion of risk, growth, the utility of panic, and the folly of naive empiricism:
h/t Tim in the comments!
The NECSI coronavirus page has the Jan 26 paper referenced.
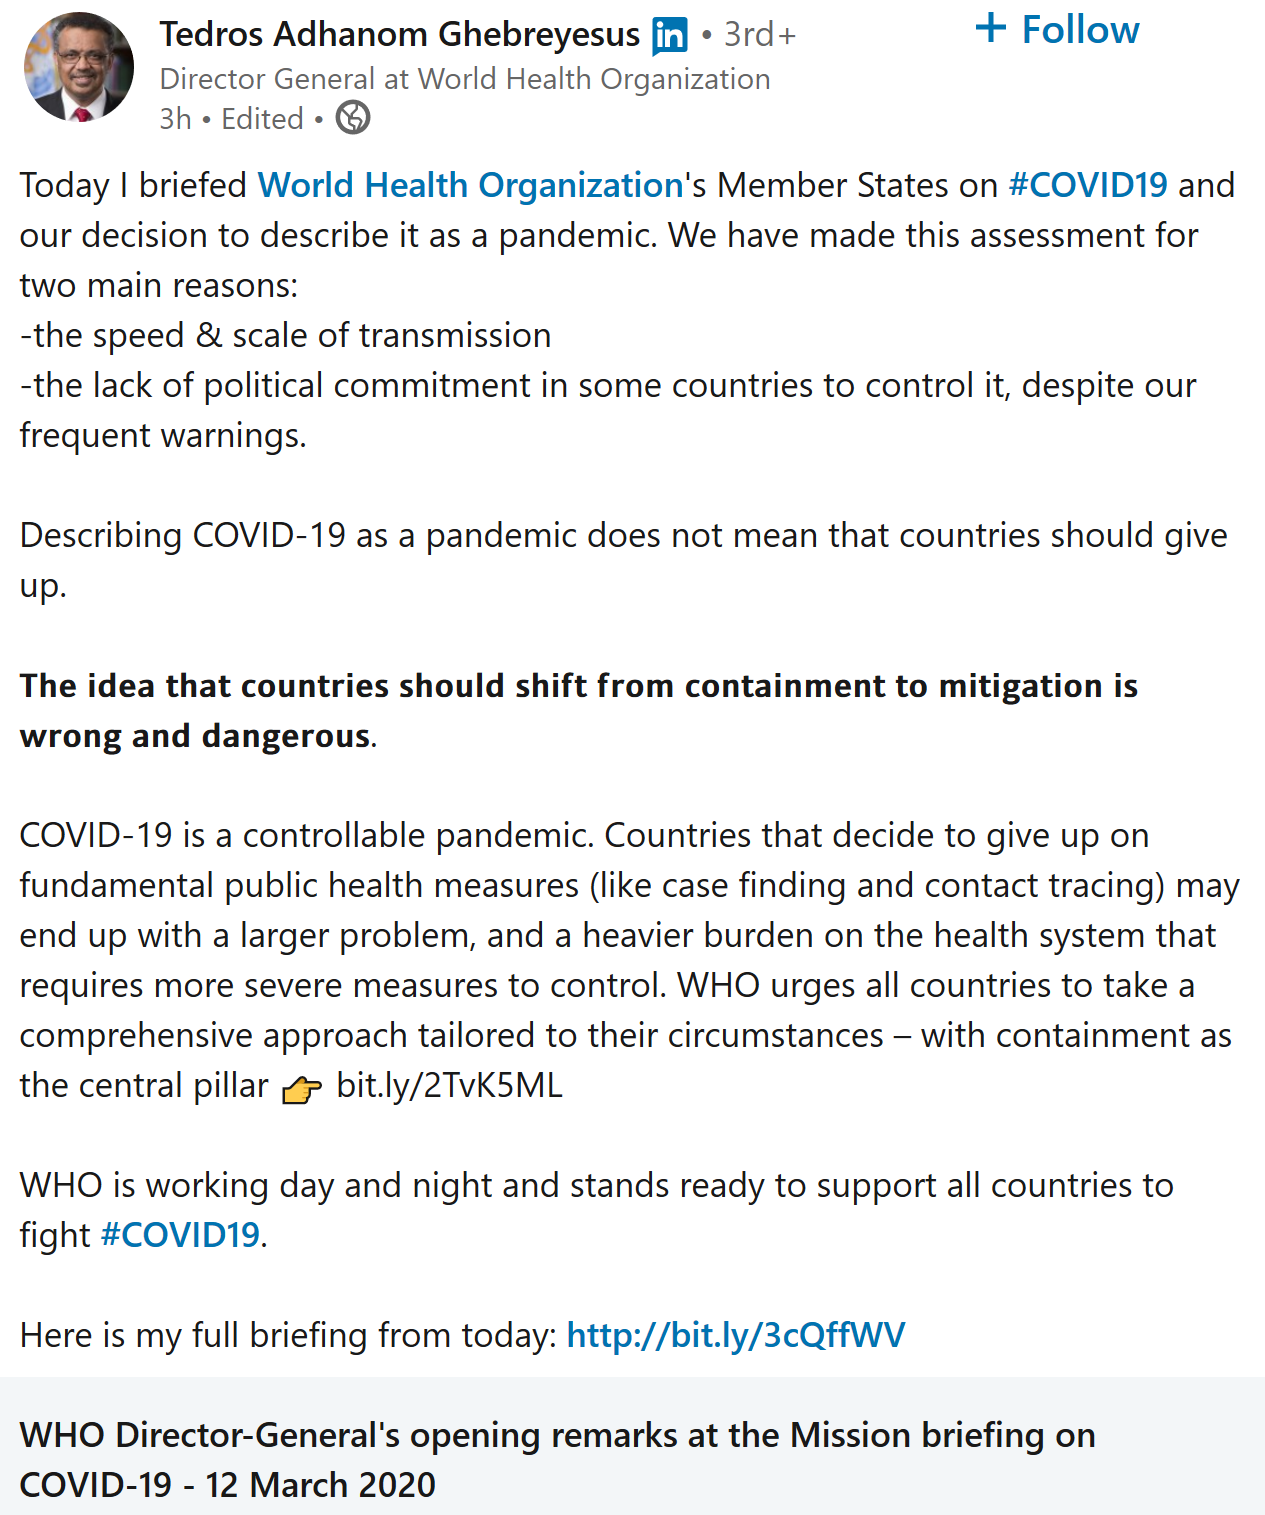
ECDC and WHO debate weighty policy questions of the day … containment or mitigation?
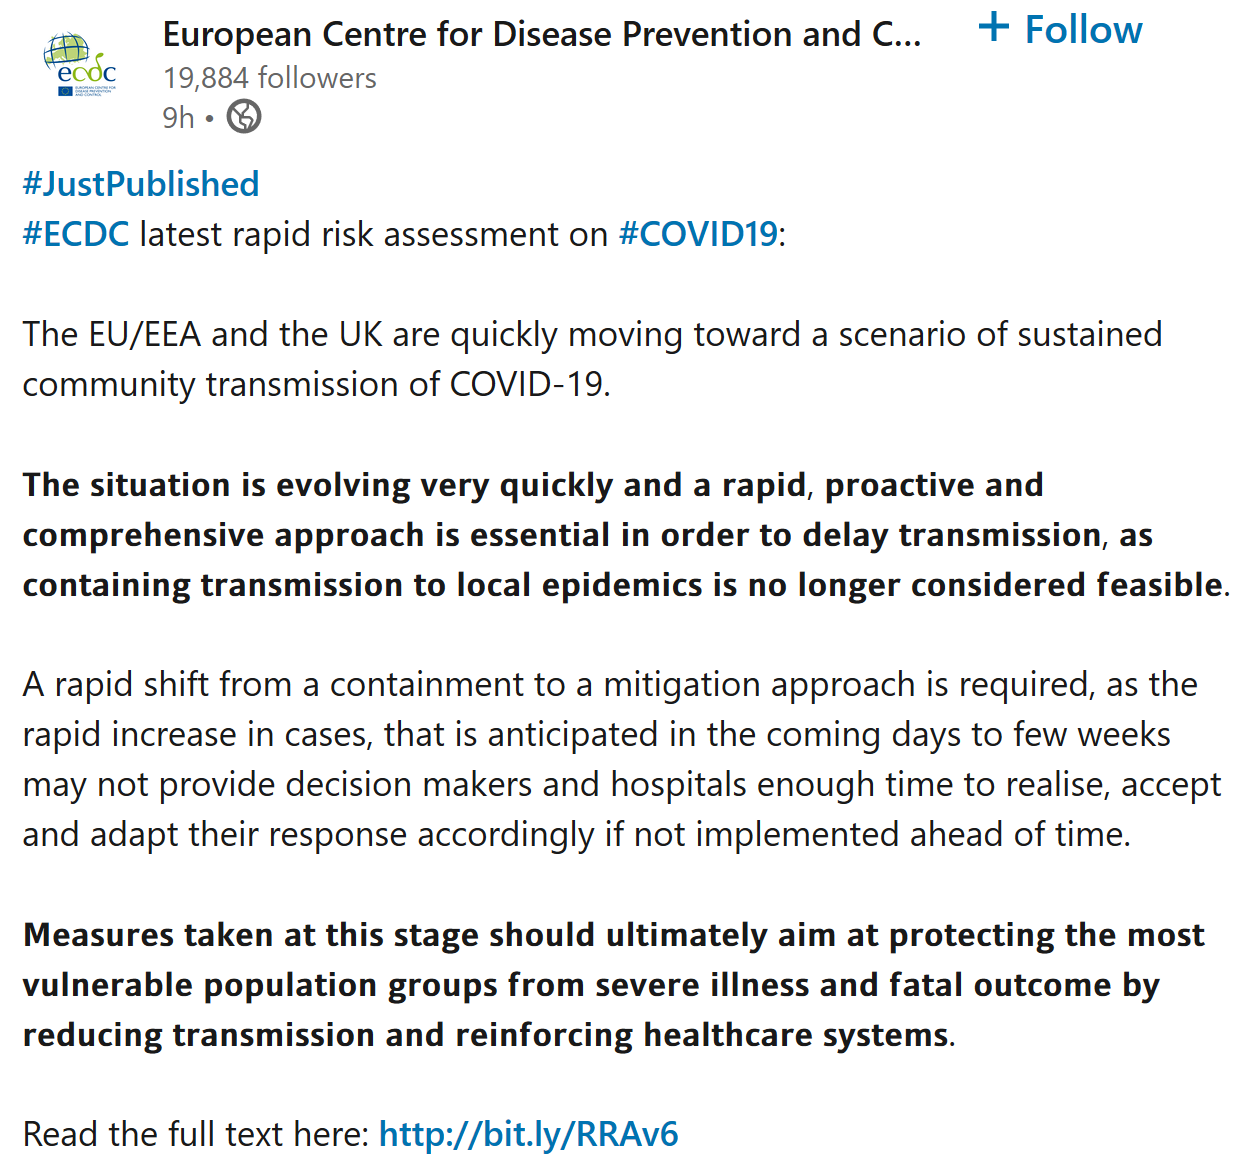
CDC, not so much.

FWIW I think the ECDC/WHO disagreement is less than it seems. ECDC is really saying that behavior change has to do the heavy lifting from here out, not that containment should be abandoned altogether.
This video explores a simple epidemic model for a community confronting coronavirus.
I built this to reflect my hometown, Bozeman MT and surrounding Gallatin County, with a population of 100,000 and no reported cases – yet. It shows the importance of an early, robust, multi-pronged approach to reducing infections. Because it’s simple, it can easily be adapted for other locations.
You can run the model using Vensim PLE or the Model Reader (or any higher version). Our getting started and running models videos provide a quick introduction to the software.
The model, in .mdl and .vpmx formats for any Vensim version:
Update 3/12: community corona 8-mdl+vpmx.zip
There’s another copy at https://vensim.com/coronavirus/ along with links to the software.
Not quite the good the bad and the ugly, but these are interesting for their contrasts:
The Word from Wuhan
Wang Xiuying – London Review
Inside China’s All-Out War on the Coronavirus
NYT interview with Bruce Aylward, WHO
Personal Essay: Coronavirus Lockdown Is A ‘Living Hell’
Anonymous – NPR
Why border control has limits, and mild cases don’t matter.
At the top, the US coronavirus response seems to be operating with (at least) two misperceptions. First, that border control works. Second, that a lower fatality rate means fewer deaths. Here’s how it really works.
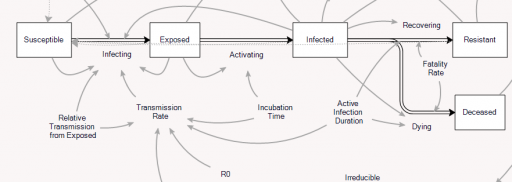
Consider an extremely simplified SEIRD model. This is a generalization of the simple SIR framework to include asymptomatic, non-infective Exposed people and the Deceased:
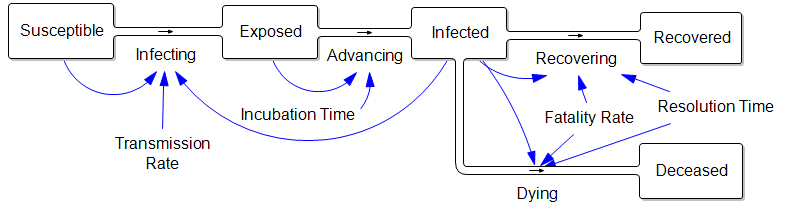
The parameters are such that the disease takes about a week to incubate, and about a week to resolve. The transmission rate is such that cases double about once a week, if left uncontrolled.
Those fortuitous time constants make it really simple to model the spread in discrete time. First, abstract away the susceptible (who are abundant early in the epidemic) and the resolved cases (which are few and don’t participate further):
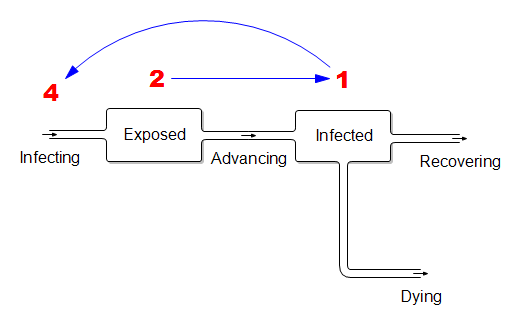
In this dirt-simple model,
If the disease is doubling weekly, then for every 1 infected person there must be 2 exposed people in the pipeline. And each of those infected people must expose 4 others. (Note that this is seemingly an R0 of 4, which is higher than what’s usually quoted, but the difference is partly due to discrete vs. continuous compounding. The R0 of 2.2 that’s currently common seems too low to fit the data though – more on that another time.)
What does this imply for control strategy? It means that, on the day you close the border, the infected arrivals you’ve captured and isolated understate the true problem. For every infected person, there are two exposed people on the loose, initiating domestic community spread. Because it’s doubling weekly, community infections very quickly replace the imports, even if a travel ban is 100% effective.
Now consider the claim that the fatality rate is much lower than reported, because there are many unobserved mild cases:
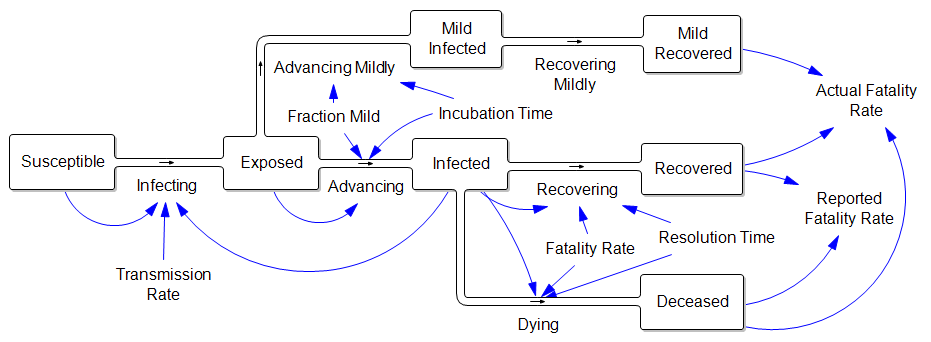
In other words, the reported fatality rate is Deceased/(Recovered+Deceased), but the “real” fatality rate is Deceased/(Recovered+Deceased+Mild Recovered). That’s great, but where did all those mild cases come from? If they are sufficiently numerous to dilute the fatality rate by, say, a factor of 10, then there must also be 9 people with mild infections going undetected for every known infected case. That doesn’t help the prognosis for deaths a bit, because (one tenth the fatality rate) x (ten times the cases) yields the same outcome. Actually, this makes the border control and community containment problem much harder, because there are now 10x as many contacts to trace and isolate. Fortunately this appears to be pure speculation.
Modeling expressions of futility for fun.
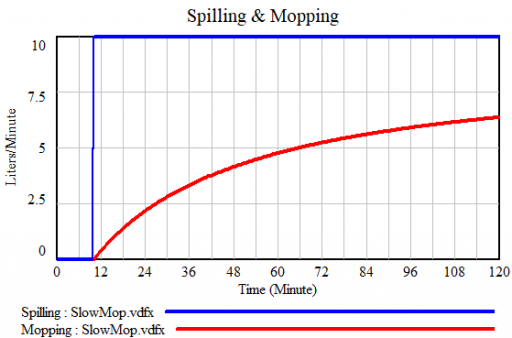
I just learned a beautiful Dutch idiom, dweilen met de kraan open. It means “mopping [the floor] with the the faucet running.” I’m not sure there’s a common English equivalent that’s so poetic, but perhaps “treating the symptoms, not the cause” is closest.
This makes a nice little model:

If you’re a slow mopper, you can never catch up with the tap:
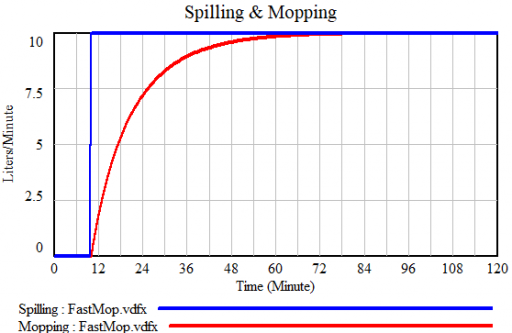
If you’re fast, you can catch up, but not reverse the process:
Either way, as long as you don’t turn off the tap, there will always be water on the floor:
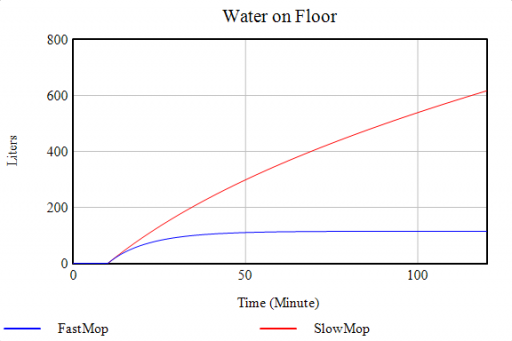
The Vensim model: dweilen 1.mdl
The structure of the system above is nearly the same as filling a leaky bucket, except that the user is concerned with the inflow rather than the outflow.

Failure to patch the leak is equally frustrating. (If you implement this, beware: leaky buckets are nonlinear!)
These control systems are definitely going nowhere:

This one’s fun because it only becomes an exercise in futility when you cross a nonlinear threshold.
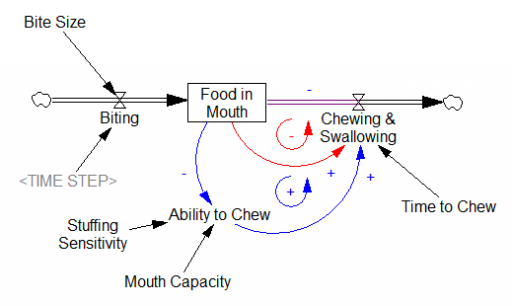
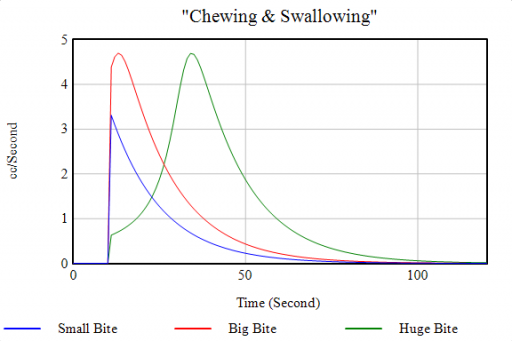
As long as you take small bites, the red loop of “normal” chewing clears the backlog of food in mouth in a reasonable time. But when you take a huge bite, you exceed the mouth’s capacity. This activates the blue positive loop, which slows chewing until the burden has been reduced somewhat. When the blue loop kicks in, the behavior mode changes (green), greatly delaying the process:
The Vensim model: chewing 1.mdl
I think the futility of this endeavor is normally thought of as a question of scale. The volume of the ocean is about 1.35 trillion trillion cubic centimeters, and a thimble contains about 1 cc. But suppose you could cycle that thimble really fast? I think you still have feedback problems:
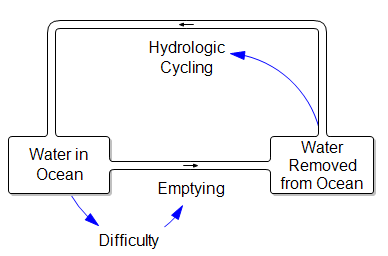
First, you have the mopping problem: as the ocean empties, the job gets harder, because you’ll be carrying water uphill … a lot (the average depth of the ocean is about 4000 meters). Second, you have the leaky bucket problem. Where are you going to put all that water? Evaporation and surface flow are inevitably going to take some back to the ocean.
I ran across this twitter thread this morning, describing how a focus on border security and containment of existing cases has failed to prevent the takeoff of coronavirus.
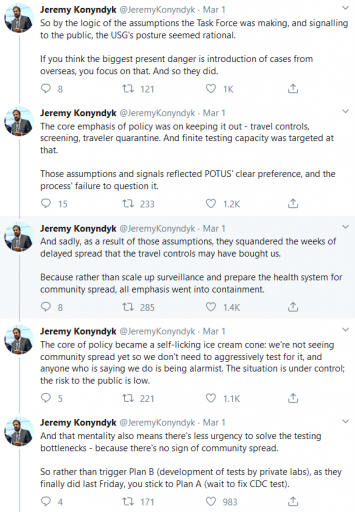
Here’s the data on US confirmed cases that goes with it:
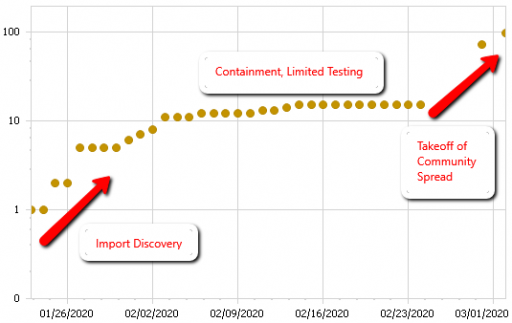
It’s easy to see how this behavior could lure managers into a self-confirming attributions trap. After a surge of imports, they close the borders. Cases flatten. Problem solved. Why go looking for trouble?
 The problem is that containment alone doesn’t work, because the structure of the system defeats it. You can’t intercept every infected person, because some are exposed but not yet symptomatic, or have mild cases. As soon as a few of these people slip into the wild, the positive loops that drive infection operate as they always have. Once the virus is in the wild, it’s essential to change behavior enough to lower its reproduction below replacement.