Climate Bathtub Chartjunk

I just ran across Twist and Shout: Images and Graphs in Skeptical Climate Media, a compendium of cherry picking and other chartjunk abuses.

I think it misses a large class of (often willful) errors: ignoring the climate bathtub. Such charts typically plot CO2 emissions or concentration against temperature, with the implication that any lack of correlation indicates a problem with the science. But this engages in a combination of a pattern matching fallacy and fallacy of the single cause. Sometimes these things make it into the literature, but most live on swampy skeptic sites.

An example, reportedly from John Christy, who should know better:

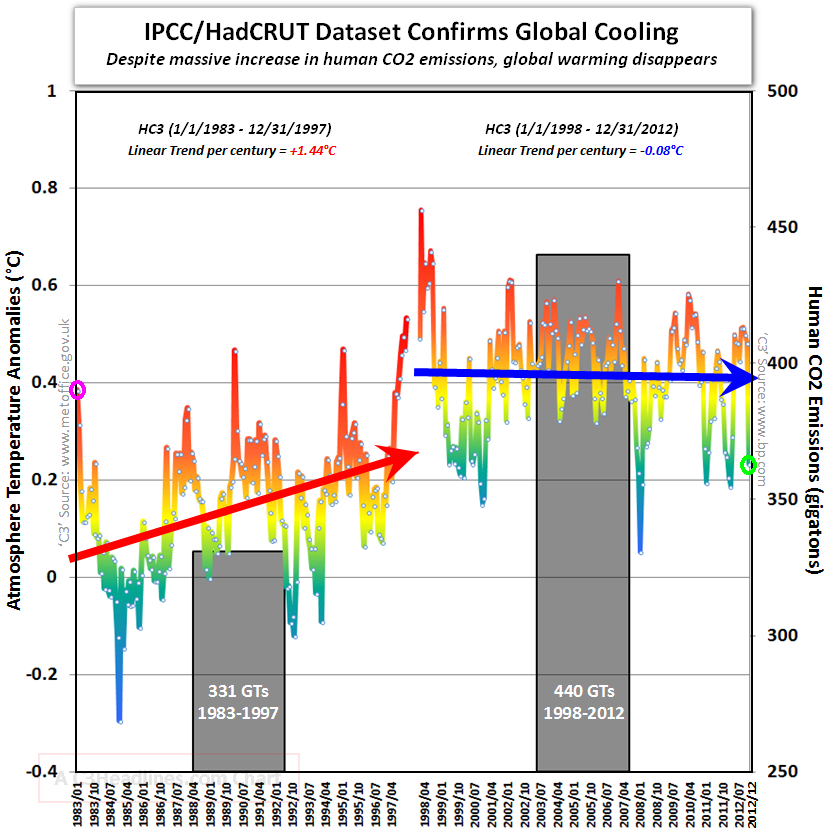
Notice how we’re supposed to make a visual correlation between emissions and temperature (even though two integrations separate them, and multiple forcings and noise influence temperature). Also notice how the nonzero minimum axis crossing for CO2 exaggerates the effect. That’s in addition to the usual tricks of inserting an artificial trend break at the 1998 El Nino and truncating the rest of history.

Towards Principles for Subscripting in Models

For many aspects of models, we have well-accepted rules that define good practice. All physical stocks must have first-order negative feedback on the outflow. Normalize your lookup tables. Thou shalt balance units.

In some areas, the rules haven’t been written down. Subscripts (arrays) are the poor stepchild of dynamic models. They simply didn’t exist when simulation languages emerged, and no one really thinks about them much. They’re treated as a utility, like memory allocation in C, rather than as a key part of the model architecture. I think that needs to change, so this post is attempt to write down some guidance. Consider it a work in progress; I’d be interested in your thoughts.

What’s the Question?

There are really two kinds of questions:

  • How much detail do you want in your model? This is just the age-old problem of aggregation, which I won’t rehash in this post.
  • How do the subscripts you’re using contribute to a transparent, operational description of the system?

It’s the latter I’m concerned with. In essence: how do you implement a given level of detail so that the array structure makes sense? Continue reading “Towards Principles for Subscripting in Models”

Modeling Investigations

538 had this cool visualization of the Russia investigation in the context of Watergate, Whitewater, and other historic investigations.

The original is fun to watch, but I found it hard to understand the time dynamics from the animation. For its maturity (660 days and counting), has the Russia investigation yielded more or fewer indictments than Watergate (1492 days total)? Are the indictments petering out, or accelerating?

A simplified version of the problem looks a lot like an infection model (a.k.a. logistic growth or Bass diffusion):

So, the interesting question is whether we can – from partway through the history of the system – estimate the ultimate number of indictments and convictions it will yield. This is fraught with danger, especially when you have no independent information about the “physics” of the system, especially the population of potential crooks to be caught. Continue reading “Modeling Investigations”

Who cares if your model is rubbish?

All models are wrong, so does it matter if your model is more wrong than necessary?

If you’re thinking “no,” you’re not alone (but you won’t like this blog). Some models are used successfully for pure propaganda. Like the Matrix, they can be convincing for those who don’t get too curious about what lies beneath. However, if that’s all we learn to do with models, we’re doomed. The real potential of models is for improving control, by making good contingent predictions of “what might happen if we do X.”

Doing the best possible job of that involves tradeoffs among scope, depth and quality, between formal and informal methods, and between time spent modeling and time spent on everything else – data collection, group process, and execution. It’s difficult to identify the best choices for a given messy situation.

You can hide ugly aspects of a model by embedding it in a fancy interface, or by showing confidence bounds on simulations without examining individual trajectories. But if you take the low (quality) road, you’re cheating yourself, your clients and the world out of a lot of good insight.

Specifically:

  • You’ll make bad decisions.
  • You won’t learn much, or at least you won’t learn much that’s right.
  • You’ll get into trouble when you attempt to reuse or extend the model later.
  • People will find out. Maybe. (Sadly, if the situation is complex enough, they won’t.) Eventually, this may affect your credibility.
  • You will get less recognition for your work. (Models that are too large, and insufficiently robust, are the primary failure mode in the papers I review.)
  • The process will destroy your soul, or at least your brain.

That last point is the dealbreaker for me. I’m into modeling for the occasional glimpses of truth and beauty. Without that, it’s no fun. Continue reading “Who cares if your model is rubbish?”

Cynefin, Complexity and Attribution

This nice article on the human skills needed to deal with complexity reminded me of Cynefin.

Cynefin framework by Edwin Stoop

Generally, I find the framework useful – it’s a nice way of thinking about the nature of a problem domain and therefore how one might engage. (One caution: the meaning of the chaotic domain differs from that in nonlinear dynamics.)

However, I think the framework’s policy prescription in the complex domain falls short of appreciating the full implications of complexity, at least of dynamic complexity as we think of it in SD: Continue reading “Cynefin, Complexity and Attribution”

Silver Lining to the White House Climate Panel?

The White House is reportedly convening a panel to reexamine the scientific consensus on climate. How does that work, exactly? Are they going to publish thousands of new papers to shift the apparent balance of opinion in the scientific literature? And hasn’t analysis of consensus already been done to death, with a null result for the skeptics?

The problem is that there isn’t much for skeptics to work with. There aren’t any models that make useful predictions with very low climate sensitivity. In fact, skeptical predictions haven’t really panned out at all. Lindzen’s Adaptive Iris is still alive – sort of – but doesn’t result in a strong negative feedback. The BEST reanalysis didn’t refute previous temperature data. The surfacestations.org effort used crowdsourcing to reveal some serious weather station siting problems, which ultimately amounted to nothing.

And those are really the skeptics’ Greatest Hits. After that, it’s a rapid fall from errors to nuts. No, satellites temperatures don’t show a negative trend. Yes, Fourier and wavelet analyses are typically silly, but fortunately tend to refute themselves quickly. This list could grow long quickly, though skeptics are usually pretty reluctant to make testable models or predictions. That’s why even prominent outlets for climate skepticism have to resort to simple obfuscation.

So, if there’s a silver lining to the proposed panel, it’s that they’d have to put the alleged skeptics’ best foot forward, by collecting and identifying the best models, data and predictions. Then it would be readily apparent what a puny body of evidence that yielded.


Future Climate of the Bridgers

Ten years ago, I explored future climate analogs for my location in Montana:

When things really warm up, to +9 degrees F (not at all implausible in the long run), 16 of the top 20 analogs are in CO and UT, …

Looking at a lot of these future climate analogs on Google Earth, their common denominator appears to be rattlesnakes. I’m sure they’re all nice places in their own way, but I’m worried about my trees. I’ll continue to hope that my back-of-the-envelope analysis is wrong, but in the meantime I’m going to hedge by managing the forest to prepare for change.

I think there’s a lot more to worry about than trees. Fire, wildlife, orchids, snowpack, water availability, …

Recently I decided to take another look, partly inspired by the Bureau of Reclamation’s publication of downscaled data. This solves some of the bias correction issues I had in 2008. I grabbed the model output (36 runs from CMIP5) and observations for the 1/8 degree gridpoint containing Bridger Bowl:

Then I used Vensim to do a little data processing, converting the daily time series (which are extremely noisy weather) into 10-year moving averages (i.e., climate). Continue reading “Future Climate of the Bridgers”

On Compounding

This is a brief techy note on compounding in models, prompted by some recent work on financial functions, i.e. compound interest. It’s something you probably know, but don’t think about much. That’s because it’s irrelevant most of the time, except once in a while when it decides to bite you.

Suppose you’re translating someone’s discrete time model, and you decide to translate it to continuous time, because Discrete Time Stinks. The original has:

bank balance(t+1) = bank balance(t) * (1+0.1)

So you translate as: Continue reading “On Compounding”

A Grizzly-Pine-Nutcracker CLD Rework

I spent a little time working out what Clark’s Causal Calamity might look like as a well-formed causal loop diagram. Here’s an attempt, based on little more than spending a lot of time wandering around the Greater Yellowstone ecosystem:

The basic challenge is that there isn’t a single cycle that encompasses the whole system. Grizzlies, for example, are not involved in the central loop of pine-cone-seedling dispersal and growth (R1). They are to some extent free riders on the system – they raid squirrel middens and eat a lot of nuts, which can’t be good for the squirrels (dashed line, loop B5).

There are also a lot of “nuisance” loops  that are essential for robustness of the real system, but aren’t really central to the basic point about ecosystem interconnectedness. B6 is one example – you get such a negative loop every time you have an outflow from a stock (more stuff in the stock -> faster outflow -> less stuff in the stock). R2 is another – the development of clearings from pines via fire and pests is offset by the destruction of pines via the same process.

I suspect that this CLD is still dramatically underspecified and erroneous, compared to the simplest stock-flow model that could encompass these concepts. It would also make a lousy poster for grocery store consumption.