The Energy Collective echoes amazement at unconventional oil and gas,
Yergin, vice chairman of IHS CERA:
“The United States is in the midst of the ‘unconventional revolution in oil and gas’ that, it becomes increasingly apparent, goes beyond energy itself.
…
“Owing to the scale and impact of shale gas and tight oil, it is appropriate to describe their development as the most important energy innovation so far of the 21st century. … It is striking to think back to the hearings of even just half a decade ago, during the turmoil of 2008, when it was widely assumed that a permanent era of energy shortage was at hand. How different things look today.”
Mary J. Hutzler, Institute for Energy Research:
“The United States has vast resources of oil, natural gas, and coal. In a few short years, a forty-year paradigm – that we were energy resource poor – has been disproven. Instead of being resource poor, we are incredibly energy rich.”
Abundance is often attributed to a technical miracle, brought about by government R&D into unconventional fossil fuels. The articulated mental model is something like the following:

But is this really a revolutionary transition from scarcity to abundance, was it a surprise, and should technology get all the credit? I don’t think so.
(Abundance/Scarcity) = 1.03?
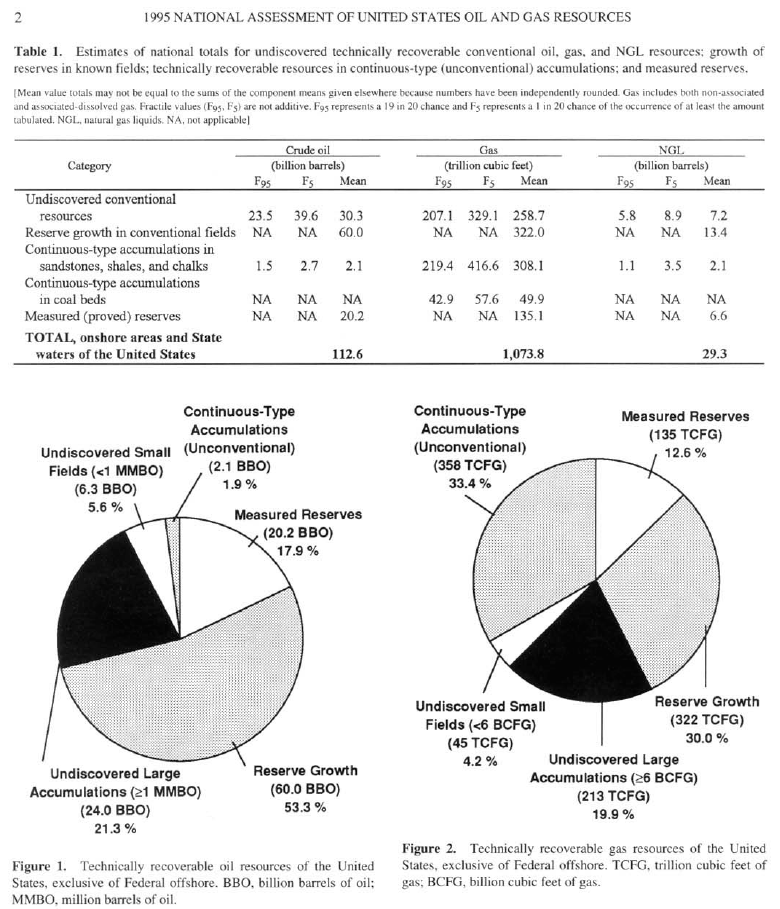
Contrast the 1995 and 2012 USGS National Assessments of onshore resources:

Resources, on an energy basis (EJ). Cumulative production from EIA; note that gas production data begins in 1980, so gas cumulative production is understated.
In spite of increasing unconventional resources, there’s actually less oil than there was, mainly because a lot of the 1995 resource has since been produced. (Certainly there are also other differences, including method changes.) For gas, where one can make a stronger case for a miracle due to the large increase in unconventional resources, the top line is up a whopping 3%. Even if you go with EIA/INTEK‘s ~2x larger estimate for shale gas, resources are up only 35%.
Call me conservative, but I think an abundance revolution that “disproves” scarcity would be a factor of 10 increase, not these piddly changes.
You could argue that the USGS hasn’t gotten the memo, and therefore has failed to appreciate new, vast unconventional resources. But given that they have reams of papers assessing unconventional fields, I think it more likely that they’re properly accounting for low recoverability, and not being bamboozled by large resources in place.
Reserves involve less guesswork, but more confounding dynamics. But reserves tell about the same story as resources. Oil reserves are more than 40% off their 1970 peak. Even gas reserves have only just regained the levels achieved 40 years ago.

EIA
Surprise?
In 1991, USGS’ Thomas Ahlbrandt wrote:
Unconventional natural gas resources are also becoming increasingly viable. Coalbed methane, which accounts for about 25 percent of potential natural gas resources in the U.S., will displace nearly a trillion cubic feet (TCF) of gas from conventional resources in the near term and perhaps several TCF by the turn of the century. Similarly, production of gas from low permeability resources may displace some production of conventional gas as increasingly smaller conventional accumulations are developed. Coalbed methane and tight gas, both abundant in the Rocky Mountain and Appalachian regions, will likely experience significant production increases. Optimistic scenarios suggest that tight gas and coalbed methane resources may provide more domestic natural gas production than conventional resources by the year 2010. Horizontal drilling technology will most likely unlock the large currently uneconomic gas resources in tight reservoirs. Technologies like this will most certainly change the status of what are presently considered unconventional resources.
I’d call that a “no.”
Should we be surprised to see supply increasing in the current price environment? Again, I’d say no. The idea that oil and gas have supply curves is certainly much older than its appearance in the 1995 USGS assessment. Perhaps the ongoing increase in shale gas development, when prices have collapsed, is a bit surprising. But then you have to consider that (a) drilling costs have tanked alongside the economy, (b) there are lags between price, perception, capital allocation, and production, and (c) it’s expectations of price, not current prices, that drive investment.
Does tech get the credit?
Certainly tech gets some credit. For example, the Bakken oil boom owes much to horizontal drilling:

EIA
But there’s more than tech going on. And much of the tech evolution is surely a function of industry activity funded out of revenue or accumulated through production experience, rather than pure government R&D.

If tech is the exclusive driver of increasing abundance, you’d expect costs and prices to be falling. Gas prices are indeed well off their recent peak, though one could wonder whether that’s a durable circumstance. Even so, gas is no cheaper than it was in the 90s, and more costly than in the pre-OPEC era. Oil isn’t cheap at all – it’s close to its historic highs.

So, if there’s anything here that one might call a tech fingerprint, it would have to be the decline in gas prices post-mid-2008. But that coincides better with the financial crisis than with the gas boom.
Cost data are less current, but if anything the cost picture is less sanguine. “Real gas equipment costs are 12 percent higher and operating costs are 37 percent higher than for the base year of 1976,” says EIA.
Bottom Line
First, let’s not kid ourselves. There’s less oil and gas under US soil than there has ever been.
Technology has at best done a little more than keep the wolf from the door, by lowering the cost of exploration and development by enough to offset the increases that would result from increasing physical scarcity.
It’s possible that the effects on shale and tight gas cost and availability have been dramatic, but there are plausible alternative hypotheses (financial crisis, moving up supply curves, and delays in production capital investment) for current prices.
Personally, I doubt that technology can keep up with physical scarcity and demand growth forever, so I don’t expect that gas prices will continue walking back to 1970 or 1960 levels. The picture for oil is even worse. But I hope that at some point, we’ll come to our senses and tax CO2 at a level high enough to reverse consumption growth. If that happens abruptly enough, it could drive down wellhead prices.
None of this sounds like the kind of tailfins and big-block V8 abundance that people seem to be hoping for.


