A PLOS Medicine paper asserts that most published results are false.
It can be proven that most claimed research findings are false
Corollary 1: The smaller the studies conducted in a scientific field, the less likely the research findings are to be true.
Corollary 2: The smaller the effect sizes in a scientific field, the less likely the research findings are to be true.
Corollary 3: The greater the number and the lesser the selection of tested relationships in a scientific field, the less likely the research findings are to be true.
Corollary 4: The greater the flexibility in designs, definitions, outcomes, and analytical modes in a scientific field, the less likely the research findings are to be true.
Corollary 5: The greater the financial and other interests and prejudices in a scientific field, the less likely the research findings are to be true.
Corollary 6: The hotter a scientific field (with more scientific teams involved), the less likely the research findings are to be true.
This somewhat alarming result arises from fairly simple statistics of false positives, publication selection bias, and causation vs. correlation problems. While the math is incontrovertible, some of the assumptions have been challenged:
… calculating the unreliability of the medical research literature, in whole or in part, requires more empirical evidence and different inferential models than were used. The claim that “most research findings are false for most research designs and for most fields” must be considered as yet unproven.
Still, the argument seems to be a matter of how much rather than whether publication bias influences findings:
We agree with the paper’s conclusions and recommendations that many medical research findings are less definitive than readers suspect, that P-values are widely misinterpreted, that bias of various forms is widespread, that multiple approaches are needed to prevent the literature from being systematically biased and the need for more data on the prevalence of false claims.
(Others propose similar challenges. There’s conflicting literature about whether (weak) observational studies hold up with (strong) randomized follow-up trials.)
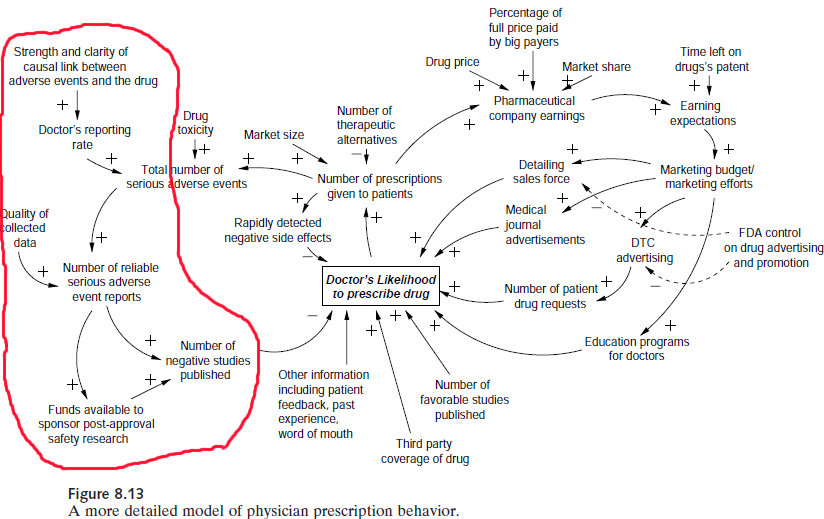
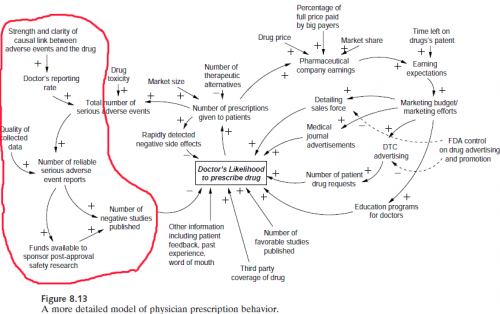
This is obviously a big problem from a control perspective, because the kind of information provided by the studies in question is key to managing many systems, as in Nancy Leveson‘s pharma safety example:
It’s also leads me to a rather pointed self-question. To what extent is typical system dynamics modeling practice subject to the same kinds of biases? Can we say not only that all models are wrong, but that most are useless?
First the good news.
- SD doesn’t usually operate in the data mining space, where large observational studies seek effects absent any a priori causal theory. That means we’re not operating where false positives are most likely to arise.
- Often, SD practitioners are not testing our own pet theories, but those of some decision makers – perhaps even theories of competing interests in an organization.
- SD models play a “knowledge integration” role that’s somewhat analogous to meta-analysis. A meta-analysis pools the statistics from a number of replications of some observation, which improves the signal to noise ratio, making it easier to see whether there’s any baby in the bathwater. An SD model instead pools the effect sizes of inputs (studies or anecdotes) and puts them to a functional test: do the individual components, assembled into a system, yield the observed behavior of the macro system?
- Similarly, good SD modelers tend to supplement purely statistical inputs with Reality Checks that effectively provide additional data verification by testing extreme conditions where outcomes are known (though this is not helpful if you don’t know anything about relationships to begin with).
- Including physics (using the term loosely to include things like conservation of people) in models also greatly constrains the space of plausible hypotheses a priori.
Now the bad news.
- Models are often used in one-off, non-replicable strategic decision making situations, so we’ll never know. Refereed forecasting helps, but success can still be due to luck rather than skill.
- We often have to formalize soft variable concepts for which definitions are uncertain and measurements are lacking.
- SD models are often reliant on thin literature bases, small studies, or subject matter expertise to establish relationships. Studies with randomized control are a rarity.
- Available data for model verification is often of low quality and short duration.
- Data can provide a weak check on the model – if a system exhibits exponential growth, for example, one positive feedback loop in the dynamic hypothesis is as good as another (though of course good a priori explanations of the structure of the system help).
My suspicion is that savvy modelers are already well aware of just how messy and uncertain their problem domains are. Decisions will be taken, with or without a model, so the real objective is to use the model to add value by rejecting ideas that don’t work. The problem then is not that wrong models make decisions worse, but that we could probably do a lot better if we could be smarter about the possible biases in models and thinking in general.
Alex Tabarrok at Marginal Revolution has a nice take on remedies:
What can be done about these problems? (Some cribbed straight from Ioannidis and some my own suggestions.)
1) In evaluating any study try to take into account the amount of background noise. That is, remember that the more hypotheses which are tested and the less selection which goes into choosing hypotheses the more likely it is that you are looking at noise.
2) Bigger samples are better. (But note that even big samples won’t help to solve the problems of observational studies which is a whole other problem).
3) Small effects are to be distrusted.
4) Multiple sources and types of evidence are desirable.
5) Evaluate literatures not individual papers.
6) Trust empirical papers which test other people’s theories more than empirical papers which test the author’s theory.
7) As an editor or referee, don’t reject papers that fail to reject the null.
For SD modeling, I’d add a few more:
8) Reserve time for exploration of uncertainty (lots of Monte Carlo simulation).
9) Calibrate your confidence bounds.
10) Help clients to appreciate the extent and implications of uncertainty.
11) Pay attention to the language used to describe statistical concepts. Words like “expectation” and “significance” that have specific mathematical interpretations don’t mean the same thing to managers.
11) Look for robust policies that work irrespective of uncertain relationships.
12) Explicitly seek out and test alternative hypotheses (This sounds like it’s at odds with Corollary 3 above, but I think it’s the right thing to do. Testing multiple hypotheses in the context of the model is not the same thing as mining data for multiple relationships.).
13) If you can’t estimate something directly from data, or back it up with literature (more than a single paper), at least articulate some bounds on the effect, perhaps through experiments with a submodel.
What do you think? When is modeling and statistical analysis helpful, and when is it risky business?