Dynamic Cohorts

This is the model library entry for my ISDC 2017 plenary paper with Larry Yeager on dynamic cohorts in Ventity:

Dynamic cohorts: a new approach to managing detail

While it is desirable to minimize the complexity of a model, some problems require the detailed representation of heterogeneous subgroups, where nonlinearities prevent aggregation or explicit chronological aging is needed. It is desirable to have a representation that avoids burdening the modeler or user computationally or cognitively. Eberlein & Thompson (2013) propose continuous cohorting, a novel solution to the cohort blending problem in population modeling, and test it against existing aging chain and cohort-shifting approaches. Continuous cohorting prevents blending of ages and other properties, at at some cost in complexity.

We propose another new solution, dynamic cohorts, that prevents blending with a comparatively low computational burden. More importantly, the approach simplifies the representation of distinct age, period and cohort effects and representation of dynamics other than the aging process, like migration and attribute coflows. By encapsulating the lifecycle of a representative cohort in a single entity, rather than dispersing it across many states over time, it makes it easier to develop and explain the model structure.

Paper: Dynamic Cohorts P1363.pdf

Models: Dynamic Cohorts S1363.zip

Presentation slides: Dynamic Cohorts Fid Ventana v2b.pdf

I’ve previously written about this here.

The Beer Game

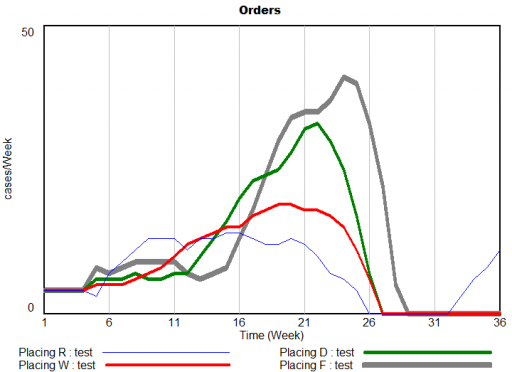
The Beer Game is the classic business game in system dynamics, demonstrating just how tricky it can be to manage a seemingly-simple system with delays and feedback. It’s a great icebreaker for teams, because it makes it immediately clear that catastrophes happen endogenously and fingerpointing is useless.

The system demonstrates amplification, aka the bullwhip effect, in supply chains. John Sterman analyzes the physical and behavioral origins of underperformance in the game in this Management Science paper. Steve Graves has some nice technical observations about similar systems in this MSOM paper.

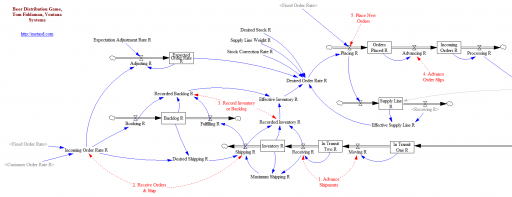
Here are two versions that are close to the actual board game and the Sterman article:

Beer Game Fiddaman NoSubscripts.zip

This version doesn’t use arrays, and therefore should be usable in Vensim PLE. It includes a bunch of .cin files that implement the (calibrated) decision heuristics of real teams of the past, as well as some sensitivity and optimization control files.

Beer Game Fiddaman Array.zip

This version does use arrays to represent the levels of the supply chain. That makes it a little harder to grasp, but much easier to modify if you want to add or remove levels from the system or conduct optimization experiments. It requires Vensim Pro or DSS, or the Model Reader.

Polynomials & Interpolating Functions for Decision Rules

Sometimes it’s useful to have a way to express a variable as a flexible function of time, so that you can find the trajectory that maximizes some quantity like profit or fit to data. A caveat: this is not generally the best thing to do. A simple feedback rule will be more robust to rescaling and uncertainty and more informative than a function of time. However, there are times when it’s useful for testing or data approximation to have an open-loop decision rule. The attached models illustrate some options.

If you have access to arrays in Vensim, the simplest is to use the VECTOR LOOKUP function, which reads a subscripted table of values with interpolation. However, that has two limitations: a uniform time axis, and linear interpolation.

If you want a smooth function, a natural option is to pick a polynomial, like

y = a + b*t + c*t^2 + d*t^3 …

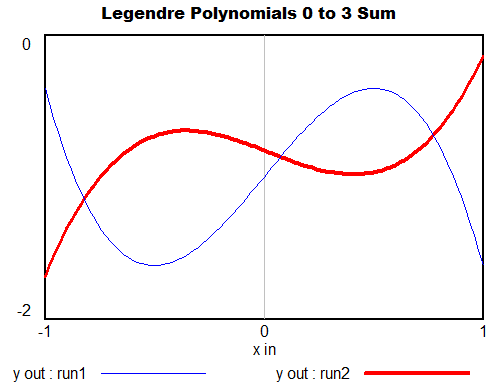
However, it can be a little fiddly to interpret the coefficients or get them to produce a desired behavior. The Legendre polynomials provide a basis with nicer scaling, which still recovers the basic linear, quadratic, cubic (etc.) terms when needed. (In terms of my last post, their improved properties make them less sloppy.)


You can generalize these to 2 dimensions by taking tensor products of the 1D series. Another option is to pick the first n terms of Pascal’s triangle. These yield essentially the same result, and either way, things get complex fast.

Back to 1D series, what if you want to express the values as a sequence of x-y points, with smooth interpolation, rather than arcane coefficients? One option is the Lagrange interpolating polynomial. It’s simple to implement, and has continuous derivatives, but it’s an N^2 problem and therefore potentially compute-intensive. It might also behave badly outside its interval, or inside due to ringing.

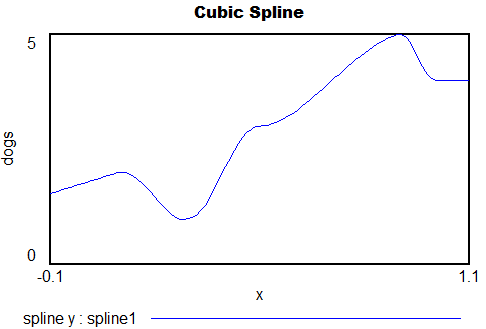
Probably the best choice for a smooth trajectory specified by x-y points (and optionally, the slope at each point) is a cubic spline or Bezier curve.

Polynomials1.mdl – simple smooth functions, Legendre, Lagrange and spline, runs in any version of Vensim

InterpolatingArrays.mdl InterpolatingArrays.vpm – array functions, VECTOR LOOKUP, Lagrange and spline, requires Pro/DSS or the free Reader

Nelson Rules

I ran across the Nelson Rules in a machine learning package. These are a set of heuristics for detecting changes in statistical process control. Their inclusion felt a bit like navigating a 787 with a mechanical flight computer (which is a very cool device, by the way).

The idea is pretty simple. You have a time series of measurements, normalized to Z-scores, and therefore varying (most of the time) by plus or minus 3 standard deviations. The Nelson Rules provide a way to detect anomalies: drift, oscillation, high or low variance, etc. Rule 1, for example, is just a threshold for outlier detection: it fires whenever a measurement is more than 3 SD from the mean.

In the machine learning context, it seems strange to me to use these heuristics when more powerful tests are available. This is not unlike the problem of deciding whether a random number generator is really random. It’s fairly easy to determine whether it’s producing a uniform distribution of values, but what about cycles or other long-term patterns? I spent a lot of time working on this when we replaced the RNG in Vensim. Many standard tests are available. They’re not all directly applicable, but the thinking is.

In any case, I got curious how the Nelson rules performed in the real world, so I developed a test model.

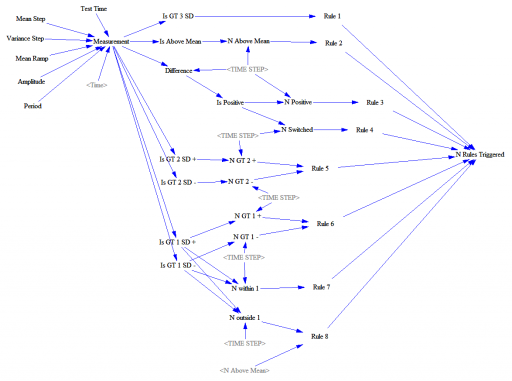
This feeds a test input (Normally distributed random values, with an optional signal superimposed) into a set of accounting variables that track metrics and compare with the rule thresholds. Some of these are complex.

Rule 4, for example, looks for 14 points with alternating differences. That’s a little tricky to track in Vensim, where we’re normally more interested in continuous time. I tackle that with the following structure:

Difference = Measurement-SMOOTH(Measurement,TIME STEP)
**************************************************************
Is Positive=IF THEN ELSE(Difference>0,1,-1)
**************************************************************
N Switched=INTEG(IF THEN ELSE(Is Positive>0 :AND: N Switched<0
,(1-2*N Switched )/TIME STEP
,IF THEN ELSE(Is Positive<0 :AND: N Switched>0
 ,(-1-2*N Switched)/TIME STEP
 ,(Is Positive-N Switched)/TIME STEP)),0)
**************************************************************
Rule 4=IF THEN ELSE(ABS(N Switched)>14,1,0)
**************************************************************

There’s a trick here. To count alternating differences, we need to know (a) the previous count, and (b) whether the previous difference encountered was positive or negative. Above, N Switched stores both pieces of information in a single stock (INTEG). That’s possible because the count is discrete and positive, so we can overload the storage by giving it the sign of the previous difference encountered.

Thus, if the current difference is negative (Is Positive < 0) and the previous difference was positive (N Switched > 0), we (a) invert the sign of the count by subtracting 2*N Switched, and (b) augment the count, here by subtracting 1 to make it more negative.

Similar tricks are used elsewhere in the structure.

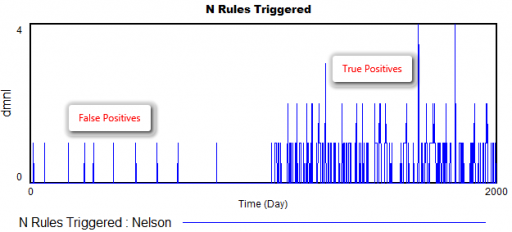
How does it perform? Surprisingly well. Here’s what happens when the measurement distribution shifts by one standard deviation halfway through the simulation:

There are a few false positives in the first 1000 days, but after the shift, there are many more detections from multiple rules.

The rules are pretty good at detecting a variety of pathologies: increases or decreases in variance, shifts in the mean, trends, and oscillations. The rules also have different false positive rates, which might be OK, as long as they catch nonoverlapping problems, and don’t have big differences in sensitivity as well. (The original article may have more to say about this – I haven’t checked.)

However, I’m pretty sure that I could develop some pathological inputs that would sneak past these rules. By contrast, I’m pretty sure I’d have a hard time sneaking anything past the NIST or Diehard RNG test suites.

If I were designing this from scratch, I’d use machine learning tools more directly – there are lots of tests for distributions, changes, trend breaks, oscillation, etc. that can be used online with a consistent likelihood interpretation and optimal false positive/negative tradeoffs.

Here’s the model:

NelsonRules1.mdl

NelsonRules1.vpm

Dynamics of the last Twinkie

When Hostess went bankrupt in 2012, there was lots of speculation about the fate of the last Twinkie, perhaps languishing on the dusty shelves of a gas station convenience store somewhere in New Mexico. Would that take ten days, ten weeks, ten years?

So, what does this have to do with system dynamics? It calls to mind the problem of modeling the inventory stockout constraint on sales. This problem dates back to Industrial Dynamics (see the variable NIR driving SSR and the discussion around figs. 15-5 and 15-7).

If there’s just one product in one inventory (i.e. one store), and visibility doesn’t matter, the constraint is pretty simple. As long as there’s one item left, sales or shipments can proceed. The constraint then is:

(1) selling = MIN(desired selling, inventory/time step)

In other words, the most that can be sold in one time step is the amount of inventory that’s actually on hand. Generically, the constraint looks like this:
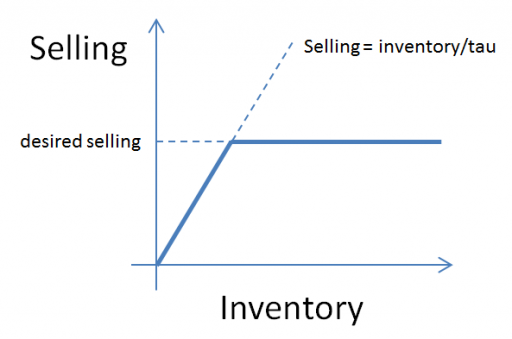
Here, tau is a time constant, that could be equal to time step (DT), as above, or could be generalized to some longer interval reflecting handling and other lags.

This can be further generalized to some kind of continuous function, like:

(2) selling = desired selling * f( inventory )

where f() is often a lookup table. This can be a bit tricky, because you have to ensure that f() goes to zero fast enough to obey the inventory/DT constraint above.

But what if you have lots of products and/or lots of inventory points, perhaps with different normal turnover rates? How does this aggregate? I built the following toy model to find out. You could easily do this in Vensim with arrays, but I found that it was ideally suited to Ventity.

Here’s the setup:

First, there’s a collection of Store entities, each with an inventory. Initial inventory is random, with a Poisson distribution, which ensures integer twinkies. Customer arrivals also have a Poisson distribution, and (optionally), the mean arrival rate varies by store. Selling is constrained to stock on hand via inventory/DT, and is also subject to a visibility effect – shelf stock influences the probability that a customer will buy a twinkie (realized with a Binomial distribution). The visibility effect saturates, so that there are diminishing returns to adding stock, as occurs when new stock goes to the back rows of the shelf, for example.
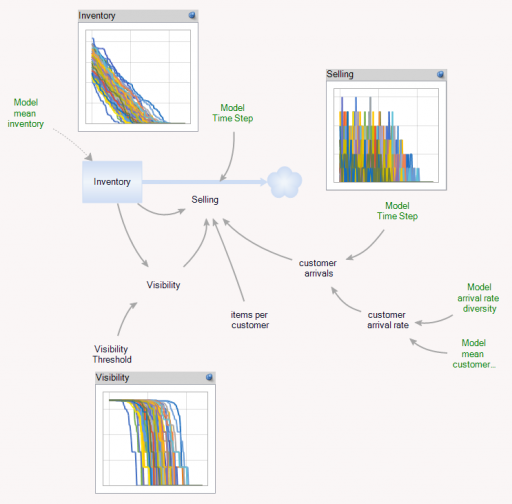
In addition, there’s an Aggregate entitytype, which is very similar to the Store, but deterministic and continuous.
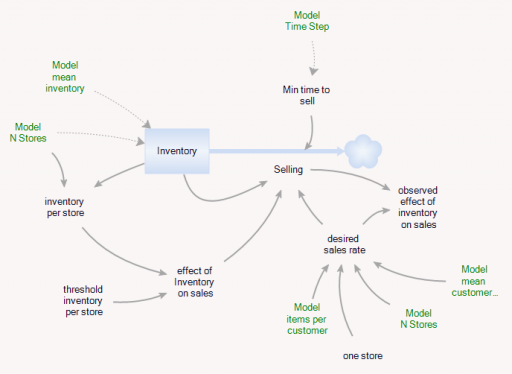
The Aggregate’s initial inventory and sales rates are set to the expected values for individual stores. Two different kinds of constraints on the inventory outflow are available: inventory/tau, and f(inventory). The sales rate simplifies to:

(3) selling = min(desired sales rate*f(inventory),Inventory/Min time to sell)

(4) min time to sell >= time step

In the Store and the Aggregate, the nonlinear effect of inventory on sales (called visibility in the store) is given by

(5) f(inventory) = 1-Exp(-Inventory/Threshold)

However, the aggregate threshold might be different from the individual store threshold (and there’s no compelling reason for the aggregate f() to match the individual f(); it was just a simple way to start).

In the Store[] collection, I calculate aggregates of the individual stores, which look quite continuous, even though the population is only 100. (There are over 100,000 gas stations in the US.)
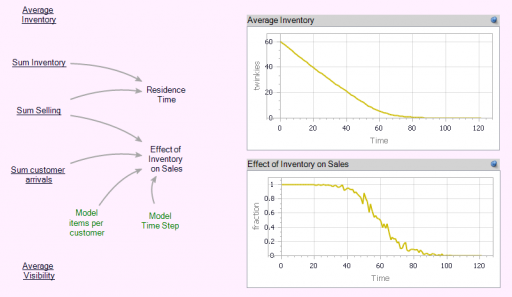
Notice that the time series behavior of the effect of inventory on sales is sigmoid.

Now we can compare individual and aggregate behavior:

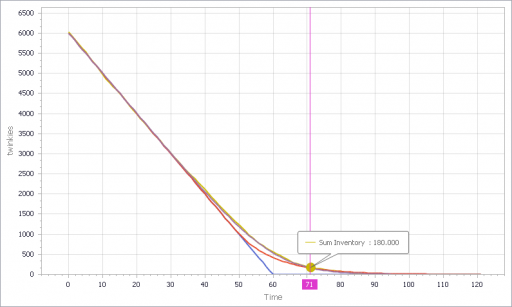
Inventory
Selling
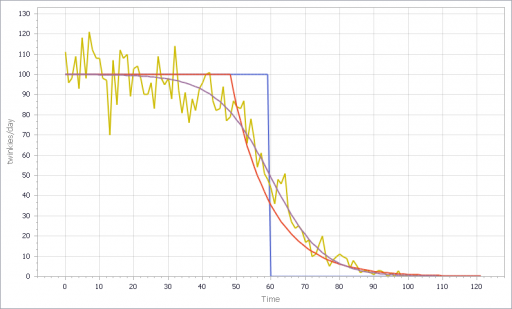
The noisy yellow line is the sum of the individual Stores. The blue line arises from imposing a hard cutoff, equation (1) above. This is like assuming that all stores are equal, and inventory doesn’t affect sales, until it’s gone. Clearly it’s not a great fit, though it might be an adequate shortcut where inventory dynamics are not really the focus of a model.

The red line also imposes an inventory/tau constraint, but the time constant (tau) is much longer than the time step, at 8 days (time step = 1 day). Finally, the purple sigmoid line arises from imposing the nonlinear f(inventory) constraint. It’s quite a good fit, but the threshold for the aggregate must be about twice as big as for the individual Stores.

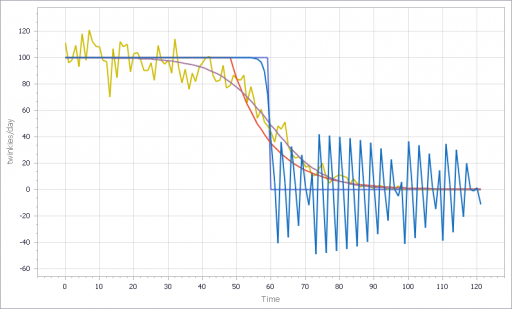
However, if you parameterize f() poorly, and omit the inventory/tau constraint, you get what appear to be chaotic oscillations – cool, but obviously unphysical:
If, in addition, you add diversity in Store’s customer arrival rates, you get a longer tail on inventory. That last Twinkie is likely to be in a low-traffic outlet. This makes it a little tougher to fit all parts of the curve:
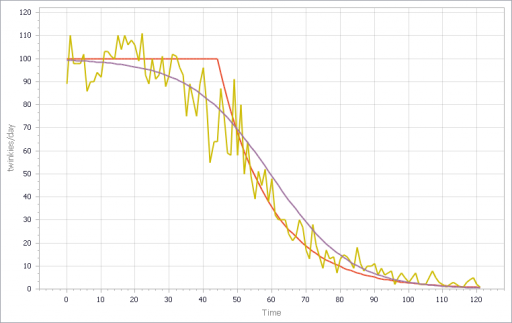
I think there are some interesting questions here, that would make a great paper for the SD conference:

  • (Under what conditions) can you derive the functional form of the aggregate constraint from the properties of the individual Stores?
  • When do the deficiencies of shortcut approaches, that may lack smooth derivatives, matter in aggregate models like Industrial dynamics?
  • What are the practical implications for marketing models?
  • What can you infer about inventory levels from aggregate data alone?
  • Is that really chaos?

Have at it!

The Ventity model: LastTwinkie1.zip

Forrester on Continuous Flows

I just published three short videos with sample models, illustrating representation of discrete and random events in Vensim.

Jay Forrester‘s advice from Industrial Dynamics is still highly relevant. Here’s an excerpt:

Chapter 5, Principles for Formulating Models

5.5 Continuous Flows

In formulating a model of an industrial operation, we suggest that the system be treated, at least initially, on the basis of continuous flows and interactions of the variables. Discreteness of events is entirely compatible with the concept of information-feedback systems, but we must be on guard against unnecessarily cluttering our formulation with the detail of discrete events that only obscure the momentum and continuity exhibited by our industrial systems.

In beginning, decisions should be formulated in the model as if they were continuously (but not implying instantaneously) responsive to the factors on which they are based. This means that decisions will not be formulated for intermittent reconsideration each week, month or year. For example, factory production capacity would vary continuously, not by discrete additions. Ordering would go on continuously, not monthly when the stock records are reviewed.

There are several reasons for recommending the initial formulation of a continuous model:

  • Real systems are more nearly continuous than is commonly supposed …
  • There will usually be considerable “aggregation” …
  • A continuous-flow system is usually an effective first approximation …
  • There is a natural tendency of model builders and executives to overstress the discontinuities of real situations. …
  • A continuous-flow model helps to concentrate attention on the central framework of the system. …
  • As a starting point, the dynamics of the continuous-flow model are usually easier to understand …
  • A discontinuous model, which is evaluated at infrequent intervals, such as an economic model solved for a new set of values annually, should never be justified by the fact that data in the real system have been collected at such infrequent intervals. …

These comments should never be construed as suggesting that the model builder should lack interest in the microscopic separate events that occur in a continuous-flow channel. The course of the continuous flow is the course of the separate events in it. By studying individual events we get a picture of how decisions are made and how the flows are delayed. The study of individual events is on of our richest sources of information about the way the flow channels of the model should be constructed. When a decision is actually being made regularly on a periodic basis, like once a month, the continuous-flow equivalent channel should contain a delay of half the interval; this represents the average delay encountered by information in the channel.

The preceding comments do not imply that discreteness is difficult to represent, nor that it should forever be excluded from a model. At times it will become significant. For example, it may create a disturbance that will cause system fluctuations that can be mistakenly interreted as externally generated cycles (…). When a model has progressed to the point where such refinements are justified, and there is reason to believe that discreteness has a significant influence on system behavior, discontinuous variables should then be explored to determine their effect on the model.

[Ellipses added – see the original for elaboration.]

Samuelson’s Multiplier Accelerator

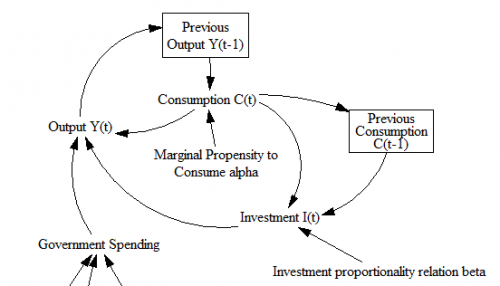
This is a fairly direct implementation of the multiplier-accelerator model from Paul Samuelson’s classic 1939 paper,

“Interactions between the Multiplier Analysis and the Principle of Acceleration” PA Samuelson – The Review of Economics and Statistics, 1939 (paywalled on JSTOR, but if you register you can read a limited number of publications for free)

SamuelsonDiagramB

This is a nice example of very early economic dynamics analyses, and also demonstrates implementation of discrete time notation in Vensim. Continue reading “Samuelson’s Multiplier Accelerator”

Environmental Homeostasis

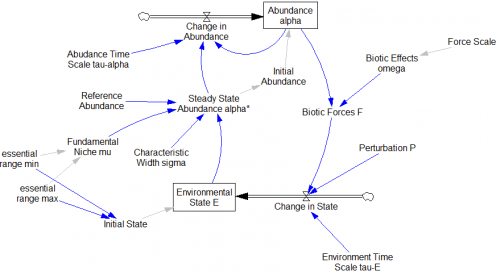
Replicated from

The Emergence of Environmental Homeostasis in Complex Ecosystems

The Earth, with its core-driven magnetic field, convective mantle, mobile lid tectonics, oceans of liquid water, dynamic climate and abundant life is arguably the most complex system in the known universe. This system has exhibited stability in the sense of, bar a number of notable exceptions, surface temperature remaining within the bounds required for liquid water and so a significant biosphere. Explanations for this range from anthropic principles in which the Earth was essentially lucky, to homeostatic Gaia in which the abiotic and biotic components of the Earth system self-organise into homeostatic states that are robust to a wide range of external perturbations. Here we present results from a conceptual model that demonstrates the emergence of homeostasis as a consequence of the feedback loop operating between life and its environment. Formulating the model in terms of Gaussian processes allows the development of novel computational methods in order to provide solutions. We find that the stability of this system will typically increase then remain constant with an increase in biological diversity and that the number of attractors within the phase space exponentially increases with the number of environmental variables while the probability of the system being in an attractor that lies within prescribed boundaries decreases approximately linearly. We argue that the cybernetic concept of rein control provides insights into how this model system, and potentially any system that is comprised of biological to environmental feedback loops, self-organises into homeostatic states.

See my related blog post for details.

Continue reading “Environmental Homeostasis”

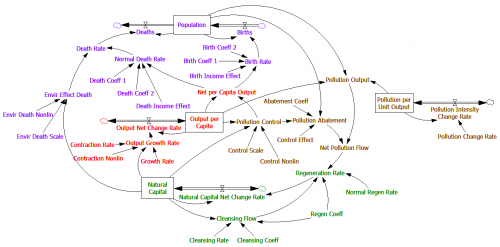
Wonderland

Wonderland model by Sanderson et al.; see Alexandra Milik, Alexia Prskawetz, Gustav Feichtinger, and Warren C. Sanderson, “Slow-fast Dynamics in Wonderland,” Environmental Modeling and Assessment 1 (1996) 3-17.

Here’s an excerpt from my 1998 critique of this model: Continue reading “Wonderland”