Dead buffalo diagrams

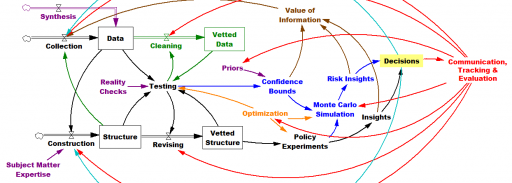
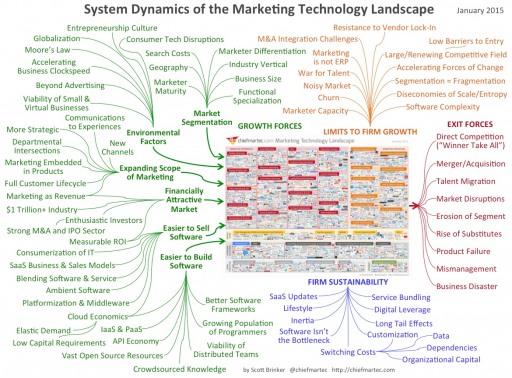
I think it was George Richardson who coined the term “dead buffalo” to refer to a diagram that surrounds a central concept with a hail of inbound causal arrows explaining it. This arrangement can be pretty useful as a list of things to think about, but it’s not much help toward solving a systemic problem from an endogenous point of view.

I recently found the granddaddy of them all:

dead_buffalo

Early economic dynamics: Samuelson's multiplier-accelerator

Paul Samuelson’s 1939 analysis of the multiplier-accelerator is a neat piece of work. Too bad it’s wrong.

Interestingly, this work dates from a time in which the very idea of a mathematical model was still questioned:

Contrary to the impression commonly held, mathematical methods properly employed, far from making economic theory more abstract, actually serve as a powerful liberating device enabling the entertainment and analysis of ever more realistic and complicated hypotheses.

Samuelson should be hailed as one of the early explorers of a very big jungle.

The basic statement of the model is very simple:

NationalIncome

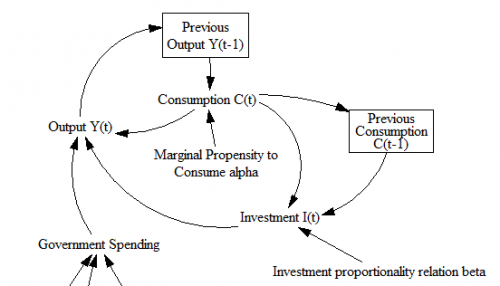
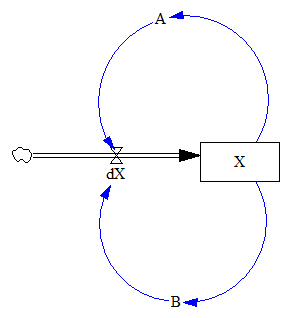
In quasi-System Dynamics notation, that looks like:

SamuelsonDiagramB

A caveat:

The limitations inherent in so simplified a picture as that presented here should not be overlooked. In particular, it assumes that the marginal propensity to consume and the relation are constants; actually these will change with the level of income, so that this representation is strictly a marginal analysis to be applied to the study of small oscillations. Nevertheless it is more general than the usual analysis.

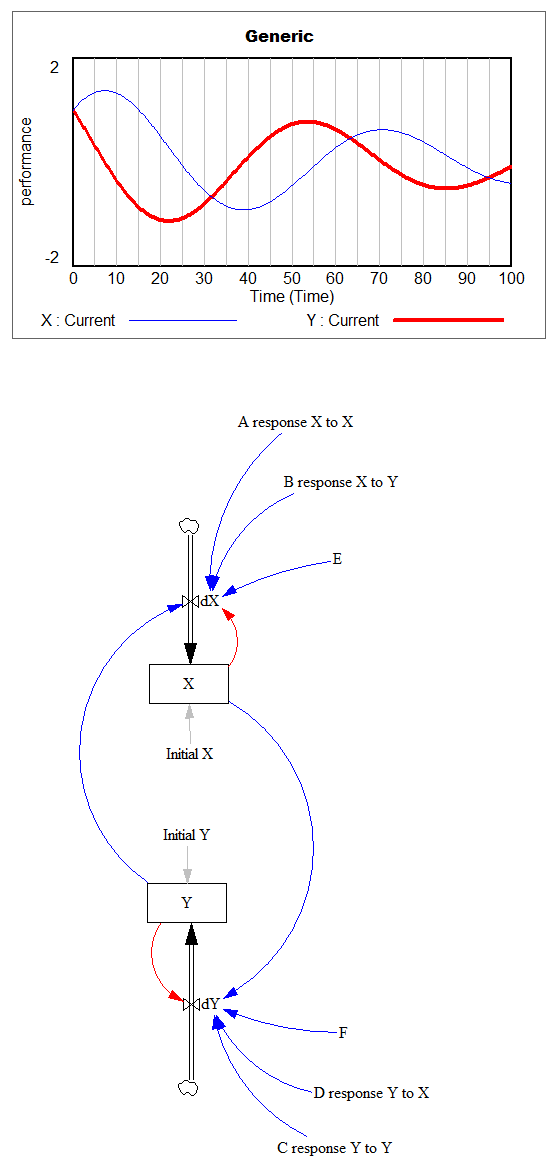
Samuelson hand-simulated the model (it’s fun – once – but he runs four scenarios):Simulated Samuelson then solves the discrete time system, to identify four regions with different behavior: goal seeking (exponential decay to a steady state), damped oscillations, unstable (explosive) oscillations, and unstable exponential growth or decline. He nicely maps the parameter space:

parameterSpace

ParamRegionBehaviorSo where’s the problem?

The first is not so much of Samuelson’s making as it is a limitation of the pre-computer era. The essential simplification of the model for analytic solution is;

Simplified

This is fine, but it’s incredibly abstract. Presented with this equation out of context – as readers often are – it’s almost impossible to posit a sensible description of how the economy works that would enable one to critique the model. This kind of notation remains common in econometrics, to the detriment of understanding and progress.

At the first SD conference, Gil Low presented a critique and reconstruction of the MA model that addressed this problem. He reconstructed the model, providing an operational description of the economy that remains consistent with the multiplier-accelerator framework.

LowThe mere act of crafting a stock-flow description reveals problem #1: the basic multiplier-accelerator doesn’t conserve stuff.

inventory1 InventoryCapital2Non-conservation of stuff leads to problem #2. When you do implement inventories and capital stocks, the period of multiplier-accelerator oscillations moves to about 2 decades – far from the 3-7 year period of the business cycle that Samuelson originally sought to explain. This occurs in part because the capital stock, with a 15-year lifetime, introduces considerable momentum. You simply can’t discover this problem in the original multiplier-accelerator framework, because too many physical and behavioral time constants are buried in the assumptions associated with its 2 parameters.

Low goes on to introduce labor, finding that variations in capacity utilization do produce oscillations of the required time scale.

ShortTermI think there’s a third problem with the approach as well: discrete time. Discrete time notation is convenient for matching a model to data sampled at regular intervals. But the economy is not even remotely close to operating in discrete annual steps. Moreover a one-year step is dangerously close to the 3-year period of the business cycle phenomenon of interest. This means that it is a distinct possibility that some of the oscillatory tendency is an artifact of discrete time sampling. While improper oscillations can be detected analytically, with discrete time notation it’s not easy to apply the simple heuristic of halving the time step to test stability, because it merely compresses the time axis or causes problems with implicit time constants, depending on how the model is implemented. Halving the time step and switching to RK4 integration illustrates these issues:

RK4

It seems like a no-brainer, that economic dynamic models should start with operational descriptions, continuous time, and engineering state variable or stock flow notation. Abstraction and discrete time should emerge as simplifications, as needed for analysis or calibration. The fact that this has not become standard operating procedure suggests that the invisible hand is sometimes rather slow as it gropes for understanding.

The model is in my library.

See Richardson’s Feedback Thought in Social Science and Systems Theory for more history.

Parameter Distributions

Answering my own question, here’s the distribution of all 12,000 constants from a dozen models, harvested from my hard drive. About half are from Ventana, and there are a few classics, like World3. All are policy models – no physics, biology, etc.

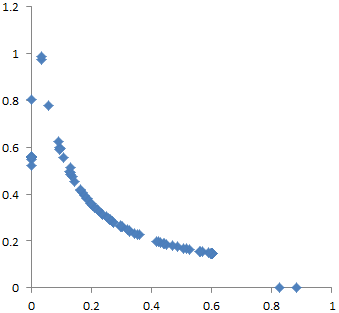
ParamDistThe vertical scale is magnitude, ABS(x). Values are sorted on the horizontal axis, so that negative values appear on the left. Incredibly, there were only about 60 negative values in the set. Clearly, unlike linear models where signs fall where they may, there’s a strong user preference for parameters with a positive sense.

Next comes a big block of 0s, which don’t show on the log scale. Most of the 0s are not really interesting parameters; they’re things like switches in subscript mapping, though doubtless some are real.

At the right are the positive values, ranging from about 10^-15 to 10^+15. The extremes are units converters and physical parameters (area of the earth). There are a couple of flat spots in the distribution – 1s (green arrow), probably corresponding with the 0s, though some are surely “interesting”, and years (i.e. things with a value of about 2000, blue arrow).

If you look at just the positive parameters, here’s the density histogram, in log10 magnitude bins:

PositiveParmDistAgain, the two big peaks are the 1s and the 2000s. The 0s would be off the scale by a factor of 2. There’s clearly some asymmetry – more numbers greater than 1 (magnitude 0) than less.

LogPositiveParamDistOne thing that seems clear here is that log-uniform (which would be a flat line on the last two graphs) is a bad guess.

What's the empirical distribution of parameters?

Vensim‘s answer to exploring ill-behaved problem spaces is either to do hill-climbing with random restarts, or MCMC and simulated annealing. Either way, you need to start with some initial distribution of points to search.

It’s helpful if that distribution is somehow efficient at exploring the interesting parts of the space. I think this is closely related to the problem of selecting uninformative priors in Bayesian statistics. There’s lots of research about appropriate uninformative priors for various kinds of parameters. For example,

  • If a parameter represents a probability, one might choose the Jeffreys or Haldane prior.
  • Indifference to units, scale and inversion might suggest the use of a log uniform prior, where nothing else is known about a positive parameter

However, when a user specifies a parameter in Vensim, we don’t even know what it represents. So what’s the appropriate prior for a parameter that might be positive or negative, a probability, a time constant, a scale factor, an initial condition for a physical stock, etc.?

On the other hand, we aren’t quite as ignorant as the pure maximum entropy derivation usually assumes. For example,

  • All numbers have to lie between the largest and smallest float or double, i.e. +/- 3e38 or 2e308.
  • More practically, no one scales their models such that a parameter like 6.5e173 would ever be required. There’s a reason that metric prefixes range from yotta to yocto (10^24 to 10^-24). The only constant I can think of that approaches that range is Avogadro’s number (though there are probably others), and that’s not normally a changeable parameter.
  • For lots of things, one can impose more constraints, given a little more information,
    • A time constant or delay must lie on [TIME STEP,infinity], and the “infinity” of interest is practically limited by the simulation duration.
    • A fractional rate of change similarly must lie on [-1/TIME STEP,1/TIME STEP] for stability
    • Other parameters probably have limits for stability, though it may be hard to discover them except by experiment.
    • A parameter with units of year is probably modern, [1900-2100], unless you’re doing Mayan archaeology or paleoclimate.

At some point, the assumptions become too heroic, and we need to rely on users for some help. But it would still be really interesting to see the distribution of all parameters in real models. (See next …)

Self-generated seasonal cycles

This time of year, systems thinkers should eschew sugar plum fairies and instead dream of Industrial Dynamics, Appendix N:

Self-generated Seasonal Cycles

Industrial policies adopted in recognition of seasonal sales patterns may often accentuate the very seasonality from which they arise. A seasonal forecast can lead to action that may cause fulfillment of the forecast. In closed-loop systems this is a likely possibility. The analysis of sales data in search of seasonality is fraught with many dangers. As discussed in Appendix F, random-noise disturbances contain a broad band of component frequencies. This means that any effort toward statistical isolation of a seasonal sales component will find some seasonality in the random disturbances. Should the seasonality so located lead to decisions that create actual seasonality, the process can become self-regenerative.

Self-induced seasonality appears to occur many places in American industry. Sometimes it is obvious and clearly recognized, and perhaps little can be done about it. An example of the obvious is the strong seasonality in items such as cameras sold in the Christmas trade. By bringing out new models and by advertising and other sales promotion in anticipation of Christmas purchases, the industry tends to concentrate its sales at this particular time of year.

Other kinds of seasonality are much less clear. Almost always when seasonality is expected, explanations can be found to justify whatever one believes to be true. A tradition can be established that a particular item sells better at a certain time of year. As this “fact” becomes more and more widely believed, it may tend to concentrate sales effort at the time when the customers are believed to wish to buy. This in turn still further heightens the sales at that particular time.

Retailer sales & e-commerce sales, from FRED


Announcing Leverage Networks

Leverage Networks is filling the gap left by the shutdown of Pegasus Communications:

We are excited to announce our new company, Leverage Networks, Inc. We have acquired most of the assets of Pegasus Communications and are looking forward to driving its reinvention.  Below is our official press release which provides more details. We invite you to visit our interim website at leveragenetworks.com to see what we have planned for the upcoming months. You will soon be able to access most of the existing Pegasus products through a newly revamped online store that offers customer reviews, improved categorization, and helpful suggestions for additional products that you might find interesting. Features and applications will include a calendar of events, a service marketplace, and community forums

As we continue the reinvention, we encourage suggestions, thoughts, inquiries and any notes on current and future products, services or resources that you feel support our mission of bringing the tools of Systems Thinking, System Dynamics, and Organizational Learning to the world.

Please share or forward this email to friends and colleagues and watch for future emails as we roll out new initiatives.

Thank you,

Kris Wile, Co-President

Rebecca Niles, Co-President

Kate Skaare, Director

LeverageNetworks

As we create the Leverage Networks platform, it is important that the entire community surrounding Organizational Learning, Systems Thinking and System Dynamics be part of the evolution. We envision a virtual space that is composed both archival and newly generated (by partners, community members) resources in our Knowledge Base, a peer-supported Service Marketplace where service providers (coaches, graphic facilitators, modelers, and consultants) can hang a virtual “shingle” to connect with new projects, and finally a fully interactive Calendar of events for webinars, seminars, live conferences and trainings.

If you are interested in working with us as a partner or vendor, please email partners@leveragenetworks.com

ISDC 2013 Capen quiz results

Participants in my Vensim mini-course at the 2013 System Dynamics Conference outperformed their colleagues from 2012 on the Capen Quiz (mean of 5 right vs. 4 last year).

5 right is well above the typical performance of the public, but sadly this means that few among us are destined to be CEOs, who are often wildly overconfident (console yourself – abject failure on the quiz can make you a titan of industry).

Take the quiz and report back!

Tasty Menu

From the WPI online graduate program and courses in system dynamics:

Truly a fine lineup!

Model quality: the missing link

A number of developments are making model quality control increasingly crucial.

  • Models are generally playing a wider role in policy debates. Efforts like the Climate CoLab are making models accessible to wide audiences for interactive use.
  • The use of automated stochastic optimization and exploratory modeling and analysis (EMA) is likely to take models into parts of their parameter spaces that the modeler herself has not explored.
  • Standards like SMILE/XMILE will make models and model components more reusable and shareable.

I think this could all come to a bad end, in which priesthoods are paid to develop competing models that are incomprehensible to the general public, thus reducing modeling to a sophisticated form of propaganda.

Fortunately, some elements of an antidote to this dystopia are at hand, including documentation standards and tools and languages for expressing Reality Checks on model behavior. But I think we need a lot more. For example,

  • Standards could include metadata standards, so that model components are self-documenting in ways that make it possible for users to easily discover their limitations.
  • EMA tools could be directed towards discovery of model problems before policy analysis commences.
  • Tools that present models online could expose their innards as well as results.
  • Languages are needed for meta-reality checks, that describe and test higher level assumptions like perfect foresight (or lack thereof).

Perhaps most importantly, model quality needs to become a pervasive part of the culture of model building and consumption in all disciplines.

The Temperature-System Dynamics feedback

The recurrent heat waves coincident with system dynamics conferences have led me to some new insights about the co-evolution of systems thinking and climate. I’m hoping that I can get a last minute plenary slot for this blockbuster finding.

A priori, it should be obvious that temperature and system dynamics are linked. Here’s my dynamic hypothesis:

This hardly requires proof, but nevertheless data fully confirm the relationships.

Most obviously, the SD conference always occurs in July, the hottest month. The 2011 conference in Washington DC was the hottest July ever in that locale.

In addition, the timing of major works in SD coincides with warm years near Boston, the birthplace of the field.

I think we can consider this hypothesis definitively proven. All that remains is to put policies in place to ensure the continued health of SD, in order to prevent a global climatic catastrophe.