Spot the health care smokescreen

A Tea Party presentation on health care making the rounds in Montana claims that life expectancy is a smoke screen, and it’s death rates we should be looking at. The implication is that we shouldn’t envy Japan’s longer life expectancy, because the US has lower death rates, indicating superior performance of our health care system.

Which metric really makes the most sense from a systems perspective?

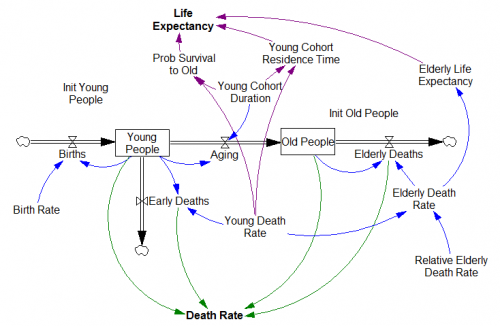
Here’s a simple, 2nd order model of life and death:

From the structure, you can immediately observe something important: life expectancy is a function only of parameters, while the death rate also includes the system states. In other words, life expectancy reflects the expected life trajectory of a person, given structure and parameters, while the aggregate death rate weights parameters (cohort death rates) by the system state (the distribution of population between old and young).

In the long run, the two metrics tell you the same thing, because the system comes into equilibrium such that the death rate is the inverse of the life expectancy. But people live a long time, so it might take decades or even centuries to achieve that equilibrium. In the meantime, the death rate can take on any value between the death rates of the young and old cohorts, which is not really helpful for understanding what a new person can expect out of life.

So, to the extent that health care performance is visible in the system trajectory at all, and not confounded by lifestyle choices, life expectancy is the metric that tells you about performance, and the aggregate death rate is the smokescreen.

Here’s the model: LifeExpectancyDeathRate.mdl or LifeExpectancyDeathRate.vpm

It’s initialized in equilibrium. You can explore disequilbrium situations by varying the initial population distribution (Init Young People & Init Old People), or testing step changes in the death rates.

False positives, publication bias and systems models

A PLOS Medicine paper asserts that most published results are false.

It can be proven that most claimed research findings are false

Corollary 1: The smaller the studies conducted in a scientific field, the less likely the research findings are to be true.

Corollary 2: The smaller the effect sizes in a scientific field, the less likely the research findings are to be true.

Corollary 3: The greater the number and the lesser the selection of tested relationships in a scientific field, the less likely the research findings are to be true.

Corollary 4: The greater the flexibility in designs, definitions, outcomes, and analytical modes in a scientific field, the less likely the research findings are to be true.

Corollary 5: The greater the financial and other interests and prejudices in a scientific field, the less likely the research findings are to be true.

Corollary 6: The hotter a scientific field (with more scientific teams involved), the less likely the research findings are to be true.

This somewhat alarming result arises from fairly simple statistics of false positives, publication selection bias, and causation vs. correlation problems. While the math is incontrovertible, some of the assumptions have been challenged:

… calculating the unreliability of the medical research literature, in whole or in part, requires more empirical evidence and different inferential models than were used. The claim that “most research findings are false for most research designs and for most fields” must be considered as yet unproven.

Still, the argument seems to be a matter of how much rather than whether publication bias influences findings:

We agree with the paper’s conclusions and recommendations that many medical research findings are less definitive than readers suspect, that P-values are widely misinterpreted, that bias of various forms is widespread, that multiple approaches are needed to prevent the literature from being systematically biased and the need for more data on the prevalence of false claims.

(Others propose similar challenges. There’s conflicting literature about whether (weak) observational studies hold up with (strong) randomized follow-up trials.)

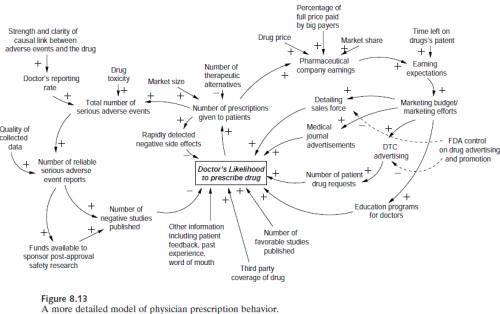
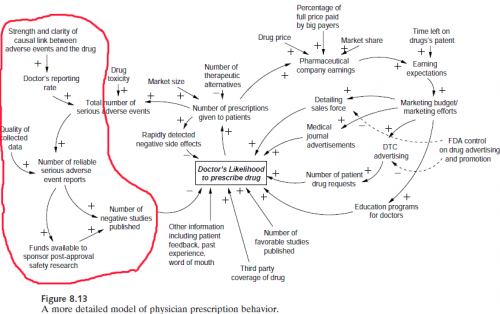
This is obviously a big problem from a control perspective, because the kind of information provided by the studies in question is key to managing many systems, as in Nancy Leveson‘s pharma safety example:
It’s also leads me to a rather pointed self-question. To what extent is typical system dynamics modeling practice subject to the same kinds of biases? Can we say not only that all models are wrong, but that most are useless?

First the good news.

  • SD doesn’t usually operate in the data mining space, where large observational studies seek effects absent any a priori causal theory. That means we’re not operating where false positives are most likely to arise.
  • Often, SD practitioners are not testing our own pet theories, but those of some decision makers – perhaps even theories of competing interests in an organization.
  • SD models play a “knowledge integration” role that’s somewhat analogous to meta-analysis. A meta-analysis pools the statistics from a number of replications of some observation, which improves the signal to noise ratio, making it easier to see whether there’s any baby in the bathwater. An SD model instead pools the effect sizes of inputs (studies or anecdotes) and puts them to a functional test: do the individual components, assembled into a system, yield the observed behavior of the macro system?
  • Similarly, good SD modelers tend to supplement purely statistical inputs with Reality Checks that effectively provide additional data verification by testing extreme conditions where outcomes are known (though this is not helpful if you don’t know anything about relationships to begin with).
  • Including physics (using the term loosely to include things like conservation of people) in models also greatly constrains the space of plausible hypotheses a priori.

Now the bad news.

  • Models are often used in one-off, non-replicable strategic decision making situations, so we’ll never know. Refereed forecasting helps, but success can still be due to luck rather than skill.
  • We often have to formalize soft variable concepts for which definitions are uncertain and measurements are lacking.
  • SD models are often reliant on thin literature bases, small studies, or subject matter expertise to establish relationships. Studies with randomized control are a rarity.
  • Available data for model verification is often of low quality and short duration.
  • Data can provide a weak check on the model – if a system exhibits exponential growth, for example, one positive feedback loop in the dynamic hypothesis is as good as another (though of course good a priori explanations of the structure of the system help).

My suspicion is that savvy modelers are already well aware of just how messy and uncertain their problem domains are. Decisions will be taken, with or without a model, so the real objective is to use the model to add value by rejecting ideas that don’t work. The problem then is not that wrong models make decisions worse, but that we could probably do a lot better if we could be smarter about the possible biases in models and thinking in general.

Alex Tabarrok at Marginal Revolution has a nice take on remedies:

What can be done about these problems? (Some cribbed straight from Ioannidis and some my own suggestions.)

1) In evaluating any study try to take into account the amount of background noise. That is, remember that the more hypotheses which are tested and the less selection which goes into choosing hypotheses the more likely it is that you are looking at noise.

2) Bigger samples are better. (But note that even big samples won’t help to solve the problems of observational studies which is a whole other problem).

3) Small effects are to be distrusted.

4) Multiple sources and types of evidence are desirable.

5) Evaluate literatures not individual papers.

6) Trust empirical papers which test other people’s theories more than empirical papers which test the author’s theory.

7) As an editor or referee, don’t reject papers that fail to reject the null.

For SD modeling, I’d add a few more:

8) Reserve time for exploration of uncertainty (lots of Monte Carlo simulation).

9) Calibrate your confidence bounds.

10) Help clients to appreciate the extent and implications of uncertainty.

11) Pay attention to the language used to describe statistical concepts. Words like “expectation” and “significance” that have specific mathematical interpretations don’t mean the same thing to managers.

11) Look for robust policies that work irrespective of uncertain relationships.

12) Explicitly seek out and test alternative hypotheses (This sounds like it’s at odds with Corollary 3 above, but I think it’s the right thing to do. Testing multiple hypotheses in the context of the model is not the same thing as mining data for multiple relationships.).

13) If you can’t estimate something directly from data, or back it up with literature (more than a single paper), at least articulate some bounds on the effect, perhaps through experiments with a submodel.

What do you think? When is modeling and statistical analysis helpful, and when is it risky business?



Thinking systemically about safetey

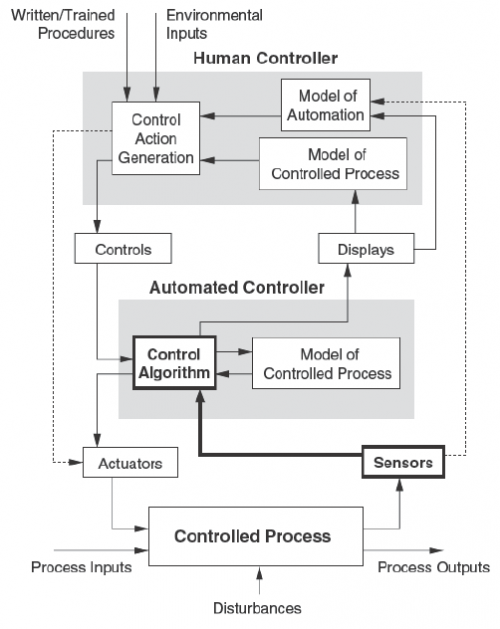
Accidents involve much more than the reliability of parts. Safety emerges from the systemic interactions of devices, people and organizations. Nancy Leveson’s Engineering a Safer World (free pdf currently at the MIT press link, lower left) picks up many of the threads in Perrow’s classic Normal Accidents, plus much more, and weaves them into a formal theory of systems safety. It comes to life with many interesting examples and prescriptions for best practice.

So far, I’ve only had time to read this the way I read the New Yorker (cartoons first), but a few pictures give a sense of the richness of systems perspectives that are brought to bear on the problems of safety:

Leveson - Pharma safety
Leveson - Safety as control
Leveson - Aviation information flow
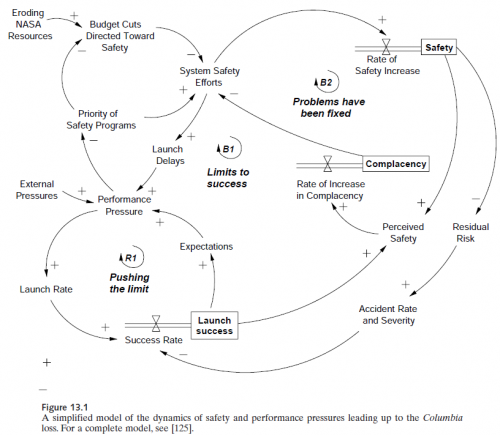
The contrast between the figure above and the one that follows in the book, showing links that were actually in place, is striking. (I won’t spoil the surprise – you’ll have to go look for yourself.)

Leveson - Columbia disaster

Facebook reloaded

Facebook trading opened with it’s IPO and closed at $105 billion market capitalization.

I wondered how my model tracked reality over the last six months.

Facebook stats put users at 901 million at the end of March. My maximum likelihood run was rather lower than that – it corresponds with the K950 run in my last post (saturation users of 950 million), and predicted 840M users for end of Q1 2012. The latest data point corresponds with my K1250 run. I’m not sure if it’s interesting or not, but the new data point is a bit of an outlier. For one thing, it’s reported to the nearest million at a precise time, not with aggressive rounding as in earlier numbers I’d found. Re-estimating the model with the new, precise data point, it’s necessary to pass on the high size over most of the data from 2008-2011. That seems a bit fishy – perhaps a change in reporting methods has occurred.

In any case, it hardly matters whether the user carrying capacity is a bit over or under a billion. Either way, the valuation with current revenue per user is on the order of $20 billion. I had picked $5/user/year based on past performance, which turned out to be very close to the 2011 actuals. It would take a 10-year ramp to 7x current revenue/user to justify current pricing, or very low interest rates and risk premiums.

So the real question is, can Facebook increase its revenue per user dramatically?

Another short sell opportunity?

“I have no interest in shorting a cultural phenomenon,” hedge fund manager Jeffrey Matthews of Ram Partners in Greenwich, Connecticut, told Reuters in an email interview.

Asked if this was because such stocks trade without regard to normal market valuation, he wrote back, “Bingo.”

Doing quality simulation research

Unless the Journal of Irreproducible Results is your target, you should check out this paper:

Rahmandad, H., Sterman J., (forthcoming). Reporting Guidelines for Simulation-based Research in Social Sciences

Abstract: Reproducibility of research is critical for the healthy growth and accumulation of reliable knowledge, and simulation-based research is no exception. However, studies show many simulation-based studies in the social sciences are not reproducible. Better standards for documenting simulation models and reporting results are needed to enhance the reproducibility of simulation-based research in the social sciences. We provide an initial set of Reporting Guidelines for Simulation-based Research (RGSR) in the social sciences, with a focus on common scenarios in system dynamics research. We discuss these guidelines separately for reporting models, reporting simulation experiments, and reporting optimization results. The guidelines are further divided into minimum and preferred requirements, distinguishing between factors that are indispensable for reproduction of research and those that enhance transparency. We also provide a few guidelines for improved visualization of research to reduce the costs of reproduction. Suggestions for enhancing the adoption of these guidelines are discussed at the end.

I should add that this advice isn’t just for the social sciences, nor just for research. Business and public policy models developed by consultants should be no less replicable, even if they remain secret. This is not only a matter of intellectual honesty; it’s a matter of productivity (documented components are easier to reuse) and learning (if you don’t keep track of what you do, you can’t identify and learn from mistakes when reality evolves away from your predictions).

This reminds me that I forgot to plug my annual advice on good writing for the SD conference:

I’m happy to report that the quality of papers in the thread I see was higher than usual (or at least the variance was lower – no plenary blockbuster, but also no dreadful, innumerate, ungrammatical horrors to wade through).

The vicious cycle of ignorance

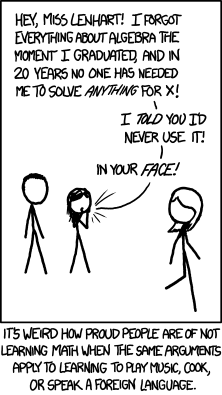
XKCD:

XKCD - Forgot Algebra

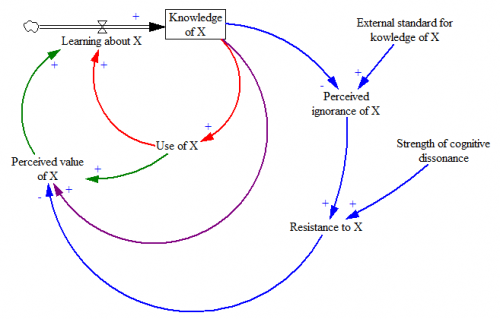
Here’s my quick take on the feedback structure behind this:

Knowledge of X (with X = algebra, cooking, …) is at the heart of a nest of positive feedback loops that make learning about X subject to vicious or virtuous cycles.

  • The more you know about X, the more you find opportunities to use it, and vice versa. If you don’t know calculus, you tend to self-select out of engineering careers, thus fulfilling the “I’ll never use it” prophecy. Through use, you learn by doing, and gain further knowledge.
  • Similarly, the more use you get out of X, the more you perceive it as valuable, and the more motivated you are to learn about it.
  • When you know more, you also may develop intrinsic interest or pride of craft in the topic.
  • When you confront some external standard for knowledge, and find yourself falling short, cognitive dissonance can kick in. Rather than thinking, “I really ought to up my game a bit,” you think, “algebra is for dorks, and those pointy-headed scientists are just trying to seize power over us working stiffs.”

I’m sure this could be improved on, for example by recognizing that attitudes are a stock.

Still, it’s easy to see here how algebra education goes wrong. In school, the red and green loops are weak, because there’s typically no motivating application more compelling than a word problem. Instead, there’s a lot of reliance on external standards (grades and testing), which encourages resistance.

A possible remedy therefore is to drive education with real-world projects, so that algebra emerges as a tool with an obvious need, emphasizing the red and green loops over the blue. An interesting real-world project might be self-examination of the role of the blue loop in our lives.


Bathtub Statistics

The pitfalls of pattern matching don’t just apply to intuitive comparisons of the behavior of associated stocks and flows. They also apply to statistics. This means, for example, that a linear regression like

stock = a + b*flow + c*time + error

is likely to go seriously wrong. That doesn’t stop such things from sneaking into the peer reviewed literature though. A more common quasi-statistical error is to take two things that might be related, measure their linear trends, and declare the relationship falsified if the trends don’t match. This bogus reasoning remains a popular pastime of climate skeptics, who ask, how could temperature go down during some period when emissions went up? (See this example.) This kind of naive naive statistical reasoning, with static mental models of dynamic phenomena, is hardly limited to climate skeptics though.

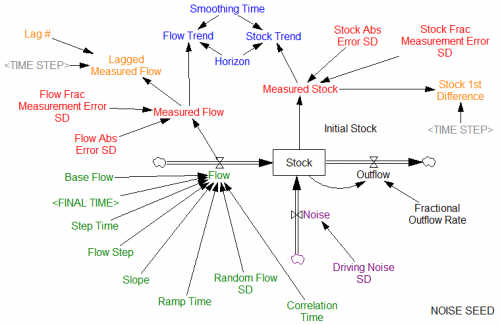
Given the dynamics, it’s actually quite easy to see how such things can occur. Here’s a more complete example of a realistic situation:

At the core, we have the same flow driving a stock. The flow is determined by a variety of test inputs , so we’re still not worrying about circular causality between the stock and flow. There is potentially feedback from the stock to an outflow, though this is not active by default. The stock is also subject to other random influences, with a standard deviation given by Driving Noise SD. We can’t necessarily observe the stock and flow directly; our observations are subject to measurement error. For purposes that will become evident momentarily, we might perform some simple manipulations of our measurements, like lagging and differencing. We can also measure trends of the stock and flow. Note that this still simplifies reality a bit, in that the flow measurement is instantaneous, rather than requiring its own integration process as physics demands. There are no complications like missing data or unequal measurement intervals.

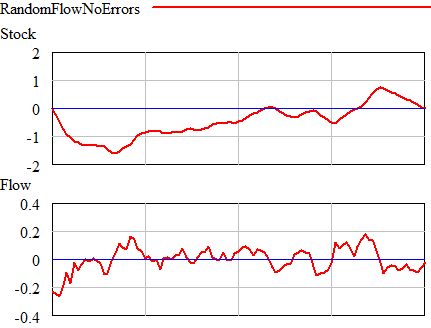
Now for an experiment. First, suppose that the flow is random (pink noise) and there are no measurement errors, driving noise, or outflows. In that case, you see this:

Once could actually draw some superstitious conclusions about the stock and flow time series above by breaking them into apparent episodes, but that’s quite likely to mislead unless you’re thinking explicitly about the bathtub. Looking at a stock-flow scatter plot, it appears that there is no relationship:
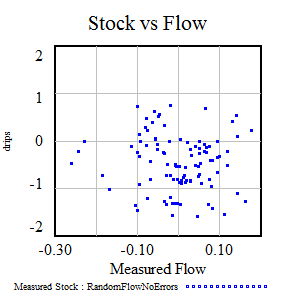
Of course, we know this is wrong because we built the model with perfect Flow->Stock causality. The usual statistical trick to reveal the relationship is to undo the integration by taking the first difference of the stock data. When you do that, plotting the change in the stock vs. the flow (lagged one period to account for the differencing), the relationship reappears: Continue reading “Bathtub Statistics”

Bathtub Dynamics

Failure to account for bathtub dynamics is a basic misperception of system structure, that occurs even in simple systems that lack feedback. Research shows that pattern matching, a common heuristic, leads even highly educated people to draw incorrect conclusions about systems as simple as the entry and exit of people in a store.

This can occur in any stock-flow system, which means that it’s ubiquitous. Here’s the basic setup:

Replace “Flow” and “Stock” with your favorite concepts – income and bank balance, sales rate and installed base, births and rabbits, etc. Obviously the flow causes the stock – by definition, the flow rate is the rate of change of the stock level. There is no feedback here; just pure integration, i.e. the stock accumulates the flow.

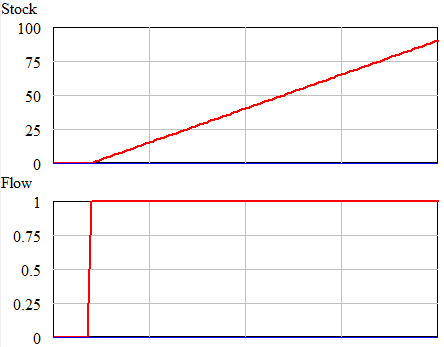
The pattern matching heuristic attempts to detect causality, or make predictions about the future, by matching the temporal patterns of cause and effect. So, naively, a pattern matcher expects to see a step in the stock in response to a step in the flow. But that’s not what happens:

Pattern matching fails because we shouldn’t expect the patterns to match through an integration. Above, the integral of the step ( flow = constant ) is a ramp ( stock = constant * time ). Other patterns are possible. For example, a monotonically decreasing cause (flow) can yield an increasing effect (stock), or even nonmonotonic behavior if it crosses zero: Continue reading “Bathtub Dynamics”

A Titanic feedback reversal

Ever get in a hotel shower and turn the faucet the wrong way, getting scalded or frozen as a result? It doesn’t help when the faucet is unmarked or backwards. If a new account is correct, that’s what happened to the Titanic.

(Reuters) – The Titanic hit an iceberg in 1912 because of a basic steering error, and only sank as fast as it did because an official persuaded the captain to continue sailing, an author said in an interview published on Wednesday.

“They could easily have avoided the iceberg if it wasn’t for the blunder,” Patten told the Daily Telegraph.

“Instead of steering Titanic safely round to the left of the iceberg, once it had been spotted dead ahead, the steersman, Robert Hitchins, had panicked and turned it the wrong way.”

Patten, who made the revelations to coincide with the publication of her new novel “Good as Gold” into which her account of events are woven, said that the conversion from sail ships to steam meant there were two different steering systems.

Crucially, one system meant turning the wheel one way and the other in completely the opposite direction.

Once the mistake had been made, Patten added, “they only had four minutes to change course and by the time (first officer William) Murdoch spotted Hitchins’ mistake and then tried to rectify it, it was too late.”

It sounds like the steering layout violates most of Norman’s design principles (summarized here):

  1. Use both knowledge in the world and knowledge in the head.
  2. Simplify the structure of tasks.
  3. Make things visible: bridge the Gulfs of Execution and Evaluation.
  4. Get the mappings right.
  5. Exploit the power of constraints, both natural and artificial.
  6. Design for error.
  7. When all else fails, standardize.

Notice that these are really all about providing appropriate feedback, mental models, and robustness.

(This is a repost from Sep. 22, 2010, for the 100 year anniversary).

Why learn calculus?

A young friend asked, why bother learning calculus, other than to get into college?

The answer is that calculus holds the keys to the secrets of the universe. If you don’t at least have an intuition for calculus, you’ll have a harder time building things that work (be they machines or organizations), and you’ll be prey to all kinds of crank theories. Of course, there are lots of other ways to go wrong in life too. Be grumpy. Don’t brush your teeth. Hang out in casinos. Wear white shoes after Labor Day. So, all is not lost if you don’t learn calculus. However, the world is less mystifying if you do.

The amazing thing is, calculus works. A couple of years ago, I found my kids busily engaged in a challenge, using a sheet of tinfoil of some fixed size to make a boat that would float as many marbles as possible. They’d managed to get 20 or 30 afloat so far. I surreptitiously went off and wrote down the equation for the volume of a rectangular prism, subject to the constraint that its area not exceed the size of the foil, and used calculus to maximize. They were flabbergasted when I managed to float over a hundred marbles on my first try.

The secrets of the universe come in two flavors. Mathematically, those are integration and differentiation, which are inverses of one another.

Continue reading “Why learn calculus?”