Don't just do something, stand there! Reflections on the counterintuitive behavior of complex systems, seen through the eyes of System Dynamics, Systems Thinking and simulation.
Continuing with the theme, I tried the department store problem out on ChatGPT. This is a common test of stock-flow reasoning, in which participants assess the peak stock of people in a store from data on the inflow and outflow.
I posed a simplified version of the problem:
Interestingly, I had intended to have 6 people enter at 8am, but I made a typo. ChatGPT did a remarkable job of organizing my data into exactly the form I’d doodled in my notebook, but then happily integrated to wind up with -2 people in the store at the end.
This is pretty cool, but it’s interesting that ChatGPT was happy to correct the number of people in the room, without making the corresponding correction to people leaving. That makes the table inconsistent.
We got there in the end, but I think ChatGPT’s enthusiasm for reality checks may be a little weak. Overall though I’d still say this is a pretty good demonstration of stock-flow reasoning. I’d be curious how humans would perform on the same problem.
Research indicates that insights about stock-flow management don’t necessarily generalize from one situation to another. People can fill their bathtubs without comprehending the federal debt or COVID prevalence.
The last sentence is a little tricky, but I think ChatGPT is assuming that the drain might not be at the bottom of the tub. Overall, I’d say the AI nailed this one.
This is close, but note that it’s suggesting that a decrease in emissions corresponds with a decrease in concentration. This is not necessarily true in general, due to the importance of emissions relative to removals. ChatGPT seems to recognize the issue, but fails to account for it completely in its answer. My parameter choice turned out to be a little unfortunate, because a 50% reduction in CO2 emissions is fairly close to the boundary between rising and falling CO2 concentrations in the future.
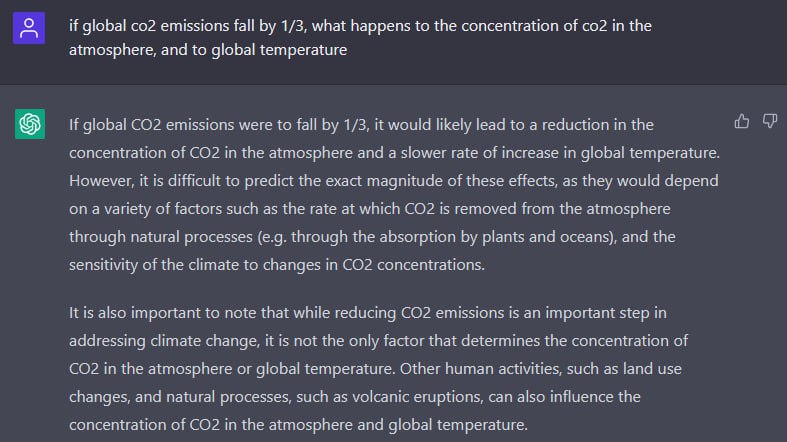
I asked again with a smaller reduction in emissions. This should have an unambiguous effect: emissions would remain above removals, so the CO2 concentration would continue to rise, but at a slower rate.
This time the answer is a little better, but it’s not clear whether “lead to a reduction in the concentration of CO2 in the atmosphere” means a reduction relative to what would have happened otherwise, or relative to today’s concentration. Interestingly, ChatGPT does get that the emissions reduction doesn’t reduce temperature directly; it just slows the rate of increase.
The flow of plastic bags into landfills is dramatically down from the 2005 rate. But the accumulation is up. This should be no surprise, because the structure of this system is:
The accumulation of bags in the landfill can only go up, because it has no outflow (though in reality there’s presumably some very slow rate of degradation). The integration in the stock renders intuitive pattern matching (flow down->stock down) incorrect.
Placing the flow and the stock on the same vertical scale, is also a bit misleading, because they’re apples and oranges – the flow of disposal has units of tons/year, while the accumulation has units of tons.
Also, initializing the stock to its 2005 value is a bit weird. If you integrate the disposal flow from 1980 (interpolating as needed), the accumulation is much more dramatic: about 36 million tons, by my eyeball.
The pitfalls of pattern matching don’t just apply to intuitive comparisons of the behavior of associated stocks and flows. They also apply to statistics. This means, for example, that a linear regression like
stock = a + b*flow + c*time + error
is likely to go seriously wrong. That doesn’t stop such things from sneaking into the peer reviewed literature though. A more common quasi-statistical error is to take two things that might be related, measure their linear trends, and declare the relationship falsified if the trends don’t match. This bogus reasoning remains a popular pastime of climate skeptics, who ask, how could temperature go down during some period when emissions went up? (See this example.) This kind of naive naive statistical reasoning, with static mental models of dynamic phenomena, is hardlylimited to climate skeptics though.
Given the dynamics, it’s actually quite easy to see how such things can occur. Here’s a more complete example of a realistic situation:
At the core, we have the same flow driving a stock. The flow is determined by a variety of test inputs, so we’re still not worrying about circular causality between the stock and flow. There is potentially feedback from the stock to an outflow, though this is not active by default. The stock is also subject to other random influences, with a standard deviation given by Driving Noise SD. We can’t necessarily observe the stock and flow directly; our observations are subject to measurement error. For purposes that will become evident momentarily, we might perform some simple manipulations of our measurements, like lagging and differencing. We can also measure trends of the stock and flow. Note that this still simplifies reality a bit, in that the flow measurement is instantaneous, rather than requiring its own integration process as physics demands. There are no complications like missing data or unequal measurement intervals.
Now for an experiment. First, suppose that the flow is random (pink noise) and there are no measurement errors, driving noise, or outflows. In that case, you see this:
Once could actually draw some superstitious conclusions about the stock and flow time series above by breaking them into apparent episodes, but that’s quite likely to mislead unless you’re thinking explicitly about the bathtub. Looking at a stock-flow scatter plot, it appears that there is no relationship:
Of course, we know this is wrong because we built the model with perfect Flow->Stock causality. The usual statistical trick to reveal the relationship is to undo the integration by taking the first difference of the stock data. When you do that, plotting the change in the stock vs. the flow (lagged one period to account for the differencing), the relationship reappears: Continue reading “Bathtub Statistics”
Failure to account for bathtub dynamics is a basic misperception of system structure, that occurs even in simple systems that lack feedback. Research shows that pattern matching, a common heuristic, leads even highly educated people to draw incorrect conclusions about systems as simple as the entry and exit of people in a store.
This can occur in any stock-flow system, which means that it’s ubiquitous. Here’s the basic setup:
Replace “Flow” and “Stock” with your favorite concepts – income and bank balance, sales rate and installed base, births and rabbits, etc. Obviously the flow causes the stock – by definition, the flow rate is the rate of change of the stock level. There is no feedback here; just pure integration, i.e. the stock accumulates the flow.
The pattern matching heuristic attempts to detect causality, or make predictions about the future, by matching the temporal patterns of cause and effect. So, naively, a pattern matcher expects to see a step in the stock in response to a step in the flow. But that’s not what happens:
Pattern matching fails because we shouldn’t expect the patterns to match through an integration. Above, the integral of the step ( flow = constant ) is a ramp ( stock = constant * time ). Other patterns are possible. For example, a monotonically decreasing cause (flow) can yield an increasing effect (stock), or even nonmonotonic behavior if it crosses zero: Continue reading “Bathtub Dynamics”
Danger lurks in the bathtub – not just slips, falls, and Norman Bates, but also bad model formulations.
A while ago, after working with my kids to collect data on our bathtub, I wrote My bathtub is nonlinear.
We grabbed a sheet of graph paper, fat pens, a yardstick, and a stopwatch and headed for the bathtub. …
When the tub was full, we made a few guesses about how long it might take to empty, then started the clock and opened the drain. Every ten or twenty seconds, we’d stop the timer, take a depth reading, and plot the result on our graph. …
To my astonishment, the resulting plot showed a perfectly linear decline in water depth, all the way to zero (as best we could measure). In hindsight, it’s not all that strange, because the tub tapers at the bottom, so that a constant linear decline in the outflow rate corresponds with the declining volumetric flow rate you’d expect (from decreasing pressure at the outlet as the water gets shallower). Still, I find it rather amazing that the shape of the tub (and perhaps nonlinearity in the drain’s behavior) results in such a perfectly linear trajectory.
It turns out that my attribution of the linear time vs. depth profile was sloppy – the behavior has a little to do with tub shape, and a lot to do with nonlinearity in the draining behavior. In a nice brief from the SD conference, Pål Davidsen, Erling Moxnes, Mauricio Munera Sánchez and David Wheat explain why:
… in the 16th century the Italian scientist Evangelista Torricelli found the relationship between water height and outflow to be nonlinear.
… Torricelli may have reasoned as follows. Let a droplet of water fall frictionless outside the tank from the same height … as the surface of the water. Gravitation will make the droplet accelerate. As the droplet passes the bottom of the tank, its kinetic energy will equal the loss of potential energy … Reorganizing this equation Torricelli found the following nonlinear expression for speed as a function of height
v = SQRT(2*g*h)
Then Torricelli moved inside the tank and reasoned that the same must apply there. …
Assuming that the water tank is a cylinder with straight walls … The outflow is given by the square root of volume; it is not a linear function of volume.
– “A note on the bathtub analogy,” ISDC 2011; final proceedings aren’t online yet but presumably will be here eventually.
In hindsight, this ought to have been obvious to me, because bathtubs clearly don’t exhibit the heavy-right-tail behavior of a first order linear draining process. The difference matters:
The bathtub analogy has been used extensively to illustrate stock and flow relationships. Because this analogy is frequently used, System Dynamicists should be aware that the natural outflow of water from a bathtub is a nonlinear function of water volume. A questionnaire suggests that students with one year or more of System Dynamics training tend to assume a linear relationship when asked to model a water outflow driven by gravity. We present Torricelli’s law for the outflow and investigate the error caused by assuming linearity. We also construct an “inverted funnel” which does behave like a linear system. We conclude by pointing out that the nonlinearity is of no importance for the usefulness of bathtubs or funnels as analogies. On the other hand, simplified analogies could make modellers overconfident in linear formulations and not able to address critical remarks from physicists or other specialists.
I’ve been doing SD for over two decades, and have the physical science background to know better, but found it a little too easy to assume a linear bathtub as a mental model, without inquiring very deeply when confronted with disconfirming data. For me, this is a nice cautionary lesson, that we forget the roots of system dynamics in engineering at our own peril.
We report experiments assessing people’s intuitive understanding of climate change. We presented highly educated graduate students with descriptions of greenhouse warming drawn from the IPCC’s nontechnical reports. Subjects were then asked to identify the likely response to various scenarios for CO2 emissions or concentrations. The tasks require no mathematics, only an understanding of stocks and flows and basic facts about climate change. Overall performance was poor. Subjects often select trajectories that violate conservation of matter. Many believe temperature responds immediately to changes in CO2 emissions or concentrations. Still more believe that stabilizing emissions near current rates would stabilize the climate, when in fact emissions would continue to exceed removal, increasing GHG concentrations and radiative forcing. Such beliefs support wait and see policies, but violate basic laws of physics.
The climate bathtubs are really a chain of stock processes: accumulation of CO2 in the atmosphere, accumulation of heat in the global system, and accumulation of meltwater in the oceans. How we respond to those, i.e. our emissions trajectory, is conditioned by some additional bathtubs: population, capital, and technology. This post is a quick look at the first.
I’ve grabbed the population sector from the World3 model. Regardless of what you think of World3’s economics, there’s not much to complain about in the population sector. It looks like this:
World3 population sector
People are categorized into young, reproductive age, working age, and older groups. This 4th order structure doesn’t really capture the low dispersion of the true calendar aging process, but it’s more than enough for understanding the momentum of a population. If you think of the population in aggregate (the sum of the four boxes), it’s a bathtub that fills as long as births exceed deaths. Roughly tuned to history and projections, the bathtub fills until the end of the century, but at a diminishing rate as the gap between births and deaths closes:
Notice that the young (blue) peak in 2030 or so, long before the older groups come into near-equilibrium. An aging chain like this has a lot of momentum. A simple experiment makes that momentum visible. Suppose that, as of 2010, fertility suddenly falls to slightly below replacement levels, about 2.1 children per couple. (This is implemented by changing the total fertility lookup). That requires a dramatic shift in birth rates:
However, that doesn’t translate to an immediate equilibrium in population. Instead,population still grows to the end of the century, but reaching a lower level. Growth continues because the aging chain is internally out of equilibrium (there’s also a small contribution from ongoing extension of life expectancy, but it’s not important here). Because growth has been ongoing, the demographic pyramid is skewed toward the young. So, while fertility is constant per person of child-bearing age, the population of prospective parents grows for a while as the young grow up, and thus births continue to increase. Also, at the time of the experiment, the elderly population has not reached equilibrium given rising life expectancy and growth down the chain.
Achieving immediate equilibrium in population would require a much more radical fall in fertility, in order to bring births immediately in line with deaths. Implementing such a change would require shifting yet another bathtub – culture – in a way that seems unlikely to happen quickly. It would also have economic side effects. Often, you hear calls for more population growth, so that there will be more kids to pay social security and care for the elderly. However, that’s not the first effect of accelerated declines in fertility. If you look at the dependency ratio (the ratio of the very young and old to everyone else), the first effect of declining fertility is actually a net benefit (except to the extent that young children are intrinsically valued, or working in sweatshops making fake Gucci wallets):
The bottom line of all this is that, like other bathtubs, it’s hard to change population quickly, partly because of the physics of accumulation of people, and partly because it’s hard to even talk about the culture of fertility (and the economic factors that influence it). Population isn’t likely to contribute much to meeting 2020 emissions targets, but it’s part of the long game. If you want to win the long game, you have to anticipate long delays, which means getting started now.


 The accumulation of bags in the landfill can only go up, because it has no outflow (though in reality there’s presumably some very slow rate of degradation). The integration in the stock renders
 Once could actually draw some superstitious conclusions about the stock and flow time series above by breaking them into apparent episodes, but that’s quite likely to mislead unless you’re thinking explicitly about the bathtub. Looking at a stock-flow scatter plot, it appears that there is no relationship:


