Limits and Markets

Almost fifty years ago, economists claimed that markets would save us from Limits to Growth. Here’s William Nordhaus, writing about World Dynamics in Measurement without Data (1973):

How’s that working out? I would argue, not well.

Certainly there are functional markets for commodities like oil and gas, but even then a substantial share of the resources are allocated by myopic regulators captive to industry interests.

But for practically everything else, the markets that would in theory allocate across resources, time and space simply don’t exist, even today.

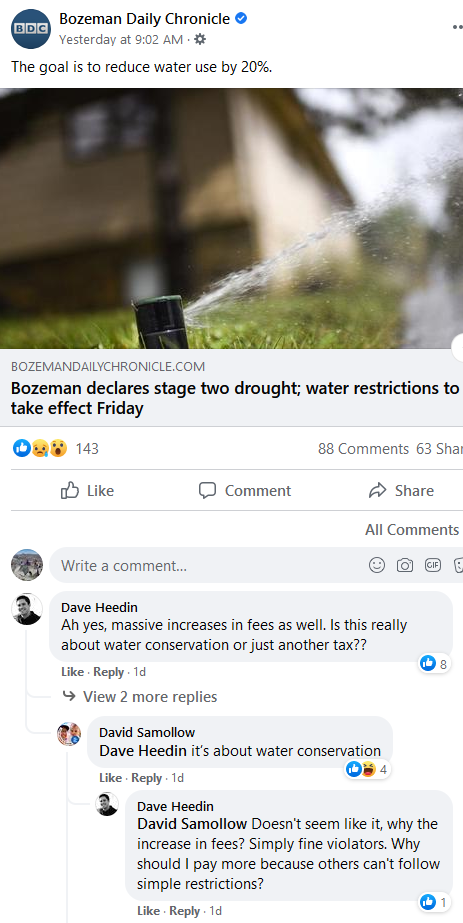
Water markets haven’t prevented the decline of Lake Mead, and they’re resisted widely, including here in Bozeman:

Joseph Stiglitz explained in the WSJ:

A similar pattern could unfold again. But economic forces alone may not be able to fix the problems this time around. Societies as different as the U.S. and China face stiff political resistance to boosting water prices to encourage efficient use, particularly from farmers. …

This troubles some economists who used to be skeptical of the premise of “The Limits to Growth.” As a young economist 30 years ago, Joseph Stiglitz said flatly: “There is not a persuasive case to be made that we face a problem from the exhaustion of our resources in the short or medium run.”

Today, the Nobel laureate is concerned that oil is underpriced relative to the cost of carbon emissions, and that key resources such as water are often provided free. “In the absence of market signals, there’s no way the market will solve these problems,” he says. “How do we make people who have gotten something for free start paying for it? That’s really hard. If our patterns of living, our patterns of consumption are imitated, as others are striving to do, the world probably is not viable.”

What is the price of declining rainforests, reefs or insects? What would markets quote for killing a bird with neonicotinoids, or a wind turbine, or for your Italian songbird pan-fry? What do gravel pits pay for dust and noise emissions, and what will autonomous EVs pay for increased congestion? The answer is almost universally zero. Even things that have received much attention, like emissions of greenhouse gases and criteria air pollutants, are free in most places.

These public goods aren’t free because they’re abundant or unimportant. They’re free because there are no property rights for them, and people resist creating the market mechanisms needed. Everyone loves the free market, until it applies to them. This might be OK if other negative feedback mechanisms picked up the slack, but those clearly aren’t functioning sufficiently either.

Lake Mead and incentives

Since I wrote about Lake Mead ten years ago (1 2 3), things have not improved. It’s down to 1068 feet, holding fairly steady after a brief boost in the wet year 2011-12. The Reclamation outlook has it losing another 60 feet in the next two years.

The stabilization has a lot to do with successful conservation. In Phoenix, for example, water use is down even though population is up. Some of this is technology and habits, and some of it is banishment of “useless grass” and other wasteful practices. MJ describes water cops in Las Vegas:

Investigator Perry Kaye jammed the brakes of his government-issued vehicle to survey the offense. “Uh oh this doesn’t look too good. Let’s take a peek,” he said, exiting the car to handle what has become one of the most existential violations in drought-stricken Las Vegas—a faulty sprinkler.

“These sprinklers haven’t popped up properly, they are just oozing everywhere,” muttered Kaye. He has been policing water waste for the past 16 years, issuing countless fines in that time. “I had hoped I would’ve worked myself out of a job by now. But it looks like I will retire first.”

Enforcement undoubtedly helps, but it strikes me as a band-aid where a tourniquet is needed. While the city is out checking sprinklers, people are free to waste water in a hundred less-conspicuous ways. That’s because standards say “conserve” but the market says “consume” – water is still cheap. As long as that’s true, technology improvements are offset by rebound effects.

Often, cheap water is justified as an equity issue: the poor need low-cost water. But there’s nothing equitable about water rates. The symptom is in the behavior of the top users:

Total and per-capita water use in Southern Nevada has declined over the last decade, even as the region’s population has increased by 14%. But water use among the biggest water users — some of the valley’s wealthiest, most prominent residents — has held steady.

The top 100 residential water users serviced by the Las Vegas Valley Water District used more than 284 million gallons of water in 2018 — over 11 million gallons more than the top 100 users of 2008 consumed at the time, records show. …

Properties that made the top 100 “lists” — which the Henderson and Las Vegas water districts do not regularly track, but compiled in response to records requests — consumed between 1.39 million gallons and 12.4 million gallons. By comparison, the median annual water consumption for a Las Vegas water district household was 100,920 gallons in 2018.

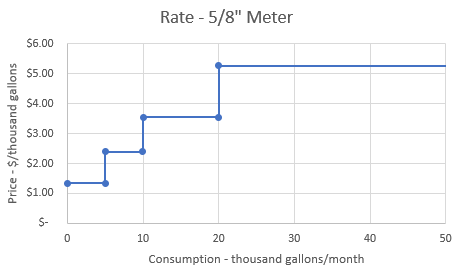
In part, I’m sure the top 100 users consume 10 to 100x as much water as the median user because they have 10 to 100x as much money (or more). But this behavior is also baked into the rate structure. At first glance, it’s nicely progressive, like the price tiers for a 5/8″ meter:

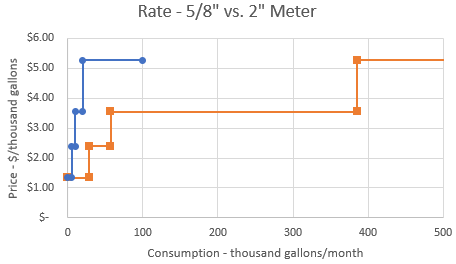
A top user (>20k gallons a month) pays almost 4x as much as a first-tier user (up to 5k gallons a month). But … not so fast. There’s a huge loophole. High users can buy down the rate by installing a bigger meter. That means the real rate structure looks like this:

A high user can consume 20x as much water with a 2″ meter before hitting the top rate tier. There’s really no economic justification for this – transaction costs and economies of scale are surely tiny compared to these discounts. The seller (the water district) certainly isn’t trying to push more sales to high-volume users to make a profit.

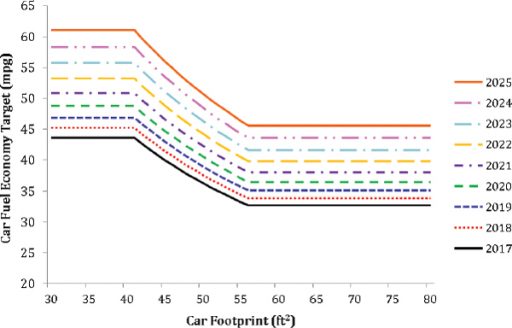
To me, this looks a lot like CAFE, which allocates more fuel consumption rights to vehicles with larger footprints, and Energy Star, which sets a lower bar for larger refrigerators. It’s no wonder that these policies have achieved only modest gains over multiple decades, while equity has worsened. Until we’re willing to align economic incentives with standards, financing and other measures, I fear that we’re just not serious enough to solve water or energy problems. Meanwhile, exhorting virtue is just a way to exhaust altruism.

Election Fraud and Benford’s Law

Statistical tests only make sense when the assumed distribution matches the data-generating process.

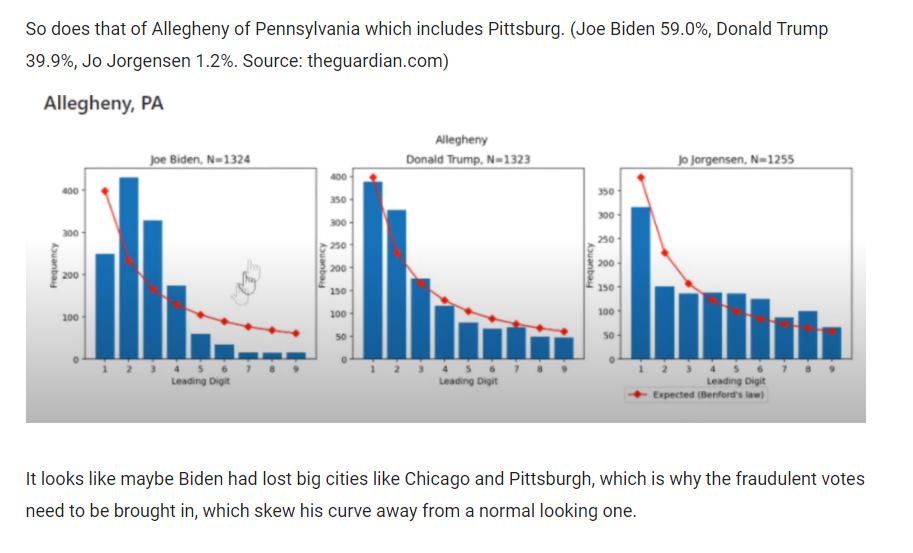
There are several analyses going around that purport to prove election fraud in PA, because the first digits of vote counts don’t conform to Benford’s Law. Here’s the problem: first digits of vote counts aren’t expected to conform to Benford’s Law. So, you might just as well say that election fraud is proved by Newton’s 3rd Law or Godwin’s Law.

Example of bogus conclusions from naive application of Benford’s Law.

Benford’s Law describes the distribution of first digits when the set of numbers evaluated derives from a scale-free or Power Law distribution spanning multiple orders of magnitude. Lots of processes generate numbers like this, including Fibonacci numbers and things that grow exponentially. Social networks and evolutionary processes generate Zipf’s Law, which is Benford-conformant.

Here’s the problem: vote counts may not have this property. Voting district sizes tend to be similar and truncated above (dividing a jurisdiction into equal chunks), and vote proportions tend to be similar due to gerrymandering and other feedback processes. This means the Benford’s Law assumptions are violated, especially for the first digit.

This doesn’t mean the analysis can’t be salvaged. As a check, look at other elections for the same region. Check the confidence bounds on the test, rather than simply plotting the sample against expectations. Examine the 2nd or 3rd digits to minimize truncation bias. Best of all, throw out Benford and directly simulate a distribution of digits based on assumptions that apply to the specific situation. If what you’re reading hasn’t done these things, it’s probably rubbish.

This is really no different from any other data analysis problem. A statistical test is meaningless, unless the assumptions of the test match the phenomena to be tested. You can’t look at lightning strikes the same way you look at coin tosses. You can’t use ANOVA when the samples are non-Normal, or have unequal variances, because it assumes Normality and equivariance. You can’t make a linear fit to a curve, and you can’t ignore dynamics. (Well, you can actually do whatever you want, but don’t propose that the results mean anything.)

CAFE and Policy Resistance

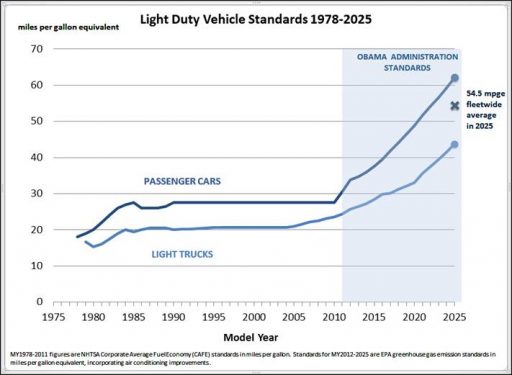
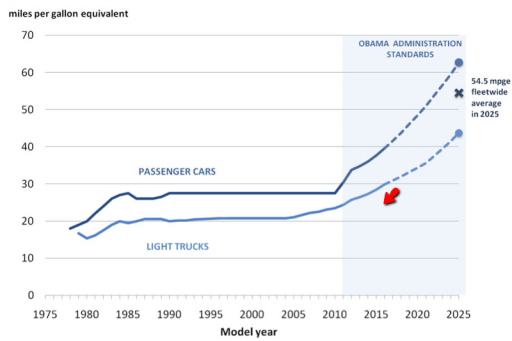
In 2011, the White House announced big increases in CAFE fuel economy standards.

The result has been counterintuitive. But before looking at the outcome, let me correct a misconception. The chart above refers to the “fleetwide average” – but this is the new vehicle fleetwide average, not the average of vehicles on the road. Of course it is the latter that matters for CO2 emissions and other outcomes. The on-the-road average lags the standards by a long time, because the fleet turns over slowly, due to the long lifetime of vehicles. It’s worse than that, because actual performance lags the standards due to loopholes and measurement issues. The EPA puts the 2017 model year here:

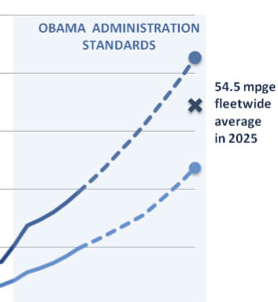
But wait … it’s still worse than that. Notice that the future fleetwide average is closer to the car standard than to the truck standard:

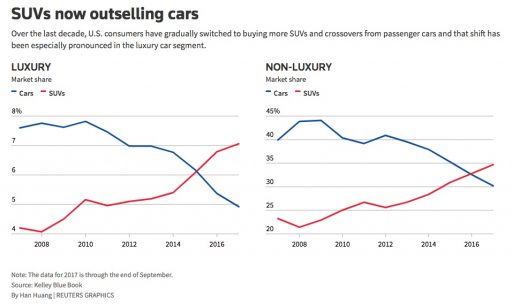
That implies that the market share of cars is more than 50%. But look what’s been happening:

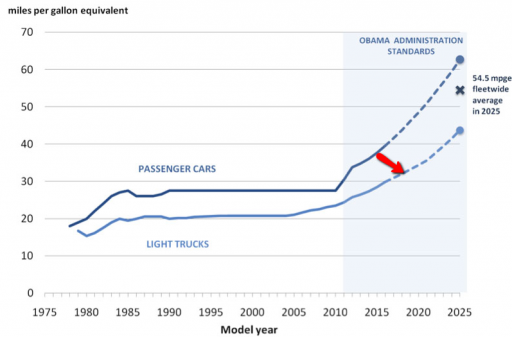
The market share of cars is collapsing. (If you look at longer series, it looks like the continuation of a long slide.) Presumably this is because, faced with consumer appetites guided by cheap gas and a standards gap between cars and trucks, automakers are doing the rational thing: they’re dumping their cars fleets and switching to trucks and SUVs. In other words, they’re moving from the upper curve to the less-constrained lower curve:

It’s actually worse than that, because within each vehicle class, EPA uses a footprint methodology that essentially assigns greater emissions property rights to larger vehicles.

So, while the CAFE standards seemingly require higher performance, they simultaneously incentivize behavioral responses that offset much of the improvement. The NRC actually wondered if this would happen when it evaluated CAFE about 5 years ago.

Three outcomes related to the size of vehicles in the fleet are possible due to the regulations: Manufacturers could change the size of individual vehicles, they could change the mix of vehicle sizes in their portfolio (i.e., more large cars relative to small cars), or they could change the mix of cars and light trucks.

I think it’s safe to say that yes, we’re seeing exactly these effects in the US fleet. That makes aggregate progress on emissions rather glacial. Transportation emissions are currently rising, interrupted only by the financial crisis. That’s because we’re not working all the needed leverage points in the system. We have one rule (CAFE) and technology (EVs) but we’re not doing anything about prices (carbon tax) or preferences (e.g., walkable cities). We need a more comprehensive approach if we’re going to beat the unintended consequences.

Emissions Pricing vs. Standards

You need an emissions price in your portfolio to balance effort across all tradeoffs in the economy.

The energy economy consists of many tradeoffs. Some of these are captured in the IPAT framework:

Emissions 
= Population x GDP per Capita x Energy per GDP x Emissions per Energy

IPAT shows that, to reduce emisisons, there are multiple points of intervention. One could, for example, promote lower energy intensity, or reduce the carbon intensity of energy, or both.

An ideal policy, or portfolio of policies, would:

  • Cover all the bases – ensure that no major opportunity is left unaddressed.
  • Balance the effort – an economist might express this as leveling the shadow prices across areas.

We have a lot of different ways to address each tradeoff: tradeable permits, taxes, subsidies, quantity standards, performance standards, command-and-control, voluntary limits, education, etc. So far, in the US, we have basically decided that taxes are a non-starter, and instead pursued subsidies and tax incentives, portfolio and performance standards, with limited use of tradeable permits.

Here’s the problem with that approach. You can decompose the economy a lot more than IPAT does, into thousands of decisions that have energy consequences. I’ve sampled a tiny fraction below.

Is there an incentive?

Decision Standards Emissions Price
Should I move to the city or the suburbs? No  Yes
Should I telecommute? No  Yes
Drive, bike, bus or metro today? No  Yes
Car, truck or SUV? No (CAFE gets this wrong)  Yes
Big SUV or small SUV? CAFE (again)  Yes
Gasoline, diesel, hybrid or electric? ZEV, tax credits  Yes
Regular or biofuel? LCFS, CAFE credits  Yes
Detached house or condo? No  Yes
Big house or small? No  Yes
Gas or heat pump? No  Yes
High performance building envelope or granite countertops? Building codes (lowest common denominator)  Yes
Incandescent or LED lighting? Bulb Ban  Yes
LEDs are cheap – use more? No  Yes
Get up to turn out an unused light? No  Yes
Fridge: top freezer, bottom freezer or side by side? No  Yes
Efficient appliances? Energy Star (badly)  Yes
Solar panels? Building codes, net metering, tax credits, cap & trade  Yes
Green electricity? Portfolio standards  Yes
2 kids or 8? No  Yes

The beauty of an emissions price – preferably charged at the minemouth and wellhead – is that it permeates every economic aspect of life. The extent to which it does so depends on the emissions intensity of the subject activity – when it’s high, there’s a strong price signal, and when it’s low, there’s a weak signal, leaving users free to decide on other criteria. But the signal is always there. Importantly, the signal can’t be cheated: you can fake your EPA mileage rating – for a while – but it’s hard to evade costs that arrive packaged with your inputs, be they fuel, capital, services or food.

The rules and standards we have, on the other hand, form a rather moth-eaten patchwork. They cover a few of the biggest energy decisions with policies like renewable portfolio standards for electricity. Some of those have been pretty successful at lowering emissions. But others, like CAFE and Energy Star, are deficient or perverse in a variety of ways. As a group, they leave out a number of decisions that are extremely consequential. Effort is by no means uniform – what is the marginal cost of a ton of carbon avoided by CAFE, relative to a state’s renewable energy portfolio? No one knows.

So, how is the patchwork working? Not too well, I’d say. Some, like the CAFE standard, have been diluted by loopholes and stalled due to lack of political will:

BTS

Others are making some local progress. The California LCFS, for example, has reduced carbon intensity of fuels 3.5% since authorization by AB32 in 2006:

ARB

But the LCFS’ progress has been substantially undone by rising vehicle miles traveled (VMT). The only thing that put a real dent in driving was the financial crisis:

AFDC

Caltrans


In spite of this, the California patchwork has worked – it has reached its GHG reduction target:
SF Chronicle

This is almost entirely due to success in the electric power sector. Hopefully, there’s more to come, as renewables continue to ride down their learning curves. But how long can the power sector carry the full burden? Not long, I think.

The problem is that the electricity supply side is the “easy” part of the problem. There are relatively few technologies and actors to worry about. There’s a confluence of federal and state incentives. The technology landscape is favorable, with cost-effective emerging technologies.

The technology landscape for clean fuels is not easy. That’s why LCFS credits are trading at $195/ton while electricity cap & trade allowances are at $16/ton. The demand side has more flexibility, but it is technically diverse and organizationally fragmented (like the questions in my table above), making it harder to regulate. Problems are coupled: getting people out of their cars isn’t just a car problem; it’s a land use problem. Rebound effects abound: every LED light bulb is just begging to be left on all the time, because it’s so cheap to do so, and electricity subsidies make it even cheaper.

Command-and-control regulators face an unpleasant choice. They can push harder and harder in a few major areas, widening the performance gap – and the shadow price gap – between regulated and unregulated decisions. Or, they can proliferate regulations to cover more and more things, increasing administrative costs and making innovation harder.

As long as economic incentives scream that the price of carbon is zero, every performance standard, subsidy, or limit is fighting an uphill battle. People want to comply, but evolution selects for those who can figure out how to comply the least. Every idea that’s not covered by a standard faces a deep “valley of death” when it attempts to enter the market.

At present, we can’t let go of this patchwork of standards (wingwalker’s rule – don’t let go of one thing until you have hold of another). But in the long run, we need to start activating every possible tradeoff that improves emissions. That requires a uniform that pervades the economy. Then rules and standards can backfill the remaining market failures, resulting in a system of regulation that’s more effective and less intrusive.

Cynefin, Complexity and Attribution

This nice article on the human skills needed to deal with complexity reminded me of Cynefin.

Cynefin framework by Edwin Stoop

Generally, I find the framework useful – it’s a nice way of thinking about the nature of a problem domain and therefore how one might engage. (One caution: the meaning of the chaotic domain differs from that in nonlinear dynamics.)

However, I think the framework’s policy prescription in the complex domain falls short of appreciating the full implications of complexity, at least of dynamic complexity as we think of it in SD: Continue reading “Cynefin, Complexity and Attribution”

Vi Hart on positive feedback driving polarization

Vi Hart’s interesting comments on the dynamics of political polarization, following the release of an innocuous video:

I wonder what made those commenters think we have opposite views; surely it couldn’t just be that I suggest people consider the consequences of their words and actions. My working theory is that other markers have placed me on the opposite side of a cultural divide that they feel exists, and they are in the habit of demonizing the people they’ve put on this side of their imaginary divide with whatever moral outrage sounds irreproachable to them. It’s a rather common tool in the rhetorical toolset, because it’s easy to make the perceived good outweigh the perceived harm if you add fear to the equation.

Many groups have grown their numbers through this feedback loop: have a charismatic leader convince people there’s a big risk that group x will do y, therefore it seems worth the cost of being divisive with those who think that risk is not worth acting on, and that divisiveness cuts out those who think that risk is lower, which then increases the perceived risk, which lowers the cost of being increasingly divisive, and so on.

The above feedback loop works great when the divide cuts off a trust of the institutions of science, or glorifies a distrust of data. It breaks the feedback loop if you act on science’s best knowledge of the risk, which trends towards staying constant, rather than perceived risk, which can easily grow exponentially, especially when someone is stoking your fear and distrust.

If a group believes that there’s too much risk in trusting outsiders about where the real risk and harm are, then, well, of course I’ll get distrustful people afraid that my mathematical views on risk/benefit are in danger of creating a fascist state. The risk/benefit calculation demands it be so.

A conversation about infrastructure

A conversation about infrastructure, with Carter Williams of iSelect and me:

The $3 Trillion Problem: Solving America’s Infrastructure Crisis

I can’t believe I forgot to mention one of the most obvious System Dynamics insights about infrastructure:

There are two ways to fill a leaky bucket – increase the inflow, or plug the outflows. There’s always lots of enthusiasm for increasing the inflow by building new stuff. But there’s little sense in adding to the infrastructure stock if you can’t maintain what you have. So, plug the leaks first, and get into a proactive maintenance mode. Then you can have fun building new things – if you can afford it.

Dynamics of Term Limits

I am a little encouraged to see that the very top item on Trump’s first 100 day todo list is term limits:

* FIRST, propose a Constitutional Amendment to impose term limits on all members of Congress;

Certainly the defects in our electoral and campaign finance system are among the most urgent issues we face.

Assuming other Republicans could be brought on board (which sounds unlikely), would term limits help? I didn’t have a good feel for the implications, so I built a model to clarify my thinking.

I used our new tool, Ventity, because I thought I might want to extend this to multiple voting districts, and because it makes it easy to run several scenarios with one click.

Here’s the setup:

structure

The model runs over a long series of 4000 election cycles. I could just as easily run 40 experiments of 100 cycles or some other combination that yielded a similar sample size, because the behavior is ergodic on any time scale that’s substantially longer than the maximum number of terms typically served.

Each election pits two politicians against one another. Normally, an incumbent faces a challenger. But if the incumbent is term-limited, two challengers face each other.

The electorate assesses the opponents and picks a winner. For challengers, there are two components to voters’ assessment of attractiveness:

  • Intrinsic performance: how well the politician will actually represent voter interests. (This is a tricky concept, because voters may want things that aren’t really in their own best interest.) The model generates challengers with random intrinsic attractiveness, with a standard deviation of 10%.
  • Noise: random disturbances that confuse voter perceptions of true performance, also with a standard deviation of 10% (i.e. it’s hard to tell who’s really good).

Once elected, incumbents have some additional features:

  • The assessment of attractiveness is influenced by an additional term, representing incumbents’ advantages in electability that arise from things that have no intrinsic benefit to voters. For example, incumbents can more easily attract funding and press.
  • Incumbent intrinsic attractiveness can drift. The drift has a random component (i.e. a random walk), with a standard deviation of 5% per term, reflecting changing demographics, technology, etc. There’s also a deterministic drift, which can either be positive (politicians learn to perform better with experience) or negative (power corrupts, or politicians lose touch with voters), defaulting to zero.
  • The random variation influencing voter perceptions is smaller (5%) because it’s easier to observe what incumbents actually do.

There’s always a term limit of some duration active, reflecting life expectancy, but the term limit can be made much shorter.

Here’s how it behaves with a 5-term limit:

terms

Politicians frequently serve out their 5-term limit, but occasionally are ousted early. Over that period, their intrinsic performance varies a lot:

attractiveness

Since the mean challenger has 0 intrinsic attractiveness, politicians outperform the average frequently, but far from universally. Underperforming politicians are often reelected.

Over a long time horizon (or similarly, many districts), you can see how average performance varies with term limits:

long

With no learning, as above, term limits degrade performance a lot (top panel). With a 2-term limit, the margin above random selection is about 6%, whereas it’s twice as great (>12%) with a 10-term limit. This is interesting, because it means that the retention of high-performing politicians improves performance a lot, even if politicians learn nothing from experience.

This advantage holds (but shrinks) even if you double the perception noise in the selection process. So, what does it take to justify term limits? In my experiments so far, politician performance has to degrade with experience (negative learning, corruption or losing touch). Breakeven (2-term limits perform the same as 10-term limits) occurs at -3% to -4% performance change per term.

But in such cases, it’s not really the term limits that are doing the work. When politician performance degrades rapidly with time, voters throw them out. Noise may delay the inevitable, but in my scenario, the average politician serves only 3 terms out of a limit of 10. Reducing the term limit to 1 or 2 does relatively little to change performance.

Upon reflection, I think the model is missing a key feature: winner-takes-all, redistricting and party rules that create safe havens for incompetent incumbents. In a district that’s split 50-50 between brown and yellow, an incompetent brown is easily displaced by a yellow challenger (or vice versa). But if the split is lopsided, it would be rare for a competent yellow challenger to emerge to replace the incompetent yellow incumbent. In such cases, term limits would help somewhat.

I can simulate this by making the advantage of incumbency bigger (raising the saturation advantage parameter):

attractiveness2

However, long terms are a symptom of the problem, not the root cause. Therefore it probably necessary in addition to address redistricting, campaign finance, voter participation and education, and other aspects of the electoral process that give rise to the problem in the first place. I’d argue that this is the single greatest contribution Trump could make.

You can play with the model yourself using the Ventity beta/trial and this model archive:

termlimits4.zip