Opiod Epidemic Dynamics

I ran across an interesting dynamic model of the opioid epidemic that makes a good target for replication and critique:

Prevention of Prescription Opioid Misuse and Projected Overdose Deaths in the United States

Qiushi Chen; Marc R. Larochelle; Davis T. Weaver; et al.

Importance  Deaths due to opioid overdose have tripled in the last decade. Efforts to curb this trend have focused on restricting the prescription opioid supply; however, the near-term effects of such efforts are unknown.

Objective  To project effects of interventions to lower prescription opioid misuse on opioid overdose deaths from 2016 to 2025.

Design, Setting, and Participants  This system dynamics (mathematical) model of the US opioid epidemic projected outcomes of simulated individuals who engage in nonmedical prescription or illicit opioid use from 2016 to 2025. The analysis was performed in 2018 by retrospectively calibrating the model from 2002 to 2015 data from the National Survey on Drug Use and Health and the Centers for Disease Control and Prevention.

Conclusions and Relevance  This study’s findings suggest that interventions targeting prescription opioid misuse such as prescription monitoring programs may have a modest effect, at best, on the number of opioid overdose deaths in the near future. Additional policy interventions are urgently needed to change the course of the epidemic.

The model is fully described in supplementary content, but unfortunately it’s implemented in R and described in Greek letters, so it can’t be run directly:

That’s actually OK with me, because I think I learn more from implementing the equations myself than I do if someone hands me a working model.

While R gives you access to tremendous tools, I think it’s not a good environment for designing and testing dynamic models of significant size. You can’t easily inspect everything that’s going on, and there’s no easy facility for interactive testing. So, I was curious whether that would prove problematic in this case, because the model is small.

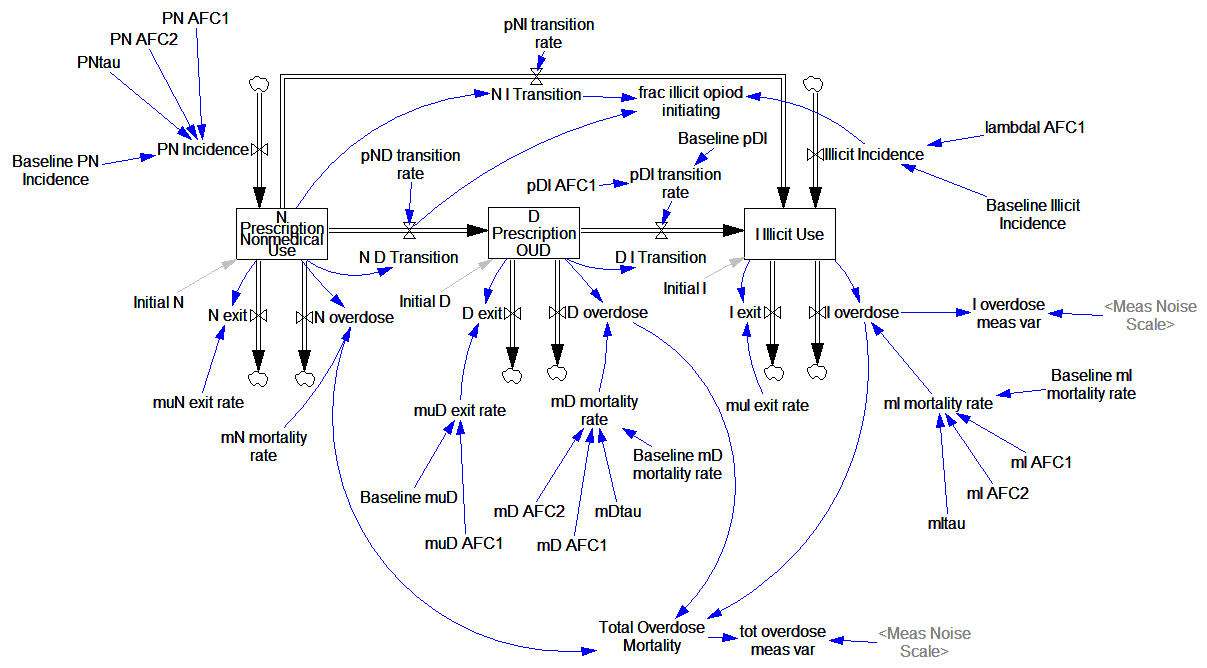
Here’s what it looks like, replicated in Vensim:

It looks complicated, but it’s not complex. It’s basically a cascade of first-order delay processes: the outflow from each stock is simply a fraction per time. There are no large-scale feedback loops. Continue reading “Opiod Epidemic Dynamics”

Modeling Investigations

538 had this cool visualization of the Russia investigation in the context of Watergate, Whitewater, and other historic investigations.

The original is fun to watch, but I found it hard to understand the time dynamics from the animation. For its maturity (660 days and counting), has the Russia investigation yielded more or fewer indictments than Watergate (1492 days total)? Are the indictments petering out, or accelerating?

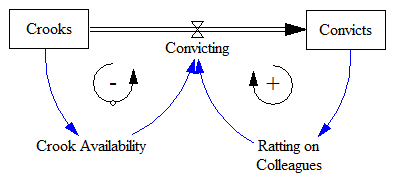
A simplified version of the problem looks a lot like an infection model (a.k.a. logistic growth or Bass diffusion):

So, the interesting question is whether we can – from partway through the history of the system – estimate the ultimate number of indictments and convictions it will yield. This is fraught with danger, especially when you have no independent information about the “physics” of the system, especially the population of potential crooks to be caught. Continue reading “Modeling Investigations”

Biological Dynamics of Stress Response

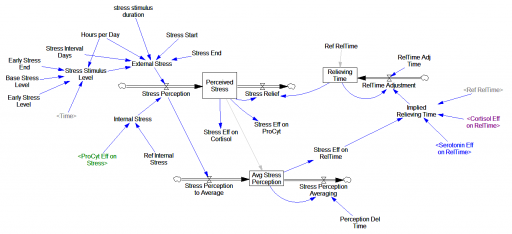
At ISDC 2018, we gave the Dana Meadows Award for best student paper to Gizem Aktas, for Modeling the Biological Mechanisms that Determine the Dynamics of Stress Response of the Human Body (with Yaman Barlas)This is a very interesting paper that elegantly synthesizes literature on stress, mood, and hormone interactions. I plan to write more about it later, but for the moment, here’s the model for your exploration.

The dynamic stress response of the human body to stressors is produced by nonlinear interactions among its physiological sub-systems. The evolutionary function of the response is to enable the body to cope with stress. However, depending on the intensity and frequency of the stressors, the mechanism may lose its function and the body can go into a pathological state. Three subsystems of the body play the most essential role in the stress response: endocrine, immune and neural systems. We constructed a simulation model of these three systems to imitate the stress response under different types of stress stimuli. Cortisol, glucocorticoid receptors, proinflammatory cytokines, serotonin, and serotonin receptors are the main variables of the model. Using both qualitative and quantitative physiological data, the model is structurally and behaviorally well-validated. In subsequent scenario runs, we have successfully replicated the development of major depression in the body. More interestingly, the model can present quantitative representation of some very well acknowledged qualitative hypotheses about the stress response of the body. This is a novel quantitative step towards the comprehension of stress response in relation with other disorders, and it provides us with a tool to design and test treatment methods.

The original is a STELLA model; here I’ve translated it to Vensim and made some convenience upgrades. I used the forthcoming XMILE translation in Vensim to open the model. You get an ugly diagram (due to platform differences and XMILE’s lack of support for flow-clouds), but it’s functional enough to browse. I cleaned up the diagrams and moved them into multiple views to take better advantage of Vensim’s visual approach.

Continue reading “Biological Dynamics of Stress Response”

Dynamic Cohorts

This is the model library entry for my ISDC 2017 plenary paper with Larry Yeager on dynamic cohorts in Ventity:

Dynamic cohorts: a new approach to managing detail

While it is desirable to minimize the complexity of a model, some problems require the detailed representation of heterogeneous subgroups, where nonlinearities prevent aggregation or explicit chronological aging is needed. It is desirable to have a representation that avoids burdening the modeler or user computationally or cognitively. Eberlein & Thompson (2013) propose continuous cohorting, a novel solution to the cohort blending problem in population modeling, and test it against existing aging chain and cohort-shifting approaches. Continuous cohorting prevents blending of ages and other properties, at at some cost in complexity.

We propose another new solution, dynamic cohorts, that prevents blending with a comparatively low computational burden. More importantly, the approach simplifies the representation of distinct age, period and cohort effects and representation of dynamics other than the aging process, like migration and attribute coflows. By encapsulating the lifecycle of a representative cohort in a single entity, rather than dispersing it across many states over time, it makes it easier to develop and explain the model structure.

Paper: Dynamic Cohorts P1363.pdf

Models: Dynamic Cohorts S1363.zip

Presentation slides: Dynamic Cohorts Fid Ventana v2b.pdf

I’ve previously written about this here.

The Beer Game

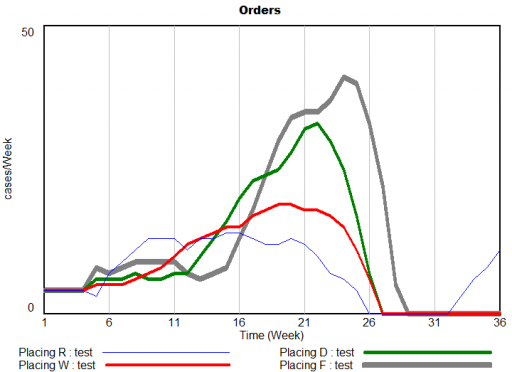
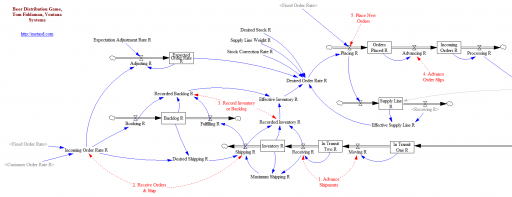
The Beer Game is the classic business game in system dynamics, demonstrating just how tricky it can be to manage a seemingly-simple system with delays and feedback. It’s a great icebreaker for teams, because it makes it immediately clear that catastrophes happen endogenously and fingerpointing is useless.

The system demonstrates amplification, aka the bullwhip effect, in supply chains. John Sterman analyzes the physical and behavioral origins of underperformance in the game in this Management Science paper. Steve Graves has some nice technical observations about similar systems in this MSOM paper.

Here are two versions that are close to the actual board game and the Sterman article:

Beer Game Fiddaman NoSubscripts.zip

This version doesn’t use arrays, and therefore should be usable in Vensim PLE. It includes a bunch of .cin files that implement the (calibrated) decision heuristics of real teams of the past, as well as some sensitivity and optimization control files.

Beer Game Fiddaman Array.zip

This version does use arrays to represent the levels of the supply chain. That makes it a little harder to grasp, but much easier to modify if you want to add or remove levels from the system or conduct optimization experiments. It requires Vensim Pro or DSS, or the Model Reader.

Thyroid Dynamics

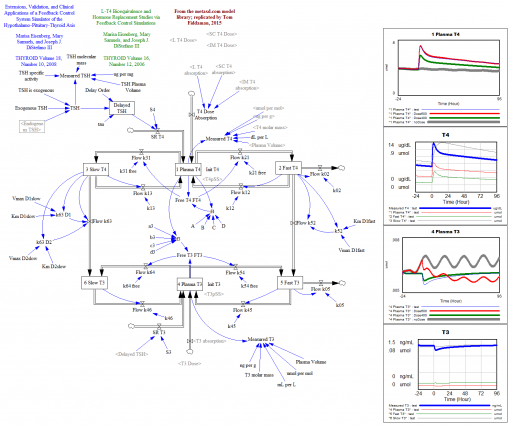
Quite a while back, I posted about the dynamics of the thyroid and its interactions with other systems.

That was a conceptual model; this is a mathematical model. This is a Vensim replication of:

Marisa Eisenberg, Mary Samuels, and Joseph J. DiStefano III

Extensions, Validation, and Clinical Applications of a Feedback Control System Simulator of the Hypothalamo-Pituitary-Thyroid Axis

Background:We upgraded our recent feedback control system (FBCS) simulation model of human thyroid hormone (TH) regulation to include explicit representation of hypothalamic and pituitary dynamics, and up-dated TH distribution and elimination (D&E) parameters. This new model greatly expands the range of clinical and basic science scenarios explorable by computer simulation.

Methods: We quantified the model from pharmacokinetic (PK) and physiological human data and validated it comparatively against several independent clinical data sets. We then explored three contemporary clinical issues with the new model: …

… These results highlight how highly nonlinear feedback in the hypothalamic-pituitary-thyroid axis acts to maintain normal hormone levels, even with severely reduced TSH secretion.

THYROID
Volume 18, Number 10, 2008
DOI: 10.1089=thy.2007.0388

This version is a superset of the authors’ earlier 2006 model, and closely reproduces that with a few parameter changes.

L-T4 Bioequivalence and Hormone Replacement Studies via Feedback Control Simulations

THYROID
Volume 16, Number 12, 2006

The model is used in:

TSH-Based Protocol, Tablet Instability, and Absorption Effects on L-T4 Bioequivalence

THYROID
Volume 19, Number 2, 2009
DOI: 10.1089=thy.2008.0148

This works with any Vensim version:

thyroid 2008 d.mdl

thyroid 2008 d.vpm

The Dynamics of Initiative Success

This is a new replication of a classic model, for the library. The model began in Nelson Repenning’s thesis, and was later published in Organization Science:

A Simulation-Based Approach to Understanding the Dynamics of Innovation Implementation

The history of management practice is filled with innovations that failed to live up to the promise suggested by their early success. A paradox currently facing organizational theory is that the failure of these innovations often cannot be attributed to an intrinsic lack of efficacy. To resolve this paradox, in this paper I study the process of innovation implementation. Working from existing theoretical frameworks, I synthesize a model that describes the process through which participants in an organization develop commitment to using a newly adopted innovation. I then translate that framework into a formal model and analyze it using computer simulation. The analysis suggests three new constructs—reversion, regeneration, and the motivation threshold—characterizing the dynamics of implementation. Taken together, the constructs provide an internally consistent theory of how seemingly rational decision rules can create the apparent paradox of innovations that generate early results but fail to produce sustained benefit.

An earlier version is online here.

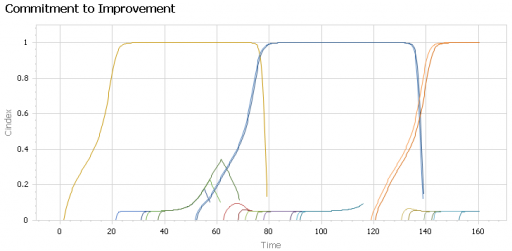
This is another nice example of tipping points. In this case, an initiative must demonstrate enough early success to grow its support base. If it succeeds, word of mouth takes its commitment level to 100%. If not, the positive feedbacks run as vicious cycles, and the initiative fails.

When initiatives compete for scarce resources, this creates a success to the successful dynamic, in which an an initiative that demonstrates early success attracts more support, grows commitment faster, and thereby demonstrates more success.

This version is in Ventity, in order to make it easier to handle multiple competing initiatives, with each as a discrete entity. One initialization dataset for the model creates initiatives at random intervals, with success contingent on the environment (other initiatives) prevailing at the time of launch:

This archive contains two versions of the model: “Intervention2” is the first in the paper, with no resource competition. “Intervention5” is the second, with multiple competing initiatives.

Innovation2+5.zip

Nelson Rules

I ran across the Nelson Rules in a machine learning package. These are a set of heuristics for detecting changes in statistical process control. Their inclusion felt a bit like navigating a 787 with a mechanical flight computer (which is a very cool device, by the way).

The idea is pretty simple. You have a time series of measurements, normalized to Z-scores, and therefore varying (most of the time) by plus or minus 3 standard deviations. The Nelson Rules provide a way to detect anomalies: drift, oscillation, high or low variance, etc. Rule 1, for example, is just a threshold for outlier detection: it fires whenever a measurement is more than 3 SD from the mean.

In the machine learning context, it seems strange to me to use these heuristics when more powerful tests are available. This is not unlike the problem of deciding whether a random number generator is really random. It’s fairly easy to determine whether it’s producing a uniform distribution of values, but what about cycles or other long-term patterns? I spent a lot of time working on this when we replaced the RNG in Vensim. Many standard tests are available. They’re not all directly applicable, but the thinking is.

In any case, I got curious how the Nelson rules performed in the real world, so I developed a test model.

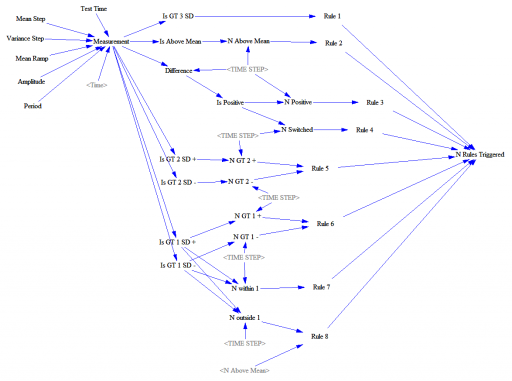
This feeds a test input (Normally distributed random values, with an optional signal superimposed) into a set of accounting variables that track metrics and compare with the rule thresholds. Some of these are complex.

Rule 4, for example, looks for 14 points with alternating differences. That’s a little tricky to track in Vensim, where we’re normally more interested in continuous time. I tackle that with the following structure:

Difference = Measurement-SMOOTH(Measurement,TIME STEP)
**************************************************************
Is Positive=IF THEN ELSE(Difference>0,1,-1)
**************************************************************
N Switched=INTEG(IF THEN ELSE(Is Positive>0 :AND: N Switched<0
,(1-2*N Switched )/TIME STEP
,IF THEN ELSE(Is Positive<0 :AND: N Switched>0
 ,(-1-2*N Switched)/TIME STEP
 ,(Is Positive-N Switched)/TIME STEP)),0)
**************************************************************
Rule 4=IF THEN ELSE(ABS(N Switched)>14,1,0)
**************************************************************

There’s a trick here. To count alternating differences, we need to know (a) the previous count, and (b) whether the previous difference encountered was positive or negative. Above, N Switched stores both pieces of information in a single stock (INTEG). That’s possible because the count is discrete and positive, so we can overload the storage by giving it the sign of the previous difference encountered.

Thus, if the current difference is negative (Is Positive < 0) and the previous difference was positive (N Switched > 0), we (a) invert the sign of the count by subtracting 2*N Switched, and (b) augment the count, here by subtracting 1 to make it more negative.

Similar tricks are used elsewhere in the structure.

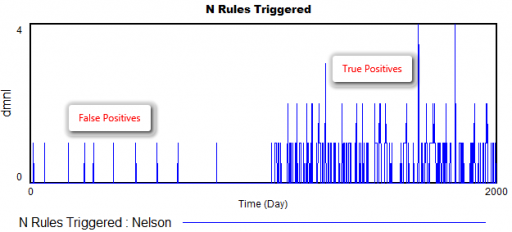
How does it perform? Surprisingly well. Here’s what happens when the measurement distribution shifts by one standard deviation halfway through the simulation:

There are a few false positives in the first 1000 days, but after the shift, there are many more detections from multiple rules.

The rules are pretty good at detecting a variety of pathologies: increases or decreases in variance, shifts in the mean, trends, and oscillations. The rules also have different false positive rates, which might be OK, as long as they catch nonoverlapping problems, and don’t have big differences in sensitivity as well. (The original article may have more to say about this – I haven’t checked.)

However, I’m pretty sure that I could develop some pathological inputs that would sneak past these rules. By contrast, I’m pretty sure I’d have a hard time sneaking anything past the NIST or Diehard RNG test suites.

If I were designing this from scratch, I’d use machine learning tools more directly – there are lots of tests for distributions, changes, trend breaks, oscillation, etc. that can be used online with a consistent likelihood interpretation and optimal false positive/negative tradeoffs.

Here’s the model:

NelsonRules1.mdl

NelsonRules1.vpm

Dynamics of the last Twinkie

When Hostess went bankrupt in 2012, there was lots of speculation about the fate of the last Twinkie, perhaps languishing on the dusty shelves of a gas station convenience store somewhere in New Mexico. Would that take ten days, ten weeks, ten years?

So, what does this have to do with system dynamics? It calls to mind the problem of modeling the inventory stockout constraint on sales. This problem dates back to Industrial Dynamics (see the variable NIR driving SSR and the discussion around figs. 15-5 and 15-7).

If there’s just one product in one inventory (i.e. one store), and visibility doesn’t matter, the constraint is pretty simple. As long as there’s one item left, sales or shipments can proceed. The constraint then is:

(1) selling = MIN(desired selling, inventory/time step)

In other words, the most that can be sold in one time step is the amount of inventory that’s actually on hand. Generically, the constraint looks like this:
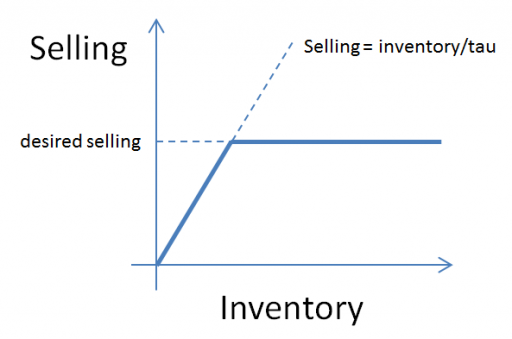
Here, tau is a time constant, that could be equal to time step (DT), as above, or could be generalized to some longer interval reflecting handling and other lags.

This can be further generalized to some kind of continuous function, like:

(2) selling = desired selling * f( inventory )

where f() is often a lookup table. This can be a bit tricky, because you have to ensure that f() goes to zero fast enough to obey the inventory/DT constraint above.

But what if you have lots of products and/or lots of inventory points, perhaps with different normal turnover rates? How does this aggregate? I built the following toy model to find out. You could easily do this in Vensim with arrays, but I found that it was ideally suited to Ventity.

Here’s the setup:

First, there’s a collection of Store entities, each with an inventory. Initial inventory is random, with a Poisson distribution, which ensures integer twinkies. Customer arrivals also have a Poisson distribution, and (optionally), the mean arrival rate varies by store. Selling is constrained to stock on hand via inventory/DT, and is also subject to a visibility effect – shelf stock influences the probability that a customer will buy a twinkie (realized with a Binomial distribution). The visibility effect saturates, so that there are diminishing returns to adding stock, as occurs when new stock goes to the back rows of the shelf, for example.
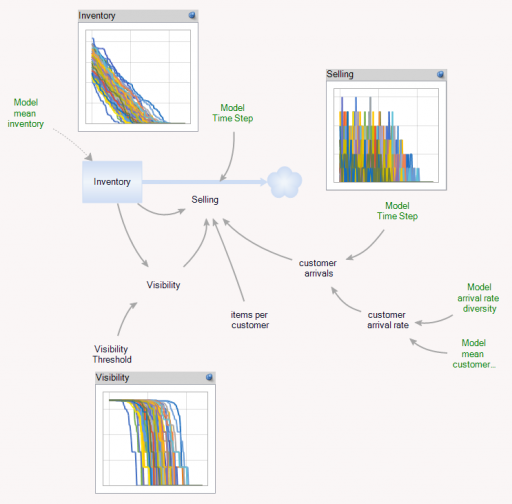
In addition, there’s an Aggregate entitytype, which is very similar to the Store, but deterministic and continuous.
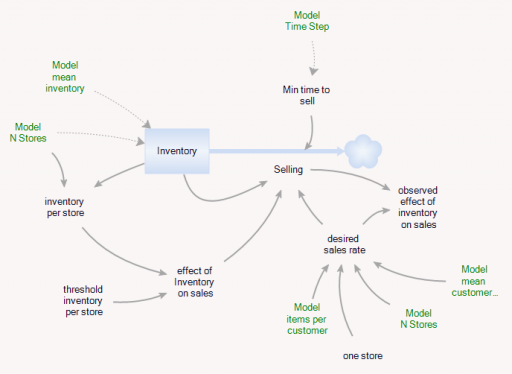
The Aggregate’s initial inventory and sales rates are set to the expected values for individual stores. Two different kinds of constraints on the inventory outflow are available: inventory/tau, and f(inventory). The sales rate simplifies to:

(3) selling = min(desired sales rate*f(inventory),Inventory/Min time to sell)

(4) min time to sell >= time step

In the Store and the Aggregate, the nonlinear effect of inventory on sales (called visibility in the store) is given by

(5) f(inventory) = 1-Exp(-Inventory/Threshold)

However, the aggregate threshold might be different from the individual store threshold (and there’s no compelling reason for the aggregate f() to match the individual f(); it was just a simple way to start).

In the Store[] collection, I calculate aggregates of the individual stores, which look quite continuous, even though the population is only 100. (There are over 100,000 gas stations in the US.)
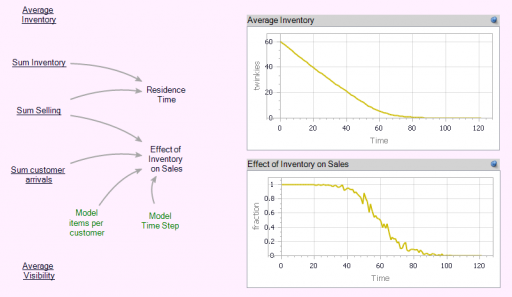
Notice that the time series behavior of the effect of inventory on sales is sigmoid.

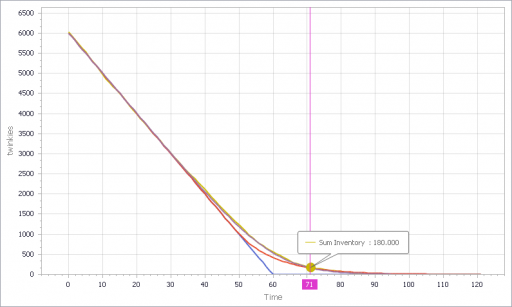
Now we can compare individual and aggregate behavior:

Inventory
Selling
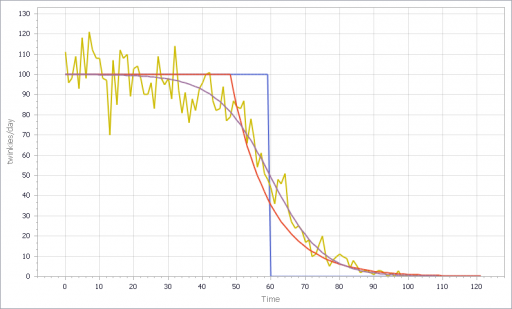
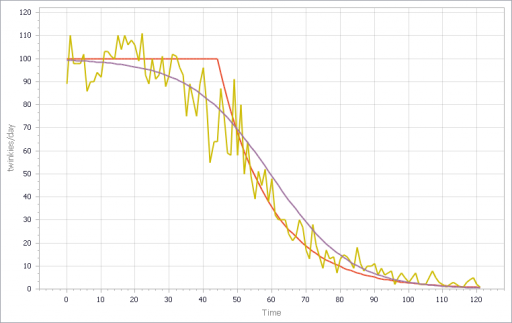
The noisy yellow line is the sum of the individual Stores. The blue line arises from imposing a hard cutoff, equation (1) above. This is like assuming that all stores are equal, and inventory doesn’t affect sales, until it’s gone. Clearly it’s not a great fit, though it might be an adequate shortcut where inventory dynamics are not really the focus of a model.

The red line also imposes an inventory/tau constraint, but the time constant (tau) is much longer than the time step, at 8 days (time step = 1 day). Finally, the purple sigmoid line arises from imposing the nonlinear f(inventory) constraint. It’s quite a good fit, but the threshold for the aggregate must be about twice as big as for the individual Stores.

However, if you parameterize f() poorly, and omit the inventory/tau constraint, you get what appear to be chaotic oscillations – cool, but obviously unphysical:
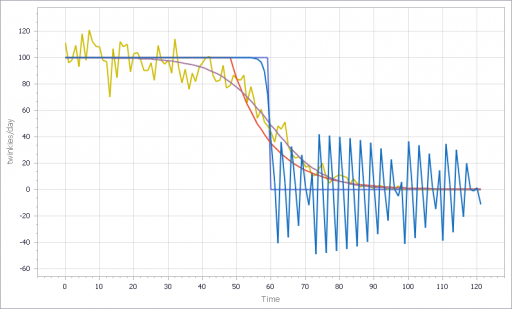
If, in addition, you add diversity in Store’s customer arrival rates, you get a longer tail on inventory. That last Twinkie is likely to be in a low-traffic outlet. This makes it a little tougher to fit all parts of the curve:
I think there are some interesting questions here, that would make a great paper for the SD conference:

  • (Under what conditions) can you derive the functional form of the aggregate constraint from the properties of the individual Stores?
  • When do the deficiencies of shortcut approaches, that may lack smooth derivatives, matter in aggregate models like Industrial dynamics?
  • What are the practical implications for marketing models?
  • What can you infer about inventory levels from aggregate data alone?
  • Is that really chaos?

Have at it!

The Ventity model: LastTwinkie1.zip
Job tenure dynamics

This is a simple model of the dynamics of employment in a sector. I built it for a LinkedIn article that describes the situation and the data.

The model is interesting and reasonably robust, but it has (at least) three issues you should know about:

  • The initialization in equilibrium isn’t quite perfect.
  • The sector-entry decision (Net Entering) is not robust to low unemployment. In some situations, a negative net entering flow could cause negative Job Seekers.
  • The sector-entry decision also formulates attractiveness exclusively as a function of salaries; in fact, it should also account for job availability (perceived vacancy and unemployment rates).

Correcting these shortcomings shouldn’t be too hard, and it should make the model’s oscillatory tendencies more realistic. I leave this as an exercise for you. Drop me a note if you have an improved version.

The model requires Vensim (any version, including free PLE).

Download employees1.mdl